OPEN-SOURCE SCRIPT
Zaktualizowano Awesome Cumulative Volume Oscillator

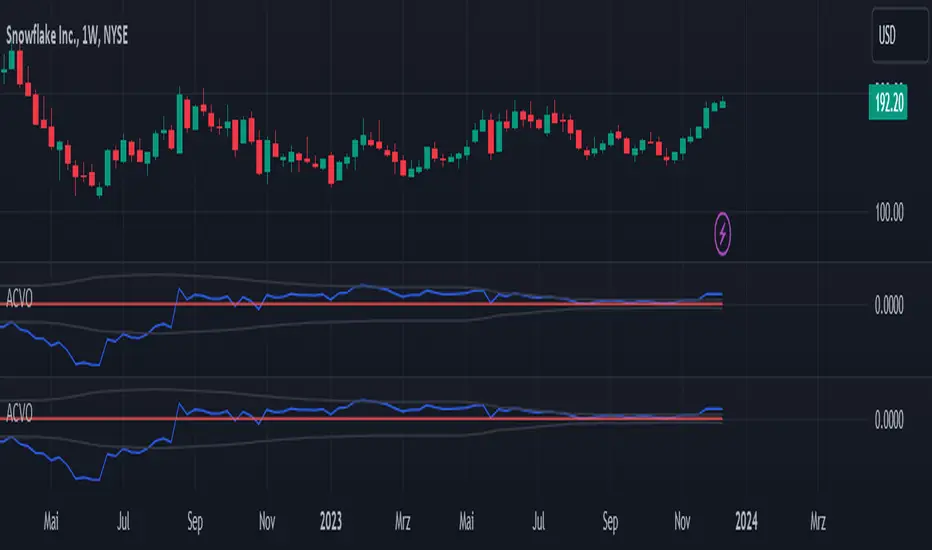
The indicator is called the "Awesome Cumulative Volume Oscillator" (ACVO), which analyzes the cumulative trading volume of the underlying asset.
The indicator also plots the deviation of the cumulative trading volume from the first SMA value, which is referred to as the "Cumulative Volume Deviation". The zero-line is plotted as a reference point.
If the "Cumulative Volume Deviation" is greater than 0, it indicates an uptrend, as the cumulative trading volume is above the first SMA value. If the "Cumulative Volume Deviation" is less than 0, it indicates a downtrend, as the cumulative trading volume is below the first SMA value.
However, it is important to note that using a single indicator is not sufficient to conduct a comprehensive market analysis. It is necessary to combine multiple indicators and analysis methods to make informed trading decisions.
Informacje o Wersji
The indicator is called the "Awesome Cumulative Volume Oscillator" (ACVO), which analyzes the cumulative trading volume of the underlying asset.The indicator also plots the deviation of the cumulative trading volume from the first SMA value, which is referred to as the "Cumulative Volume Deviation". The zero-line is plotted as a reference point.
If the "Cumulative Volume Deviation" is greater than 0, it indicates an uptrend, as the cumulative trading volume is above the first SMA value. If the "Cumulative Volume Deviation" is less than 0, it indicates a downtrend, as the cumulative trading volume is below the first SMA value.
However, it is important to note that using a single indicator is not sufficient to conduct a comprehensive market analysis. It is necessary to combine multiple indicators and analysis methods to make informed trading decisions.
Skrypt open-source
W zgodzie z duchem TradingView twórca tego skryptu udostępnił go jako open-source, aby użytkownicy mogli przejrzeć i zweryfikować jego działanie. Ukłony dla autora. Korzystanie jest bezpłatne, jednak ponowna publikacja kodu podlega naszym Zasadom serwisu.
Wyłączenie odpowiedzialności
Informacje i publikacje nie stanowią i nie powinny być traktowane jako porady finansowe, inwestycyjne, tradingowe ani jakiekolwiek inne rekomendacje dostarczane lub zatwierdzone przez TradingView. Więcej informacji znajduje się w Warunkach użytkowania.