OPEN-SOURCE SCRIPT
Cumulative Net Volume
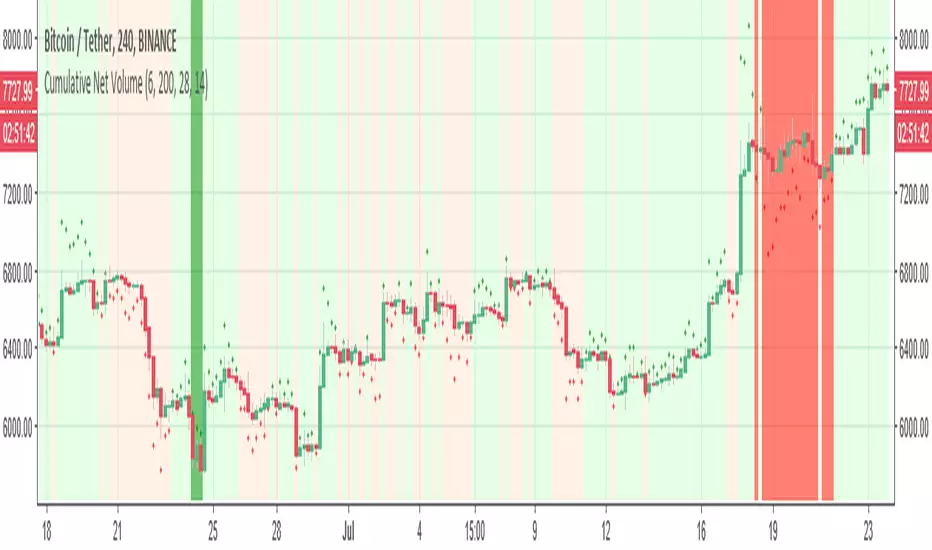
This indicator calculate the Cumulative Net Volume (volume in versus volume out) as seen in red and green cross
I normalize it to be as price indicator -then using color setting it easy to see when volume influx is positive compare to negative period
next step -I add rsi and Bollinger to highlight the area where volume is going up or down with the best period by rsi and Bollinger (green red)
it easy indicator for starter to see where the best buy or sell point
have fun
Skrypt open-source
W zgodzie z duchem TradingView twórca tego skryptu udostępnił go jako open-source, aby użytkownicy mogli przejrzeć i zweryfikować jego działanie. Ukłony dla autora. Korzystanie jest bezpłatne, jednak ponowna publikacja kodu podlega naszym Zasadom serwisu.
Wyłączenie odpowiedzialności
Informacje i publikacje nie stanowią i nie powinny być traktowane jako porady finansowe, inwestycyjne, tradingowe ani jakiekolwiek inne rekomendacje dostarczane lub zatwierdzone przez TradingView. Więcej informacji znajduje się w Warunkach użytkowania.