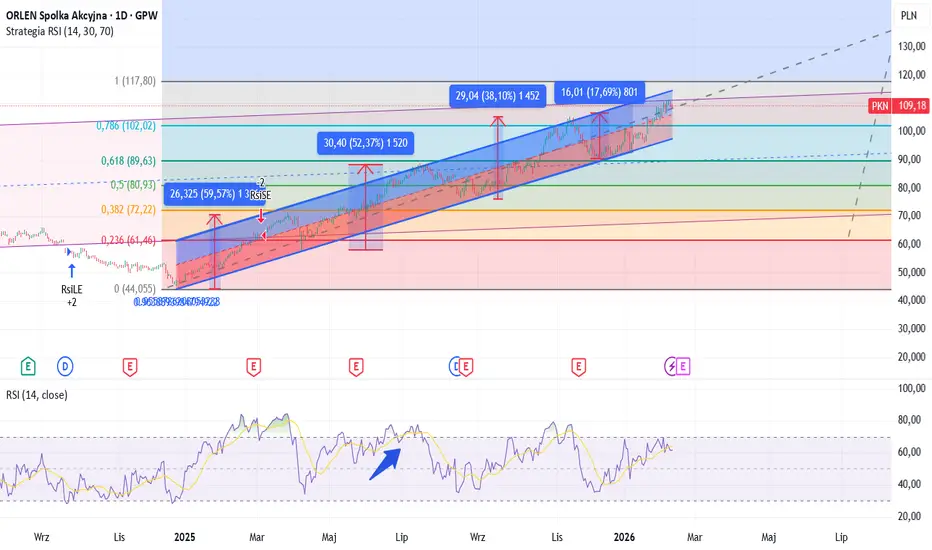
PKN orlen analiza ATPKN orlen analiza AT
Kanał wzrostowy utrzymany.
Pułapy wzrostowe utrzymane.
Problem w tym, że dane spływające nie są pozytywne, a mimo to rośnie.?
Dywidenda i spekulacja ?
Mi wychodzi 117,50 - 120,50, jak widać :)
Spodziewam się korekty minimum do 100, pod utrzymanie kanału.
Następnie pod dywidendę do 110-113 i na dół :) -30/40%
Surowce Energetyczne
Znowu korekta na ropie (WTI) jak rok i 2 lata temu w grudniu?Cześć! Rok temu opublikowałem podobną analizę ropy, wtedy uważałem po zrobieniu analizy iż mamy koniec bessy i głównie wzrosty na ropie będą, była to korekta, ale cena się zrealizowała zgodnie z moimi przewidywaniami.
Na wykresie zaznaczyłem 2 roczne wolumeny (2024 i 2025) i na nich wartość POC czyli białą poziomą grubą linię będącą średnią wartością z całego roku, dokąd dąży cena.
Zielone prostokąty to strefa BUY ZONE,
niebieskie prostokąty ze strzałką to wyznacznik o ile procentowo cena byczo odbijała i jest to co najmniej 15%.
Pierwsze zniesienie Fibo to możliwe fałszywe wybicie ceny BUY zone, najprawdopodobniej do wartości 1,618. Jeśli cena zejdzie niżej, np do wartości 2 - to mamy kontynuację bessy czego się lekko obawiam jako że Trump rządzi w USA.
Drugie zniesienie Fibo to idealne miejsce wejścia na LONG (0 na zniesieniu) i TP przy wartości 2,5 TP lub po prostu wymierzyć 15 % od najniższej świecy w BUY zone, która być może dopiero powstanie. TP jest płynne dlatego iż czekamy a sygnał do korekty (wzrostów).
Ja zasugerowałem TP przy wartości 64,37.
Dodatkowo w podjęciu decyzji powinny nam pomóc średnie kroczące, w pierwszej kolejności EMA 11 powinna w górę wybić nad SMA 33 (niebieska).
Warto porównać na różnych interwałach czy mamy spadki czy wzrosty. Jeśli odpowiedź jest mieszana - NIE wchodzimy. Najlepiej aby na 3 różnych interwałach była EMA 11 nad SMA 33 czyli wzrosty.
Ps. Stop Loss? Ustawiłbym przy wartości -1 obliczając zniesienie Fibo - na wykresie u mnie widać przy wartości 53,53
Ps2. Przepraszam jeśli coś jest niezrozumiałe, piszcie wtedy co takiego i wezmę to pod uwagę.

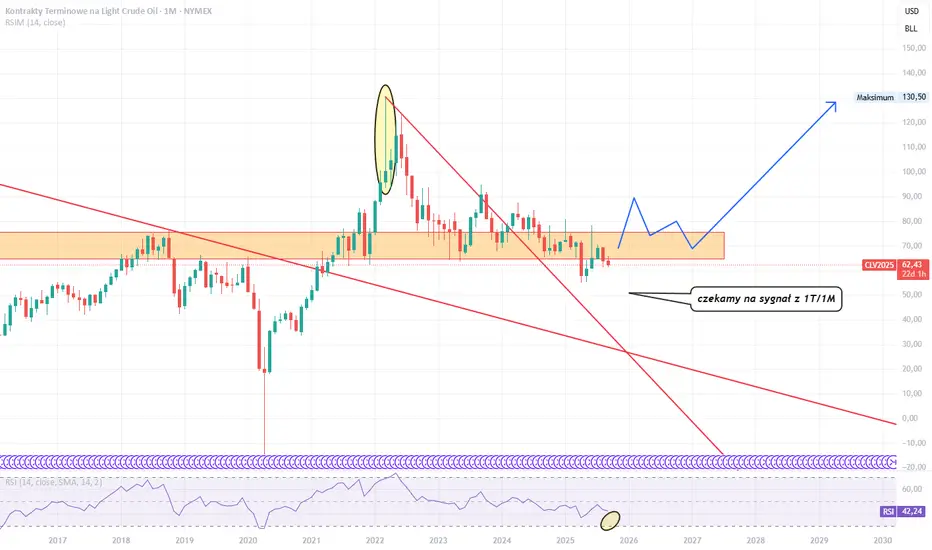
WTI🌎 Główne banki inwestycyjne prognozują dwa etapy dla ropy naftowej: spadek z powodu nadpodaży, a następnie wzrost od 2027 r. z powodu braku inwestycji.
Po 2027 r.: Rozpocznie się przedłużony okres wzrostu z powodu niedoboru surowców.
Obserwowany jest stopniowy, powolny spadek cen ropy naftowej.
Znajdujemy się w pobliżu poziomu wsparcia, którego przełamanie mogłoby przyspieszyć spadek cen.

Ropa z miejscem na spadkiPrzebicie obecnego dołka wskaże presję na realizacje korekty płaskiej (trójkąta), gdzie znajdują się strefy popytowe dla tego ruchu. Jednocześnie będzie wypełniony ruch 5 falowy, a samo zaliczenie tej strefy powinno być punktem zwrotnym.

Ropa - Tykająca bomba!Ropa jest surowcem strategicznym i cena bardzo mocno powiązana jest z polityką.
Być może prawdą jest, że cena sztucznie jest utrzymywana nisko przez największych eksporterów, by jak najbardziej obniżyć zyski Rosji.
Zamrożenie konfliktu może być zapalnikiem dla wystrzału cen ropy po historyczne maksima i wyżej.
Dlaczego tak? Oto kilka przykładów:
- słaby dolar (ropa wyceniana jest w dolarze, a więc mniej państwa eksportujące mogą za zarobione dolary kupić, niż w przypadku silnego dolara)
- Ceny innych surowców jak złoto, srebro, platyna, pallad w ostatnim czasie rośnie,
- Coraz to nowsze szczyty na giełdach amerykańskich i europejskich
- Bitcoin również jest już drogi
A kapitał płynie od rynków przewartościowanych do niedowartościowanych!
Dodatkowo Arabia Saudyjska, której przychody to w głównej mierze eksport ropy, a PKB od 2023 roku stoi praktycznie w miejscu, wznowiła budowę najwyższego budynku na świecie
Szukamy sygnału z interwału 1T/1M do wejścia w rynek kontraktów terminowych ropy oraz w spółki specjalizujące się w wydobyciu i przetwórstwie ropy.
Trwałe przebicie oporu w okolicach 76$ powinno ustanowić trend wzrostowy.
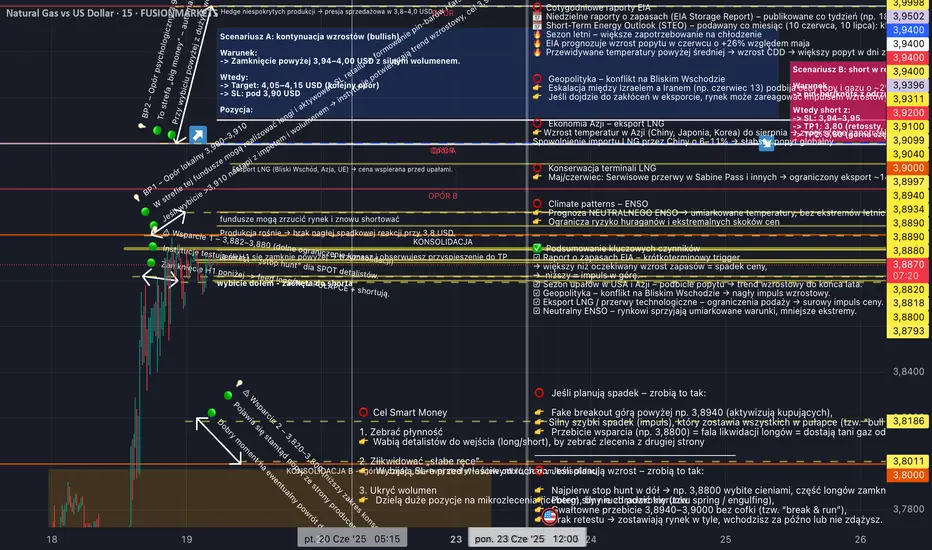
XNGUSD - na co zwrócić uwagę?Przygotowałem pełne zestawienie wszystkich istotnych poziomów wsparcia i oporu, które są rozgrywane przez fundusze, banki oraz systemy automatyczne.
Te poziomy wynikają z danych, reakcji wolumenowej, price action oraz strategii instytucjonalnych.
Ponadto niżej jest dostępna notatka zawierająca m.in. wszystkie najważniejsze harmonogramy i informacje ułatwiające pracę z kalendarzem.
Na początku może to wyglądać jak spaghetti informacyjne, ale jak otworzysz wykres i dostosujesz go do widoku to będzie znacznie bardziej czytelne .
WTI CASH - na co zwrócić uwagę?Przygotowałem pełne zestawienie wszystkich istotnych poziomów wsparcia i oporu, które są rozgrywane przez fundusze, hedgerów (producentów ropy) oraz systemy automatyczne.
Te poziomy wynikają z danych COT, reakcji wolumenowej, price action oraz strategii instytucjonalnych.
Ponadto niżej jest dostępna notatka zawierająca m.in. wszystkie najważniejsze harmonogramy i informacje ułatwiające pracę z kalendarzem.

Ropa: trend spadkowy trwa, ale byki mogą wrócić przy wybiciu 64$Ropa ostatnio nie ma najlepszej passy. Od marca 2022 porusza się w trendzie spadkowym, a licząc właśnie od marca 2022 do maja 2025, cena baryłki ropy spadła o 55% .
Wykres 1. Interwał dzienny
Dodając do tego kombinację średnich EMA60/10 , kurs znajduje się technicznie pod presją oporu w okolicach 63$ , a wyżej — na 68,3$ .
Wykres 2. Interwał dzienny
Kurs znajduje się też w okolicach oporu/wsparcia, które historycznie było dosyć istotne dla obrania właściwego kierunku. Tym poziomem jest 61$ .
Wykres 3. Interwał dzienny
Obecnie cena ropy zbliża się do strefy 63,8–64,5$ . Jeśli uda się wybić właśnie ten poziom, kurs może wrócić w okolice 71$ , gdzie — w mojej ocenie — może dojść do zatrzymania wzrostów.
Wykres 4. Interwał dzienny
Wykres 4. Interwał dzienny (drugie ujęcie)
Poziom 71$ to bowiem miejsce, gdzie od grudnia 2021 do grudnia 2024 kurs wielokrotnie odbijał w górę, ostatecznie wracając do wzrostów. Dopiero przebicie tego poziomu dało impuls do przeceny poniżej 60$ .
Tak więc teraz ten opór ma szansę zostać przetestowany od dołu.
Patrząc na oscylatory, widać szansę na ruch w górę . RSI i RSX są wyraźnie wyprzedane, a MACD powoli zawraca w kierunku sygnału kupna.
Wykres 5. Interwał dzienny
Wsparcie: 58,3 / 55,5$
Opór: 63,8 / 67,3 / 70–71$

#BRENT Wykresy Ropy: Gold/Oil Rati, Stocks/Oil RatioNa wykresie starałem się umieścić trzy instrumenty jednocześnie:
1️⃣ Dolny (biały) wykres: Złoto do Ropy Ratio.
2️⃣ Środkowy (czerwony) wykres: Cena ropy naftowej BRENT.
3️⃣ Górny (niebieski) wykres: DJI/Brent Ratio.
1️⃣ Pierwszą rzeczą, na którą warto zwrócić uwagę, jest biały wykres: Złota do Ropy Ratio, a konkretnie to, gdzie ta relacja znajduje się dzisiaj. W ciągu ostatnich 75 lat obserwacji relacja ta osiągnęła niespotykane wcześniej poziomy. Spread ponownie testuje rekordowe wartości hysterii COVID-19 z 2020 roku, kiedy to panika spowodowała gwałtowny spadek cen ropy. W chwili obecnej ⚖️Relacja Złota do Ropy wynosi około 50, co oznacza, że za jedną uncję złota można kupić aż 50 baryłek ropy. W ciągu ostatniego stulecia, kiedy spread przekraczał 25 baryłek za uncję, interpretowano to jako moment taniej ropy w stosunku do złota. Dzisiaj natomiast, na tle chaosu panującego na świecie, Relacja Złota do Ropy wchodzi w obszar, który można nazwać „STREFĄ MEGA TANIEJ ROPY”, jeśli oceniać ją ponownie w złocie, a nie w zielonyh ciętyh papierkah. Dalej należy oczekiwać co najmniej powrotu do średnich wartości, i tutaj możliwe są trzy scenariusze:
1. Pierwszy Scenariusz. Załóżmy, że dzisiejsza cena ropy na poziomie 60-70 dolarów za baryłkę jest „uczciwa” i to jest jej miejsce. W takim przypadku złoto jest obecnie mocno przewartościowane i nadszedł czas na korektę z 3300 dolarów do zakresu 2500-2800 dolarów.
2. Drugi Scenariusz. Ze złotem wszystko jest w porządku i będzie ono nadal rosło bez korekty. W takim przypadku ropa jest mocno niedowartościowana w stosunku do złota i nadszedł czas, aby zaczęła je doganiać, tak aby spread z 50 powrócił do swoich średnich wartości w zakresie 10-25.
3. Trzeci Scenariusz sugeruje, że zarówno ropa jest znacząco niedowartościowana, jak i złoto zbyt gwałtownie wzrosło, i teraz nadszedł czas na korektę złota i wzrost cen ropy.
W każdym z trzech opisanych powyżej scenariuszy Relacja Złota do Ropy prędzej czy później powróci do swoich normalnych wartości z ostatniego stulecia, czyli do zakresu 10-25 baryłek za uncję złota. I najprawdopodobniej zobaczymy w tym roku trzeci scenariusz rozwoju wydarzeń, gdzie na tle krachu na giełdzie akcji, problemów z płynnością w globalnym systemie finansowym, wejścia zachodnich gospodarek w recesję, a także rozpoczęcia pełnoskalowej wojny na Bliskim Wschodzie tego lata, wszystko to razem spowoduje korektę złota i gwałtowny wzrost cen ropy, a co za tym idzie, powrót relacji złota do ropy do jej historycznych średnich wartości.
2️⃣ Na drugim (czerwonym) liniowym wykresie cen ropy naftowej BRENT wszystko wygląda dość zwyczajnie. Jeśli krótko opisać wykres z ostatnich dwudziestu lat prostymi słowami, warto powiedzieć następne: od 2008 roku wszelkimi sposobami próbuje się utrzymać cenę ropy poniżej 130 dolarów za baryłkę, a jak tylko cena zbliża się do strefy 120-150 dolarów, jakaś „niewidzialna ręka rynku” zrzuca ją w dół. Pierwszy test tej strefy oporu miał miejsce podczas globalnego kryzysu finansowego GFC w 2008 roku, drugi test z przedłużonym handlem bocznym miał miejsce podczas kryzysu zadłużeniowego strefy euro w latach 2011-2014 (kulminacja – niewypłacalność Grecji), a trzeci test miał miejsce w 2022 roku, jako konsekwencja szaleństwa monetarnego z 2020 roku (globalny lockdown, nieograniczone QE, i w rezultacie: fala inflacji monetarnej i strukturalnej na całym świecie). Tak czy inaczej, za czwartym czy piątym razem granica 120-150 dolarów za baryłkę zostanie ostatecznie przebita. A potem u ceny ropy jak u samuraja: „nie ma celu, jest tylko droga”, i ta droga prowadzi w górę, „to the moon”🚀
3️⃣ Teraz pozostaje rozważyć ostatni (niebieski) wykres na górze, ⚖️Relację Indeksu Przemysłowego Dow Jones do Ceny Ropy. Ten wykres należy rozumieć jako długoterminowy wskaźnik trendu zmian cykli na rynkach finansowych. Kiedy on rośnie oznacza to 10- lub nawet 20-letni cykl wzrostu na rynku akcji, i odpowiednio, korekty na rynku surowców. A kiedy spada, to odwrotnie, cykl zmienia się na wzrost na rynku towarów i korektę na ryzykownym rynku akcji, która również trwa jedną lub nawet dwie dekady. Dziś można z pewnością powiedzieć, że od 2020 roku cykliczność się zmieniła i dopiero wchodzimy w dziesięcio- lub nawet dwudziestoletni trend wzrostowy w sektorze surowców, co zapowiada zmianę „wiecznie” rosnącego trendu na amerykańskim rynku akcji na spadek lub przynajmniej na wieloletni ruch boczny a-la lata 1970.
🙏 Dziękuję za uwagę i 🚀 za pomysł.
☘️ Powodzenia, uważajcie na siebie!
📟 Do zobaczenia później.

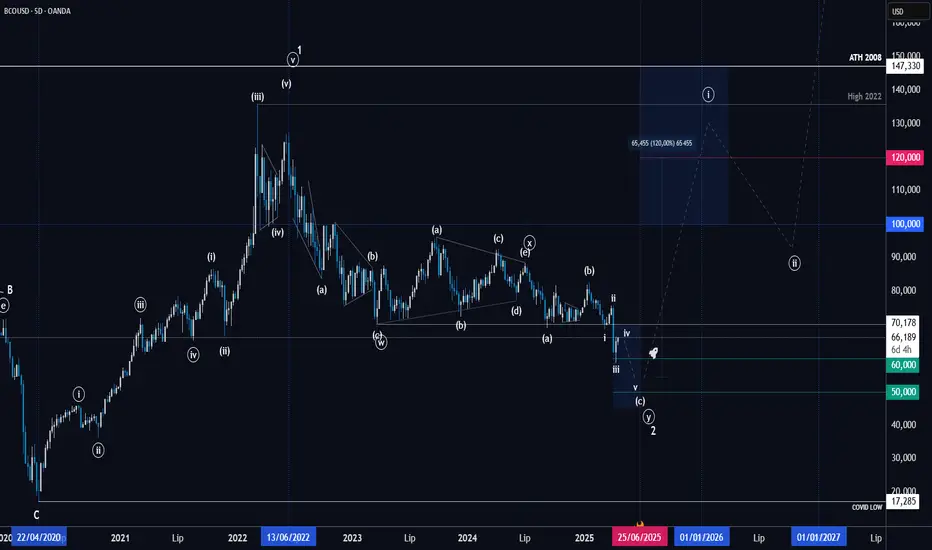
Analiza wykresu BRENT z prognoza na 2025-2026◽️Technicznie wszystkie warunki do zakończenia korekty drugiej fali zostały spełnione i teraz notowania można śmiało odwracać na północ. Jednak obecne wydarzenia w globalnej gospodarce nie dają jeszcze podstaw do pewnego stwierdzenia tego. Lokalnie cena może jeszcze spaść w panice do 50$ za baryłkę, a nawet nieco niżej. Tak czy inaczej, trzeba zrozumieć prostą rzecz: wszystko co poniżej 70$ za baryłkę należy traktować jako okazję do taniego zakupu ropy i wszystkiego, co z nią związane.
◽️Według moich szacunków, prawdopodobnie do końca wiosny jest jeszcze czas na przemyślenie zakupu. Ale dalej, od początku lata, oczekuję gwałtownego wzrostu cen na tle eskalacji na Bliskim Wschodzie. Z góry, w okolicach 100-150$, wzrost prawdopodobnie zostanie na jakiś czas powstrzymany, co będzie interpretowane jako formowanie fal prowadzących (i)-(ii), gdzie po wybiciu w pierwszej podfali z około 50-60$ do 120-130$ nastąpi lokalna korekta w ramach drugiej podfali.
◽️Wzrost może potrwać 3-6 miesięcy, a korekta do niego kolejne 2-4 kwartały, a następnie oczekiwane jest przebicie strefy oporu 120-150$ i dalszy „to the moon” w trzecich falach, co jeszcze zdążymy omówić w przyszłych publikacjach.
🙏 Dziękuję za uwagę i 🚀 za pomysł.
☘️ Powodzenia, uważajcie na siebie!
📟 Do usłyszenia.
Ropa - aktualizacja pomysłu z listopada'24Mamy początek roku, chłodny styczeń i dlatego jako pierwszy pomysł wrzucam dzisiaj aktualizację pomysłu dla ropy (OIL Brent).
Ostatni pomysł właściwie idealnie zrealizował się na wsparciu przy 71,1$ i kurs ropy ruszył w górę.
Wykres 1. Interwał dzienny
Poprzedni pomysł wrzucam na koniec tego.
Aktualnie kurs dotarł do oporu na 38,2% zniesienia Fibonacciego czyli 76$ i wygląda na to, że kolejny przystanek to będzie 50% zniesienia Fibonacciego (78,3$), gdzie będzie też wypadać środek małego kanału wzrostowego.
Wykres 2. Interwał dzienny
Tutaj należy zauważyć, że na MACD mamy od połowy grudnia sygnał kupna i póki co nie widać sygnału zakończenia fazy wzrostowej.
Wykres 3. Interwał dzienny | MACD
Jak zawsze przy surowcach nie mogę ominąć kombinacji średnich EMA 10/60, których przecięcie zwykle sygnalizuje wejście w główną fazę wzrostów lub fazę spadków.
Na początku października, tuż po przecięcia doszło do szybkiego zanegowania tego sygnału i kurs szybko wrócił w okolice 70$.
Dzisiaj ponownie mamy próbę wygenerowania sygnału kupna, gdzie zielona linia właściwie przecina czerwoną, dlatego należałoby poczekać 2-3 dni to potwierdzenia sygnału wzrostowego.
Wykres 4. Interwał dzienny
Jeśli poziom 50% zniesienia Fibonacciego zostanie wybity i dojdzie do pokonania środka kanału wzrostowego to możemy mieć mocny sygnał do wzrostów cen ropy w kierunku 83-85$ przy małej konsolidacji wcześniej w okolicy 78-80$.
Wsparcie: 73,7/71/68,5$
Opór: 76/78,3/80,5$

Co dalej z ropą? - aktualizacja pomysłu z wrześniaOstatni pomysł z września dla ropy dość dobrze się sprawdził z wyznaczonym maksimum, dlatego czas na szybką aktualizację.
Pomysł z września zakładał, że kurs dotrze do poziomu 80,43$, a maksimum był przy 80,9$.
Od tego czasu kurs rozpoczął korektę i całkiem możliwe, że jeszcze chwilę pokręci się w okolicy wsparcia przy 73,0$
Wykres 1. Interwał dzienny
Warto zaznaczyć, że pomimo mocnych z początku września do początku października to jednak nie udało się wygenerować sygnału kupna na kombinacji średnich EMA60/10. Co też wyjaśnia, że brak impulsów do wzrostów zawrócił kurs w dół.
Wykres 2. Interwał dzienny
Warto zaznaczyć, że na cenę ropy w najbliższym czasie może mieć też wpływ zwycięstwo Donalda Trumpa w wyborach na prezydenta USA.
Choćby na taki aspekty jak
Wydobycie i Produkcja Ropy: Trump jest zwolennikiem zwiększenia wydobycia ropy naftowej w USA. Jego hasło "Drill baby drill" sugeruje politykę wspierającą rozwój przemysłu naftowego, co mogłoby zwiększyć podaż ropy na rynku, potencjalnie prowadząc do obniżenia cen.
Polityka Energetyczna: Trump deklarował chęć ograniczenia regulacji środowiskowych, co mogłoby ułatwić eksplorację i wydobycie ropy, szczególnie w miejscach jak Alaska czy Zatoka Meksykańska, gdzie dotychczas były ograniczenia.
Podczas jego poprzedniej kadencji kurs ropy dość mocno wzrósł w pierwszym roku urzędowania.
Później w okresie covidu kurs spadł jednak do historycznych minimów na poziomie 19$ za baryłkę.
Podczas urzędowania zaś Joe Bidena kurs ropy wzrósł go maksimów na poziomie 131$ co było efektem wybuchu wojny w Ukrainie. Później jednak kurs utrzymał się w zakresie 70-90$.
Wykres 3. Interwał dzienny
Tak więc trudno określić jaka będzie przyszłość na podstawie poprzedniej kadencji prezydenta Trumpa ponieważ były wydarzenia niezależne od niego, podobnie jak przy kadencji prezydenta Bidena.
Więc pozostaje technika.
Patrząc na oscyaltory to można założyć, że kurs ropy ma przed sobą jeszcze szanse na spadki.
RSI i MACD wyraźnie zawraca w dół, a zwłaszcza MACD może wrócić na sygnał sprzedaży.
Wykres 4. Interwał dzienny
Natomiast ewentualne spadki możliwe są do poziomu 71$ zakładając, że powoli tworzy się kanał wzrostowy. Wówczas odbicie od dolnej krawędzi potwierdzi, że cena ropy nadal może w średnim terminie rosnąć, a wówczas kolejny szczyt byłby w okolicach 83-83,5$
Wykres 5. Interwał dzienny
Wsparcie: 73/71/68,5$
Opór: 75,85/78,14/80,5$

Ropa - czy nie jest aby trochę już za tania?Ropa nadal znajduje się w kanale spadkowym - dwie próby wybicia z niego górą były nieudane.
Czy teraz zbliżamy się do testu dolnej bandy w okolicach $63,5 ?
Osobiście uważam, że cena jest za niska - tak “geopolitycznie - gospodarczo”
Sytuacja na bliskim wschodzie jest daleka od spokojnej, tarcia USA - Chiny cały czas trwają, wybory w USA i ich konsekwencje są dosyć ryzykowne.
A na dodatek sytuacja gospodarcza świat nie jest taka zła - USA jako największa gospodarka ( Chin nie biorę pod uwagę) ma się całkiem nieźle.
Konkludując - myślę, że najbliższy czas to może być dobra okazja na zakup czarnego złota w średnim terminie.

ROPA Brent - czy tania ropa właśnie się kończy?W ostatnim pomyśle dla Ropy Brent pisałem o formacji RGR, która właściwie się zrealizowała.
Wykres 1. Interwał dzienny | Interwał godzinowy | realizacja pomysłu
Dzisiaj kurs dotarł do minimum na poziomie 70$ a dokładniej 68,5$.
Dlatego zakładam, że czas taniej ropy może się mieć ku końcowi i powoli będzie wracać w okolice 75-80$.
Niedawno kurs odbił w okolicach 68,5$ i jeśli nałożyć zniesienia Fibonacciego od ostatniego szczytu na 87$ do wspomnianego minimum to kurs jest właśnie przy 23,6% zniesienia Fibonacciego.
Wykres 2. Interwał dzienny
Dlatego całkiem możliwe, że jeszcze dojdzie do jednego testu poziomu 68,5-69$ tworząc podwójne dno i kurs ruszy mocniej w górę docierając do 78$ czyli 50% zniesienia Fibonacciego, a ostatecznie na poziom 80,5$ gdzie mielibyśmy okres konsolidacji.
Patrząc na oscylatory to RSI wskazuje szansę na korektę w kierunku podwójnego dna, a MACD będą aktualnie po stronie sygnału kupna może w każdej chwili zawrócić i wygenerować sygnał sprzedaży.
Wykres 3. Interwał dzienny
Patrząc na kombinację EMA10/60 to kurs nadal może zachowywać się negatywnie, ale wybicie już 76-77$ może wygenerować przecięcie średnich i w efekcie wzmocnić wzrosty, dlatego w po okresie wspomnianej konsolidacji w okolicach 80,5$ to w średnim okresie cena ropy ruszy dalej w kierunku ostatniego szczytu czyli 87$ gdzie może zakończyć się cała faza wzrostowa.
Wykres 4. Interwał dzienny
Wsparcie: 73/71/68,5$
Opór: 75,9/78,2/82,5$

ROPA - stan na 16.07.2024Na wykresie godzinowym dla ropy mamy prawdopodobnie formację RGR, która może znieść kurs w okolice 79,7$.
Wykres 1. Interwał godzinowy
Podobną formację na wykresie można było dostrzec w kwietniu tego roku kiedy to po osiągnięciu 91,5$ kurs zszedł na początku czerwca w okolice 76,5$ co oznaczało przetestowanie poziomu z lutego 2024 roku.
Wykres 2. Interwał godzinowy
Jeśli na obecny wykres od wspomnianego dołka do szczytu z początku lipca na 87,7$ naniesiemy zniesienia Fibonacciego to można wyznaczyć strefę wsparcia w okolicach 82,2$
Wykres 3. Interwał godzinowy.
Patrząc na oscylatory to jest jeszcze szansa na przetestowanie w krótkim terminie poziomu 84-84,5$ i przebicie tych poziomów mogłoby zanegować formację RGR.
Wykres 4. Interwał godzinowy | oscylatory
Patrząc w szerszym zakresie w interwale dziennym to kurs od września porusza się w schemacie niższych szczytów i wyższych dołków co pozwala narysować formację trójkąta ze wsparciem w okolicach 77,5$.
Wykres 4. Interwał dzienny
Dodatkowo na oscylatorach mamy znacznie wyraźniejsze sygnały sprzedaży co pozwala zakładać, że w przypadku braku obrony poziomu 77,5-76,5$ dałoby znacznie głębszą korektę.
Zwłaszcza MACD niedawno wygenerował sygnał sprzedaży, który potwierdza zazwyczaj mocniejsze spadki.
Wykres 5. Interwał dzienny | oscylatory
W mojej ocenie dość prawdopodobny scenariusz to retest okolic 71-72$ i dopiero odbicie w górę w okolice 78-82$ gdzie kurs będzie dalej konsolidować.
Wsparcie: 82,9/80/77,5-76,5
Opór: 84,1/85,8/89,8

OII - spokojna konsolidacja przed kolejną falą wzrostowąNie ma tutaj co się rozpisywać. Spółka idzie dość prostym schematem i robi typowe "V" z co raz wyższymi dołkami. Do zgarnięcia w kolejnym wybiciu jest około 50% ale dosyć leniwie to idzie więc uzbroiłbym się w cierpliwość. Nie mniej to sektor ropy i gazu (chociaż zakres działań spółka na na prawdę wszechstronny) dlatego może tym razem pójdzie szybciej.

REI - dobry raport, z sygnałem na opcjach do kupnaGdyby nie odchylenie od normy na opcjach nawet bym spółki nie zauważył. Jednak 50k kupionych opcji CALL daje do zrozumienia, że ktoś widzi kurs powyżej 3$ w ciągu 3 miesięcy. Po sprawdzeniu raportu z ubiegłego tygodnia można jasno stwierdzić, że wygląda to bardzo dobrze więc są powody do wzrostu. Przypominam, że moim zdaniem ropa i gaz zaczynają pomału długą hossę więc mamy tutaj dobrego kandydata na średni/długi termin inwestycyjny. Spółka dołącza więc do grona NYSE:OXY , NASDAQ:HPK i NYSE:CPE które znajdziecie w powiązanych analizach poniżej.

ROPA (OIL_Brent) - realizacja RGR i odreagowanie w góręNa ropie mieliśmy od października najpierw budowę formacji RGR a następnie jej realizację na poziomie 73,3$.
Wykres 1. Interwał dzienny | RGR
Teraz jednak należy przebudować wykres i pierwsza rzecz to wyznaczyć opór znajdujący się na poziomie 77,5$. Przebicie zaś tego poziomu może dać sygnał do pokonania istotnego wsparcia z okresu realizacji RGRa i w efekcie przebicia tego poziomu co skieruje kurs w okolice 83$ za baryłkę.
Warto tutaj zaznaczyć, że kurs dolara aktualnie jest w fazie wyprzedaży co jest spowodowane sygnałem FEDu o możliwym rozpoczęciu obniżania stóp procentowych.
W efekcie poziom 83$ wydaje się dość naturalny jednak tutaj szukałbym kolejnego spadku na 77$ i w ostateczności wejścia w fazę konsolidacji 73-83$ to jednak można będzie stwierdzić dopiero po dotarciu do wspomnianego oporu i z pewnością wrócę do pomysłu na tych poziomach cenowych.
Jednak w mojej ocenie w bardzo długiej perspektywie może się okazać, że kurs ropy zejdzie poniżej 70$ docierając w okolice nawet 65$ czyli ceny z 2021 roku. To jest perspektywa 2 lat i jest to raczej w fazie domyśleń niż faktycznych wyliczeń.
W krótkim okresie czekamy na test 83$ i przy tym poziomie wrócę do aktualizacji pomysłu.
Chciałbym też zwrócić uwagę na średnie EMA10/60, które są aktualnie w fazie sygnału sprzedaży jednak EMA10 powoli zawraca w górę co też może dać sygnał do wzrostów.
Wykres 2. Interwał dzienny
Sytuacja gdzie ropa będzie drożeć może sprzyjać naszym rodzimym firmom paliwowym jak Orlen czy Unimot. Bowiem przy niskim kursie USDPLN będą mieli uzasadnienie do podnoszenia cen przy tańszym imporcie surowca.
Jeśli spojrzymy na kurs ropy w PLN to dzisiaj mamy ceny z 2021 roku
Wykres 3. Interwał dzienny | kurs w PLN
Wsparcie: 75,5/74,2/72,5$
Opór: 77,3/77/80/83$

OPEC + obniży ceny ropy? Czy dobrowolne cięcia OPEC + są wystarczające, aby wesprzeć ceny ropy w przyszłości?
Po ostatnim spotkaniu OPEC+ cena ropy WTI spadła o ponad 2% do 75 USD za baryłkę, kończąc dwudniową passę zwycięstw.
Podczas spotkania OPEC + zgodził się ograniczyć produkcję ropy na początku przyszłego roku o prawie 2 miliony baryłek dziennie (bpd). Decyzja ta została wywołana obawami o zbyt dużą ilość ropy na rynku, co zbiegło się z końcem dobrowolnej redukcji 1 mln bpd w Arabii Saudyjskiej.
Arabia Saudyjska zapowiedziała, że będzie kontynuować cięcie co najmniej do pierwszego kwartału 2024 roku. Rosja przedłużyła również obniżkę do 500 000 bpd w pierwszym kwartale. Irak zgodził się zmniejszyć produkcję o 211 000 bpd, a Zjednoczone Emiraty Arabskie zobowiązały się do ograniczenia 160 000 bpd w pierwszym kwartale.
Jednak OPEC + zaprosił również Brazylię do dołączenia do grupy. Brazylia powiedziała, że planuje dołączyć w styczniu i zwiększyć dzienną produkcję ropy do 3,8 miliona baryłek, przeciwdziałając zobowiązaniom innych członków do obniżenia produkcji i cen wsparcia.

Najlepszy handel tygodnia? USDCAD czy olej? Najlepszy handel tygodnia? USDCAD czy olej?
Czy bessy na dolara kanadyjskiego wzrosną przed Środą? Powszechnie oczekuje się, że kanadyjski bank Centralny zawiesi stopy procentowe podczas spotkania, które kończy się w tym dniu (chociaż może to być Jastrzębie zawieszenie, ponieważ Gubernator Tiff Macklem wspomni, że kolejna podwyżka jest nadal na stole dla banku).
Być może piętrzą się na niedźwiedziach nastroje to niewielki spadek cen ropy (jednego z głównych kanadyjskich eksportu), ponieważ wysiłki dyplomatyczne USA nadal powstrzymują konflikt między Izraelem a Hamasem. Jak długo ten kwiecisty okres może trwać, jest jednak przedmiotem debaty,a ofensywa naziemna IDF w Gazie może spowodować wzrost cen ropy.
Uparty przyjmuje USD / CAD (tj. niedźwiedzie Zakłady na Loonie) będzie miał 1.37350 do zadowolenia, co jest najwyższym poziomem, jaki para osiągnęła przed kraterem do 1.36712 na początek tygodnia. 1.36936 jest bardziej bezpośrednim oporem dla Byka, zanim nawet pomyśli o szczycie dnia. Słabość RSI sugeruje, że nie będzie to jednak zbyt trudne, a 1.37189 może być potężniejszym oporem.

Ropa - RGR na horyzoncieRopa w ostatnich dniach jest pod szczególną uwagą wielu inwestorów grających na tym surowcu.
Od czerwca do września 2023 roku cena ropy wzrosła o 32,5% co nie jest zaskakujące w tym okresie. Dodatkowo rósł popyt na surowiec, a OPEC ograniczyło wydobycie co podbijało cenę.
Wykres 1. Interwał dzienny
Kiedy jednak zaczęły się pojawiać prognozy pokonania 100$ za baryłkę, cena we wrześniu nagle spadła o 12% między 28.09 a 06.12. Dopiero sytuacja geopolityczna w Izraelu spowodowała, że doszło do silnego wzrostu ceny ropy i z dołka na 83$ dość szybko wróciliśmy na 90$.
Wykres 2. Interwał dzienny
Nanosząc na ten spadek zniesienia Fibonacciego (Wykres 2.) to widać, że jednym z oporów jest poziom 61,8% czyli 90,5$.
W mojej ocenie możemy mieć budowanie formacji RGR gdzie potwierdzeniem tego założenia będzie aktualnie korekta z poziomu 90$ i ruch w kierunku linii szyi RGR na poziomie 83-84USD.
Wykres 3. Interwał dzienny
Wówczas możliwy zasięg będzie w okolicach nawet 73$.
Drugim możliwy scenariuszem będzie faktycznie rozegranie pod poziom 100-102$ co potwierdzi się już przy pokonaniu 91,5$ i dalej 95$.
Wykres 4. Interwał dzienny
W mojej ocenie jednak szanse na korektę w kierunku 83$ a w bardzo długim terminie cel na 73$ jest bardziej realny i dla tego pomysłu przyjmę właśnie założenie, że docelowo kurs ropy będzie jednak podążał w dół.
Wsparcie: 89/85/83$
Opór: 90,5/95/102$
Ropa w sytuacji napięć geopolitycznych reaguje bardzo silnie poprzez wahania ceny, dlatego inwestowanie na tym instrumencie z reguły wiąże się z dużym ryzykiem iwnestycyjnym.

Konflikt na Bliskim Wschodzie w górę, ropa w górę, złoto w gó...Konflikt na Bliskim Wschodzie w górę, ropa w górę, złoto w górę, zapasy obronne w górę
Kontrakty terminowe na ropę WTI i Brent wzrosły o ponad 4%, odpowiednio powyżej 86 USD i 88 USD za baryłkę, w poniedziałek, po niespodziewanym ataku Hamasu na Izrael w weekend.
Ponad 900 Izraelczyków straciło życie, a 130 kolejnych było zakładnikami, a prawie 700 Palestyńczyków zginęło w odwecie Izraela. Rozejm jest mało prawdopodobny w krótkim okresie.
Inwestorzy obawiają się również szerszego konfliktu. Złoto podskoczyło w poniedziałek o 1,45% do około 1,850 USD za uncję, dodając do 0,7% zysku metalu wyprodukowanego w piątek (ponieważ raport o zatrudnieniu poza rolnictwem był śmiesznie silniejszy niż oczekiwano).
W niektórych przypadkach inwestorzy nie są ostrożni, ale z zadowoleniem przyjmują szerszy konflikt, a akcje obronne w USA są jednymi z lepszych wyników w poniedziałek. Raytheon (+4.5%), Lockheed Martin (+8.5%) i Northrop Grumman (+11.2%) odnotowują jedne z najlepszych dziennych zysków w pewnym czasie.
Pytanie, które się pojawia i które może wpłynąć na rynki ropy, brzmi: jaki był wkład Iranu w sytuację, jeśli w ogóle? Teheran zaprzeczył zaangażowaniu, ale pochwalił atak. Inwestorzy będą szukać wszelkich wydarzeń, które mogą wpłynąć na dostawy z Iranu (obecnie wysyłają 1,5 miliona baryłek dziennie do Chin) lub przez Iran (przez Cieśninę Ormuz, która jest niezbędna dla około 30% dostaw ropy).
W każdym razie świat może mieć do czynienia z wyższymi cenami ropy.

Ropa rośnie do 2023 r.: wyznacza nowe poziomy wsparcia?Ropa rośnie do 2023 r.: wyznacza nowe poziomy wsparcia?
Kontrakty terminowe na ropę WTI wzrosły w środę o 3.5%, na krótko osiągając poziom powyżej 94 USD, co oznacza najwyższą cenę rozliczeniową w 2023 roku. Ten imponujący Rajd nastąpił po opublikowaniu danych OOŚ wskazujących na większy niż oczekiwano spadek zapasów ropy w USA, pokazując spadek o 2.17 mln baryłek w ubiegłym tygodniu.
Równolegle Kontrakty terminowe na ropę Brent odnotowały znaczny wzrost o 2,8%, osiągając 96,55 USD, a nawet przekraczając próg 97 USD podczas sesji giełdowej.
Nastroje rynkowe są coraz bardziej zaniepokojone zacieśnieniem dostaw, gdy zbliżamy się do zimy na półkuli północnej. Na początku miesiąca główni gracze OPEC+, Arabia Saudyjska i Rosja, przedłużyli cięcia dostaw o 1,3 miliona baryłek do końca roku.
Pojawia się pytanie, czy ropa może spaść poniżej ostatnich minimów 88,00 USD za baryłkę bez decyzji o zwiększeniu produkcji? A jeśli nie widzimy impulsu, aby ropa nadal rosła, jak dobrze uważamy, że ostatnie wyższe Maksima (92,65 USD) i niższe Maksima (91,30 USD) poradzą sobie z potencjalną presją korekcyjną?
