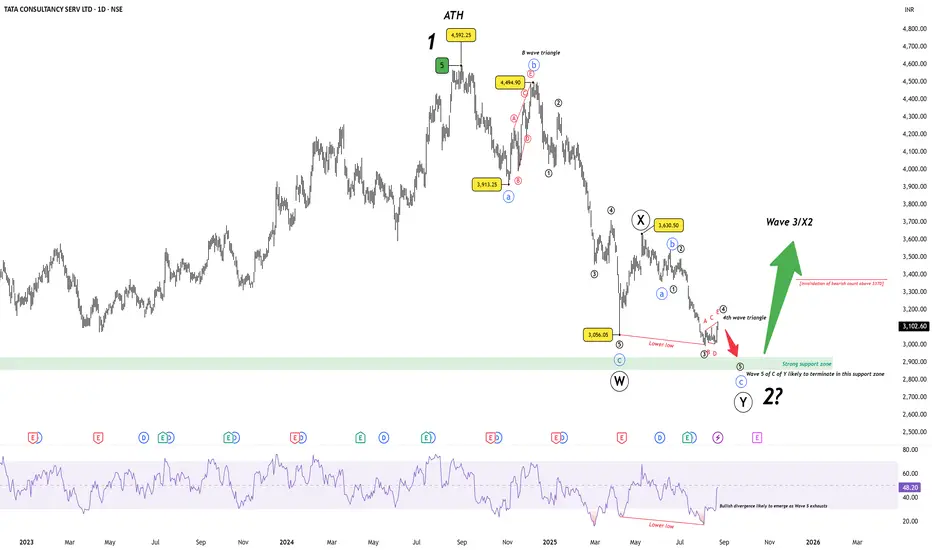
TCS has been in a prolonged corrective phase since the all-time high at ₹4592. The decline has unfolded best as a W–X–Y double zigzag, with the current leg (Wave Y) progressing into its final stages.
The termination zone for Wave 2 is highlighted between ₹2926–₹2850, aligning with the prior Wave 4 support zone. Importantly, bullish divergence is likely to emerge on RSI if price makes a marginal new low.
Key Levels:
Support zone: 2926–2850 (probable Wave 2 low).
Bearish invalidation: A sustained move above 3370 would invalidate the immediate bearish count.
Bigger picture: If this structure holds, it would complete Wave 2 of a higher degree, setting the stage for a powerful Wave 3 rally ahead.
Disclaimer: This analysis is for educational purposes only and does not constitute investment advice. Please do your own research (DYOR) before making any trading decisions.
- Wave W ended at ₹3056 after a sharp A–B–C decline.
- Wave X retraced to ₹3630.
- Wave Y is in progress, and its C leg appears close to exhaustion. A mini 4th-wave triangle has developed, suggesting a final push lower remains.
The termination zone for Wave 2 is highlighted between ₹2926–₹2850, aligning with the prior Wave 4 support zone. Importantly, bullish divergence is likely to emerge on RSI if price makes a marginal new low.
Key Levels:
Support zone: 2926–2850 (probable Wave 2 low).
Bearish invalidation: A sustained move above 3370 would invalidate the immediate bearish count.
Bigger picture: If this structure holds, it would complete Wave 2 of a higher degree, setting the stage for a powerful Wave 3 rally ahead.
Disclaimer: This analysis is for educational purposes only and does not constitute investment advice. Please do your own research (DYOR) before making any trading decisions.
WaveXplorer | Elliott Wave insights
📊 X profile: @veerappa89
📊 X profile: @veerappa89
Wyłączenie odpowiedzialności
Informacje i publikacje nie stanowią i nie powinny być traktowane jako porady finansowe, inwestycyjne, tradingowe ani jakiekolwiek inne rekomendacje dostarczane lub zatwierdzone przez TradingView. Więcej informacji znajduje się w Warunkach użytkowania.