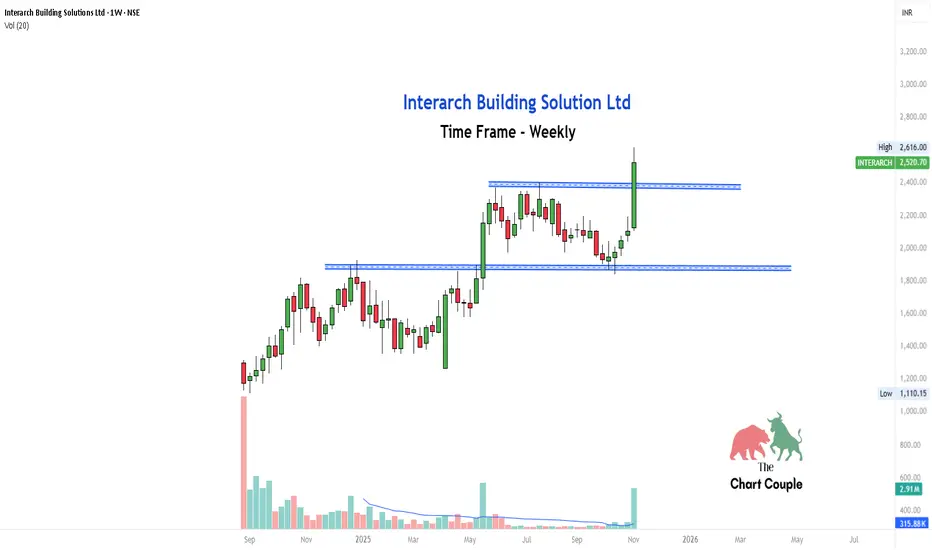
Interarch Building Solution Ltd recently broke above a well-defined resistance zone around ₹2,400 after consolidating for several weeks.
The breakout candle is supported by noticeable volume, which validates the move and makes it a strong case study for breakout learners.
What can we learn here:
Breakouts are more reliable on higher timeframes like weekly charts.
Volume expansion often precedes sustained momentum.
Patience during consolidation phases pays off when structure confirms breakout.
Wyłączenie odpowiedzialności
Informacje i publikacje nie stanowią i nie powinny być traktowane jako porady finansowe, inwestycyjne, tradingowe ani jakiekolwiek inne rekomendacje dostarczane lub zatwierdzone przez TradingView. Więcej informacji znajduje się w Warunkach użytkowania.
Wyłączenie odpowiedzialności
Informacje i publikacje nie stanowią i nie powinny być traktowane jako porady finansowe, inwestycyjne, tradingowe ani jakiekolwiek inne rekomendacje dostarczane lub zatwierdzone przez TradingView. Więcej informacji znajduje się w Warunkach użytkowania.