EUROPE50 trade ideas

Broad market: It's the end of the world... until the WO beginsIn the past few years where the Winter Olympics were held, there was always a local dip to be bought around the day of the opening, to then ended up with a bigger crash a few months later.
The 2022 Games will be opened on 4 Feb, should be fun.
Disclaimer:
Given long enough time, market eventually goes up.

Europe 50 January 2022Based on my analysis: quick correction to 50 EMA and then we might see ATH by end of January

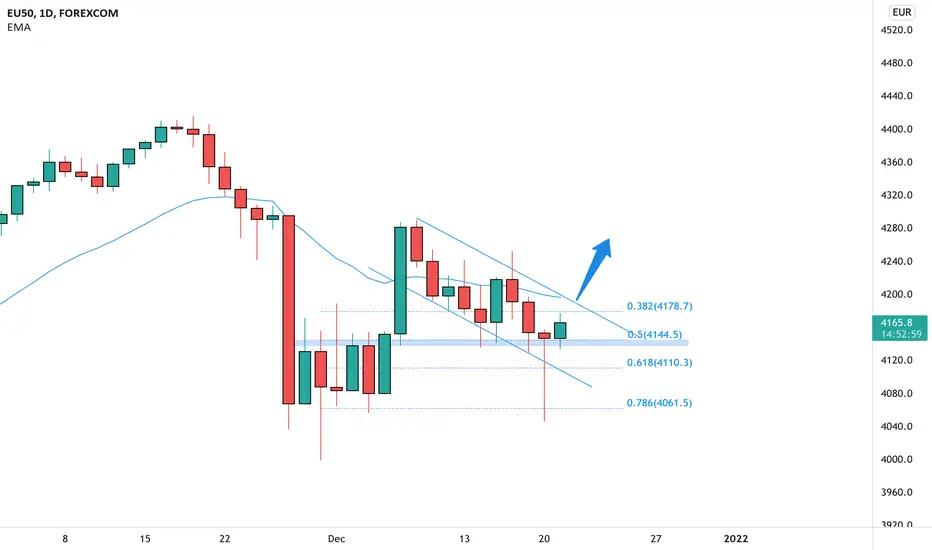
EU50 a turn at the 0.5 Fibonacci 🦐EU50 on the daily chart after the recent impulse retraced in a channel and perfectly retest the previous resistance now turn support at the 0.5 Fibonacci level.
According to Plancton's strategy IF the price will break above and satisfy the ACADEMY conditions we will set a nice long order.
--––
Follow the Shrimp 🦐
Keep in mind.
🟣 Purple structure -> Monthly structure.
🔴 Red structure -> Weekly structure.
🔵 Blue structure -> Daily structure.
🟡 Yellow structure -> 4h structure.
⚫️ Black structure -> <4h structure.
Here is the Plancton0618 technical analysis , please comment below if you have any question.
The ENTRY in the market will be taken only if the condition of the Plancton0618 strategy will trigger.

Europe 50 IndexUsed pivots and geometry here mainly
The only correction i'm calling initially is the retest
All depends on the euro, but i could see europe stonks outperforming us
NOT TRADING ADVICE

EUSTX50 Descending TrianglePrice closed below EMA 10, EMA 20, and Horizontal Support Resistance Level.

EU50 H4 LongReason for buy
D1 is uptrend.
H4 correction is broken by the volume increase.
enter the long trade right now.
Happy trading.

EU 50 TO 3KI'm bearish generally. I have taken the EU index. Selected major pivots- and arrived at a 3k target
This is the action-reaction method of TA
Also known as 'market geometry'
Trade at your own risk, folks
Timeframe 2-3 months

Buckle up.. Massive shorts about to kick in!European Markets and US Stocks made a massive bullrun during "the pandemic".
Pretty strange if you ask me for a scenario where the world was about to stop spinning...
But all over the world, moneyprinting seemed to be the way out.
And that money was given to those who needed the help, good to know
but it also made people lazy, it kept them comfortable.
They where not thinking about going back to work,
so the real economy could pick up its strenght.
And with that money things where bought, also Stocks..
Stocks bought on printed money, money that has no backbone or anything
to back it up, meaningless paper..
I dont need to explain anything further, i hope...
Trade safe and stay healthy!
Arthur

EU50 ShortEU50 led some bearish candlesticks on daily closes last week, despite it closing into a range we’re looking for a rejection off key level before taking trade. When we see that rejection we only expect it to drop to major support level however we could see some prolonged movement. Move SL to entry upon second TP hitting. RSI floating at 63 despite hitting 75.
R:R 1:2:2
GL

EUSTOXX50, sellHow to use TP!
When the order price breaks down Tp1,
you wait for Tp2 and SL moves to Tp1,
so as to secure earnings.
So with Tp2 to Tp3.
When we publish the closing of a position, you close it.
When the order comes to SL, always
consult with us, do not close the order.
Follow your open positions!

EUR50 ELLIOTT WAVE ANALYSISEur50 is showing an incomplete correction of wave 3.so price is showing a potential drop to complete wave b, then price will then continue with its bullish bias. trade with proper risk management.

Euro Stoxx 50 reversal or 'sell the top'EU50 recorded yet another several consecutive days of gains. The price has crossed upper limit of parallel increasing channel with RSI crossing level of 73.
Similar situation occurred in Sep this year whereas RSI remained slightly below 70 yet the index recorded a visible fall to roughly 0.5 level fib retracement.
Current fibo retracement indicate possible fall to 4272 (0.236) and 4213 (0.382) (75 and 134 respectively from 4347 index level of today). With a very narrow SL of 4367 (20 points from 4347) this represents a 3,75:1 reward/risk ratio.
At the same day (Mon 08/11) we see falling Nasdaq100 and SP500 recording small gains with VIX raising over 6% and US yields increasing as well. CURRENCYCOM:EU50

EU50 Bullish on all timeframesEU50/ Eurostoxx50/ SX5E completed its bearish retracement on Monday this week and is now back on its bullish nature. I anticipate it to reach 5000 by the end of October 2021.
I've set my short term goals as follows:
TP1 4235
TP2 4193

EU50| Bearish Continuation Correction + CAB Entry :)We've had a short bias for a bit on all indices, this one is very clean and it looks like we finally broke out of the continuation correction to the downside. Now all we want to see is a LTF correction after the breakout which will be our entry to carry the momentum lower.

EU50 LONG possibilityHello Traders,
Wait for the retest of the counter-trendline and confirmation of the indicators.
Than we have an entry.
Wishing you a great week of trading!

Pomysł na EU 50Tak to widzę. Ciekawy jestem zdania innych.
To nie jest rekomendacja, a gra pod to, co wyrysowałem wiąże się z ryzykiem!

Strong markets in Europe maintain risk-on sentimentMarkets in Asia and especially in Europe started September strongly after higher-than-expected inflation in the eurozone and very optimistic comments from ECB Vice President Luis de Guindos, who said that the eurozone economy is growing faster than the ECB expected, hinting at an upward revision of the central bank's growth forecast. On the downside, German retail sales disappointed in July, falling 5.1% month-on-month. Eurozone manufacturing PMI was lower than expected, but remained near record levels. August, normally a complicated month for the stock market, saw several record closes for the S&P 500 and Nasdaq 100, with US equities pointing to a positive performance on the first day of the new month. The important 10-year US Treasury yield rose well above 1.3% again (currently at 1.32%). The USD remains weak ahead of the US jobs report in focus on Friday. Oil prices remained in a sideways range ahead of today's OPEC+ meeting. Ethereum broke through $3,500, the highest level since May 18. Bitcoin continues to trade in the $47K - $48K range.
Despite rising expectations that central banks will gradually move away from pandemic-era stimulus programs, markets continue to rise, showing that investment banks remain confident that the sustained rise in the stock market will continue. Statements from ECB officials showed that the ECB is optimistic about economic developments in the eurozone, but also that the conditions for a gradual withdrawal of stimulus measures are almost met. Higher 10-year US Treasury yields can be seen as an indicator that US investors also believe that economic growth will continue for longer. September was the worst month for equities in the last two decades, and we also see hedge funds preparing for a reversal. For now, markets remain optimistic, waiting for more clues on the Fed's plans for the coming months. The ECB's optimistic comments have eased growth concerns for now. Risk sentiment remains positive, supporting risk-sensitive currencies such as the AUD, NZD and emerging market currencies. The rise in the EUR is likely to continue as expectations rise that the ECB has started internal talks on scaling back stimulus measures, which the ECB will then report on in detail at the upcoming ECB meeting (on Sep 9).

Breakout in Euro Stoxx 50 with Target of 4320Trend Analysis
The main view of this trade idea is on the 4-Hour Chart. EU Stoxx 50 tested support around the 4080 price level and is currently testing the downward trendline off the 4240 high and the 4210 lower high. Expectations are for a breakout of the downward trendline towards the 4320 price level. This target was derived as there is a symmetrical triangle setup on the 4-hour timeframe. Indicative stop loss is set around the 4065 price level.
Technical Indicators
The Index recently tested support around the 200 fractal moving average and held. This support level is key to the bullish view of the Euro Stoxx 50. The Index currently crossed above the short (25-MA) and medium (75-MA) term fractal moving averages, which around the same zone of the downward trendline. The RSI is also above the 50 price level and there has been a positive crossover on the KST. These indicators complement the bullish view of the Index.
Recommendation
The recommendation will be to go long at market. Stop loss will be set around the 4065 price level and a target of 4320. This produces a risk-reward ratio of 1.41.
Disclaimer
The views expressed are mine and do not represent the views of my employers and business partners. Persons acting on these recommendations are doing so at their own risk. These recommendations are not a solicitation to buy or to sell but are for purely discussion purposes. At the time publishing, I have a position in Euro Stoxx 50 .

EUSTOXX50, sellHow to use TP!
When the order price breaks down Tp1,
you wait for Tp2 and SL moves to Tp1,
so as to secure earnings.
So with Tp2 to Tp3.
When we publish the closing of a position, you close it.
When the order comes to SL, always
consult with us, do not close the order.
Follow your open positions!


Bullish on SX5EEurostoxx is accelerating away, guessing that the helicopter money hit it first. This one has a lot of room to potentially grow. Be careful out there, all this growth in the major indices is purely speculative. Real sector recovery has been choppy and modest.
None of the above is financial advice, please do your own research - your trades are your trades.
