Volume Analysis Pro [KTY]Volume Analysis Pro
Analyze everything about volume with a single indicator.
Buy/Sell split candles, VWMA cloud, oscillator signals, volume divergence —
all essential volume analysis tools in one package.
━━━━━━━━━━━━━━━━━━━━━━━━━━━━━━━
🔑 Key Features
━━━━━━━━━━━━━━━━━━━━━━━━━━━━━━━
▶ Buy/Sell Volume Candles
Splits candle bodies by buy/sell ratio and displays them with color.
Dark area = dominant side / Light area = weaker side
Bull candle with large light area → appears bullish, but selling is dominant
Bear candle with large light area → appears bearish, but buying is dominant
See the true story behind every candle at a glance.
━━━━━━━━━━━━━━━━━━━━━━━━━━━━━━━
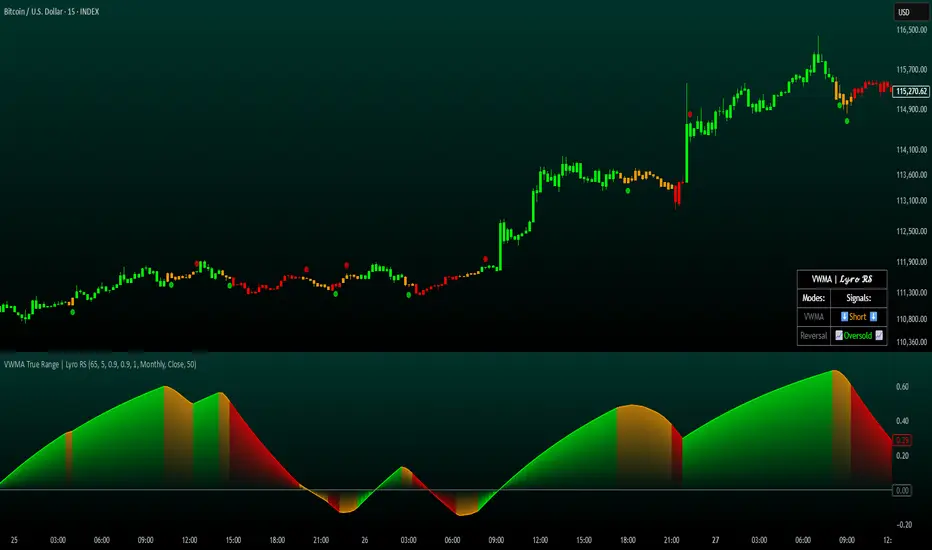
▶ Buy/Sell VWMA Cloud
Visualizes the difference between buy volume-weighted
and sell volume-weighted average prices as a cloud.
Green cloud = buy dominance (bullish)
Red cloud = sell dominance (bearish)
▲▼ triangles = shown on cloud cross + price position confirmation
The moment the cloud flips is a key shift in supply/demand.
━━━━━━━━━━━━━━━━━━━━━━━━━━━━━━━
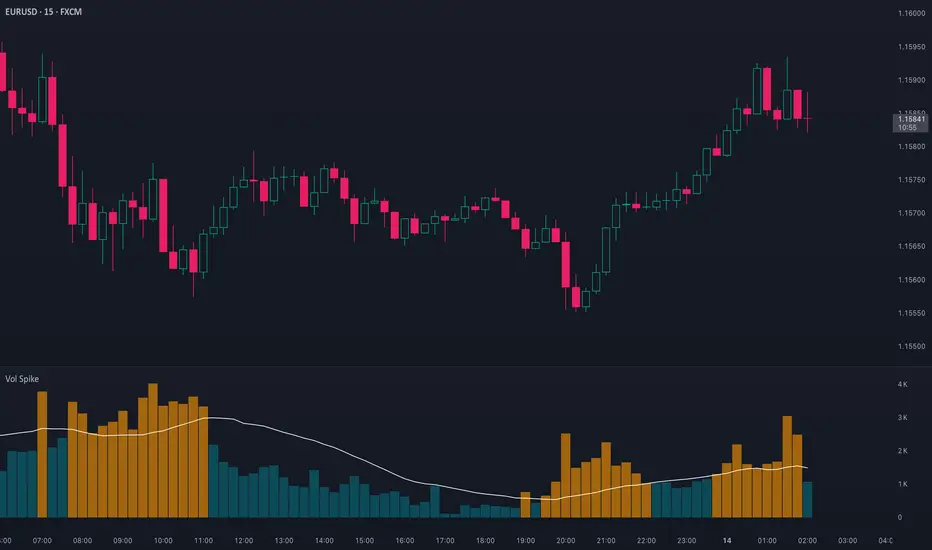
▶ Oscillator Signals
Detects volume flow and anomalies in the bottom panel.
Buy/Sell split columns — visually separates buy and sell volume per bar
Conflict detection (▼▲) — warns when candle direction and volume disagree
Spike detection (■) — marks when volume surges significantly above average
EMA line — tracks volume flow direction with glow effect
━━━━━━━━━━━━━━━━━━━━━━━━━━━━━━━
▶ Volume Divergence
Auto-detects when price and volume flow move in opposite directions.
🔴 D — price rising but volume dropping → uptrend weakening
🟢 D — price falling but volume rising → downtrend weakening
Visualized with connecting lines + D labels on chart
Hidden divergence (trend continuation signal) also supported:
🟢 HD — volume fading on pullback in uptrend → trend likely continues
🔴 HD — volume fading on bounce in downtrend → downtrend likely continues
━━━━━━━━━━━━━━━━━━━━━━━━━━━━━━━
💡 Tips
━━━━━━━━━━━━━━━━━━━━━━━━━━━━━━━
Repeated conflicts (▼▲) → current trend weakening
Divergence (D) + cloud flip together → strong reversal signal
Spike (■) + trend direction match → trend acceleration
All features can be toggled ON/OFF individually → customize to your style
━━━━━━━━━━━━━━━━━━━━━━━━━━━━━━━
🔧 Settings
━━━━━━━━━━━━━━━━━━━━━━━━━━━━━━━
Hover over the ⓘ icon next to each setting for detailed descriptions.
Core parameters are built-in with optimized values —
ready to use with default settings right away.
✅ Chart Overlay — Volume candles, VWMA cloud, cloud cross ON/OFF
✅ Oscillator — Conflict, spike, EMA line ON/OFF + EMA color
✅ Divergence — Regular / Hidden divergence ON/OFF
━━━━━━━━━━━━━━━━━━━━━━━━━━━━━━━
🔔 Alerts
━━━━━━━━━━━━━━━━━━━━━━━━━━━━━━━
Cloud cross (buy/sell shift)
Candle-volume conflict detected
Volume spike detected
Divergence detected (bearish / bullish)
Hidden divergence detected (bearish / bullish)
Setup: ALT + A → Select 【Volume Analysis Pro】📊 → Create alert
━━━━━━━━━━━━━━━━━━━━━━━━━━━━━━━
📌 Note
━━━━━━━━━━━━━━━━━━━━━━━━━━━━━━━
Buy/sell volume is estimated based on the direction
of lower timeframe (1-minute) candles.
This is not order flow data from the bid/ask book.
Focus on relative flow and trend shifts
rather than absolute buy/sell amounts.
━━━━━━━━━━━━━━━━━━━━━━━━━━━━━━━
⚠️ Disclaimer
━━━━━━━━━━━━━━━━━━━━━━━━━━━━━━━
This indicator is an analysis tool, not a trade signal service.
Default settings are a starting point — not optimized for any specific market.
Past reactions do not guarantee future outcomes.
All trading decisions and associated risks are solely your responsibility.
Wskaźnik Pine Script®