Volume Weighted Average Price - 6 band by buckstrdrstandard VWAP improved to allow 6 bands as standard
Wolumen

Pure Wyckoff V50R [Region Based]Pure Wyckoff V50R — Regional Wyckoff Volume-Price Structure Scanner
This script implements a semi-automatic Wyckoff volume–price analysis based purely on regional behaviour, not on single candles. Instead of trying to label every bar, it analyses the last N candles (default ≥ 50) and their volume distribution to estimate whether the market is in an accumulation, distribution or trend phase.
Main features:
🔍 Region-based structure detection
Scans the last regLen bars to find the trading range, then attempts to locate key Wyckoff points such as
SC (Selling Climax), AR, ST, Spring, UT, LPSY, and draws the SC–AR band when a structure is active.
⚖️ Supply–demand balance
Uses regional bullish vs bearish volume to show whether Demand > Supply, Supply > Demand, or Balanced for the current range.
🧠 Phase & decision panel
For the current bar the panel summarises:
overall structure (bullish / bearish / ranging),
approximate Wyckoff phase (e.g. “A phase: SC→AR rally”, “B phase: top distribution zone”, “Bottom testing zone”),
VSA-style bar reading (no supply, effort vs result, SOW, etc.),
current key signal (Spring / UT / LPSY / ST / Trend),
one-line short-term and long-term trading bias.
📊 Scoreboard
Simple scores for structure, volume and trend to give a quick “bullish / bearish / neutral” overview.
Recommended use:
Designed mainly for higher timeframes (Daily / 4H) where Wyckoff structures are clearer.
Parameters (window length, volume averages, multipliers) should be tuned to the instrument and timeframe.
This is a structure helper, not an automatic signal provider – always combine it with your own discretion and risk management.
Disclaimer: This script is for educational and analytical purposes only and does not constitute financial advice. Use at your own risk and feel free to share feedback or improvements.

able zone# able zone
## 📋 Overview
**able zone** is an advanced Support & Resistance zone detection indicator optimized for **15-minute timeframe trading**. It combines Price Action, Volume Profile, and intelligent zone analysis to identify high-probability trading areas with precise entry and exit points.
## 🎯 Core Features
### 1. **Zone Detection Methods**
- **Auto Detect**: Automatically finds the best zones using combined analysis
- **Price Action**: Based on pivot points and price structure
- **Volume Profile**: Identifies High Volume Nodes (HVN) where most trading occurred
- **Combined**: Uses all methods together for comprehensive analysis
### 2. **Zone Types & Colors**
- 🟢 **Support Zones** (Green): Price tends to bounce up from these areas
- 🔴 **Resistance Zones** (Red): Price tends to reverse down from these areas
- 🟣 **HVN Zones** (Purple): High volume areas from Volume Profile
- **Strong Zones**: Darker colors indicate zones with more touches (higher reliability)
### 3. **Zone Strength Indicators**
- **Labels**: "S3" = Support with 3 touches, "R5" = Resistance with 5 touches
- **Touch Count**: More touches = stronger zone
- **Min Touch Count Setting**: Adjust to filter weak zones (default: 3)
## ⚙️ Settings Guide
### **Zone Detection Settings**
- **Detection Method**: Choose your preferred analysis method
- **Lookback Period** (50-500): How many bars to analyze (default: 200)
- For 15min: 200 bars = ~50 hours of data
- Shorter = Recent zones only
- Longer = Historical zones included
- **Min Touch Count** (2-10): Minimum touches to qualify as a zone (default: 3)
- **Zone Thickness %** (0.1-2.0): How thick the zones appear (default: 0.5)
- Based on ATR for dynamic sizing on 15min chart
### **Zone Colors**
Fully customizable colors for:
- Support Zone (default: Green)
- Resistance Zone (default: Red)
- Strong Support/Resistance (darker shades)
- Volume Profile Zone (default: Purple)
### **Zone Touch Detection**
- **Enable Touch Alerts**: Get notifications when price enters zones
- **Touch Distance %** (0.1-1.0): How close to zone counts as "touch" (default: 0.3%)
- On 15min chart, this gives early warning signals
- **Show Touch Markers**: Visual indicators when price touches zones
- 🔺 = Support touch (potential buy)
- 🔻 = Resistance touch (potential sell)
- 💎 = HVN touch (watch for breakout/rejection)
### **Volume Profile Integration**
- **Show VP Zones**: Display high volume node zones
- **VP Resolution** (20-50): Number of price levels analyzed (default: 30)
- **POC Line** (orange): Point of Control - highest volume price level
- **POC Width**: Line thickness (1-3)
- **Show HVN**: Display High Volume Node zones
- **HVN Threshold** (0.5-0.9): Volume % to qualify as HVN (default: 0.7)
### **Display Options**
- **Zone Labels**: Show S/R labels with touch count
- **Zone Border Lines**: Dotted lines at zone boundaries
- **Extend Zones Right**: Project zones into future
- **Max Visible Zones** (5-50): Maximum number of zones displayed (default: 20)
- Adjust based on chart clarity needs
- **Info Table**: Real-time information dashboard
## 📊 Info Table Explained
The info table (top-right corner) provides real-time zone analysis:
### **Row 1: ZONE Header**
- Shows current timeframe (15m)
- Total active zones
- "able" branding
### **Row 2: 🎯 TOUCH Status**
- **RES**: Currently touching resistance (⚠️ potential reversal down)
- **SUP**: Currently touching support (🚀 potential bounce up)
- **HVN**: Currently in high volume area (⚡ watch for direction)
- **FREE**: Not near any zone (⏳ wait for setup)
- Progress bar shows proximity strength
- Arrows indicate zone type
### **Row 3: 🟢 SUP - Support Zones**
- Number of active support zones below current price
- Progress bar shows relative quantity
- More support = stronger floor
### **Row 4: 🔴 RES - Resistance Zones**
- Number of active resistance zones above current price
- Progress bar shows relative quantity
- More resistance = stronger ceiling
### **Row 5: 🟣 HVN - High Volume Nodes**
- Number of HVN zones (from Volume Profile)
- These are areas where most trading activity occurred
- Often act as magnets for price
### **Row 6: 📍 NEAR - Nearest Zone**
- Shows closest zone type (SUP/RES/HVN)
- Distance in % to nearest zone
- Arrow shows if zone is above or below
### **Row 7: POSITION - Price Position**
- **HIGH**: Price near range top (70%+) - watch for resistance
- **MID**: Price in middle range (30-70%) - neutral zone
- **LOW**: Price near range bottom (<30%) - watch for support
- Shows exact position % in lookback range
### **Row 8: ═ SIGNAL ═**
- **🚀 BUY**: Touching support zone (entry opportunity)
- **⚠️ SELL**: Touching resistance zone (exit/short opportunity)
- **⚡ WATCH**: At HVN (prepare for breakout or rejection)
- **⏳ WAIT**: No clear setup (be patient)
## 🎓 Trading Strategy for 15-Minute Timeframe
### **Basic Setup**
1. Set timeframe to **15 minutes**
2. Use **Auto Detect** or **Combined** method
3. Set **Lookback Period**: 200 bars (~50 hours)
4. Set **Min Touch Count**: 3 (proven zones)
### **Entry Signals**
#### **Long Entry (Buy)**
- Price touches green support zone
- Table shows "🚀 BUY" signal
- Look for bullish candle pattern (hammer, engulfing)
- Volume increases on bounce
- **Best Entry**: Bottom of support zone
- **Stop Loss**: Below support zone (1-2 ATR)
- **Target**: Next resistance zone or 2:1 RR
#### **Short Entry (Sell)**
- Price touches red resistance zone
- Table shows "⚠️ SELL" signal
- Look for bearish candle pattern (shooting star, engulfing)
- Volume increases on rejection
- **Best Entry**: Top of resistance zone
- **Stop Loss**: Above resistance zone (1-2 ATR)
- **Target**: Next support zone or 2:1 RR
#### **HVN Breakout Strategy**
- Price approaches purple HVN zone
- Table shows "⚡ WATCH"
- Wait for breakout with strong volume
- **If breaks up**: Go long, target next resistance
- **If breaks down**: Go short, target next support
### **Zone Strength Rules**
- **S5+ or R5+**: Very strong zones (high probability)
- **S3-S4 or R3-R4**: Reliable zones (good setups)
- **S2 or R2**: Weak zones (use caution)
### **Best Trading Times (15min)**
- **London Open**: 08:00-12:00 GMT (high volume)
- **NY Open**: 13:00-17:00 GMT (high volatility)
- **Overlap**: 13:00-16:00 GMT (best setups)
- **Avoid**: Asian session low volatility periods
### **Risk Management**
- Never risk more than 1-2% per trade
- Use stop loss ALWAYS (place outside zones)
- Take partial profits at 1:1, let rest run to 2:1 or 3:1
- If price consolidates in zone > 3 candles, exit
## ⚠️ Important Notes
### **When Zones Work Best**
✅ Clear trending markets
✅ After significant price movements
✅ At session opens (London/NY)
✅ When multiple zones align
✅ Strong zone with 5+ touches
### **When to Be Cautious**
❌ During major news releases (use economic calendar)
❌ Very low volume periods
❌ Price consolidating inside zone
❌ Weak zones with only 2 touches
❌ Conflicting signals from multiple indicators
### **15-Minute Specific Tips**
- **Lookback 200**: Captures 2-3 trading days of zones
- **Touch Distance 0.3%**: Early signals on 15min moves
- **Max Zones 20**: Keeps chart clean but comprehensive
- **Watch POC**: Often acts as pivot on 15min
- **Volume spike + zone touch** = high probability setup
## 🔧 Recommended Settings for 15min
### **Conservative Trader**
- Detection Method: Combined
- Min Touch Count: 4
- Max Zones: 15
- Touch Distance: 0.2%
### **Aggressive Trader**
- Detection Method: Auto Detect
- Min Touch Count: 2
- Max Zones: 25
- Touch Distance: 0.5%
### **Volume Profile Focused**
- Detection Method: Volume Profile
- Show HVN: Yes
- HVN Threshold: 0.6
- Show POC: Yes
## 📈 Example Trade Scenario (15min)
**Setup**: BTC/USD on 15-minute chart
1. Price approaching green support zone at $42,000
2. Zone label shows "S4" (touched 4 times)
3. Table shows "🚀 BUY" signal
4. Volume increasing on approach
5. Bullish hammer candle forms
**Entry**: $42,050 (bottom of zone)
**Stop Loss**: $41,900 (below zone)
**Target 1**: $42,350 (2:1 RR)
**Target 2**: Next resistance at $42,650
**Result**: Price bounces, hits Target 1 in 3 candles (~45min)
## 💡 Pro Tips
1. **Combine with trend**: Trade in direction of higher timeframe trend
2. **Multiple touches**: Zones with 5+ touches are highest probability
3. **Volume confirmation**: Always check volume on zone touch
4. **POC magnet**: Price often returns to POC line
5. **False breakouts**: If price barely breaks zone and returns = strong signal
6. **Zone-to-zone**: Trade from support to resistance, resistance to support
7. **Time of day**: Best setups occur during peak volume hours
8. **Chart timeframe**: Use 1H to confirm trend, 15min for entry
9. **News avoidance**: Close trades before high-impact news
10. **Zone clusters**: Multiple zones together = strong area
---
**Created by able** | Optimized for 15-minute trading
**Version**: 1.0 | Compatible with TradingView Pine Script v5
For support and updates, enable alerts and monitor the info table in real-time!

Cumulative Volume Delta CandlesCVD Trend Candles
Visualize buying and selling pressure directly on your price candles. This indicator colors your candlesticks based on Cumulative Volume Delta (CVD), helping you see the underlying order flow driving price action.
WHAT IS CVD?
Cumulative Volume Delta estimates the difference between aggressive buying and selling volume on each bar. Positive delta indicates more aggressive buying; negative delta indicates more aggressive selling.
COLOR METHODS
▸ CVD Raw
The simplest view—candles are colored based purely on the raw delta of each bar.
• Cyan = Positive delta (net buying)
• Red = Negative delta (net selling)
▸ Rule-Based (Default)
Uses Heikin Ashi-smoothed CVD candles with intensity based on trend strength:
• Bright colors = Strong conviction (larger body + continuation)
• Medium colors = Moderate conviction (continuation)
• Dark colors = Weak/indecision (inside candles, hesitation)
▸ Size-Based
Colors intensity based on z-score of delta changes:
• Bright colors = Statistically significant delta (above strong threshold)
• Medium colors = Moderate delta (above moderate threshold)
• Dark colors = Normal/quiet delta
KEY FEATURES
◆ Kalman Filter Smoothing
Adaptive filtering reduces noise while staying responsive to genuine shifts in order flow. Adjust sensitivity with the Responsiveness and Kalman Gain settings.
◆ Inside Candle Rule
When enabled, prevents false signals from inside candles that show a direction change but lack conviction. The candle retains the previous trend's color (dimmed) instead of flipping.
◆ Session Anchoring
Optionally reset cumulative delta at a specific time (e.g., market open) for intraday analysis.
◆ Z-Score Thresholds
Fine-tune what constitutes "strong" vs "moderate" delta activity for Size-Based coloring.
HOW TO USE
1. Add the indicator to your chart
2. Set your chart type to "Line" or bring the indicator to front via Visual Order → Bring to Front
3. Select your preferred Color Method
4. Look for:
• Sequences of bright cyan candles → Strong buying pressure / bullish momentum
• Sequences of bright red candles → Strong selling pressure / bearish momentum
• Fading colors → Weakening conviction, potential reversal or consolidation
• Color flips → Shift in order flow dominance
Notes
• This indicator estimates delta from OHLCV data. For true order flow analysis, consider using tick or trade data from your broker/exchange.
• Works on all timeframes and instruments with volume data.
• Best used in conjunction with support/resistance levels, market structure, or other confluence factors.

The Map - RMAConcept This indicator is designed to be the ultimate "Map" for intraday traders. Instead of guessing where support and resistance are, it automatically projects Higher Timeframe (HTF) Market Structure onto your chart and combines it with Institutional Volume Analysis. It answers two critical questions instantly: "Where are we?" (Premium vs. Discount) and "Who is trading?" (Whales vs. Retail).
Key Features
Dynamic Market Structure (The Map):
Automatically fetches the Highest High and Lowest Low from a higher timeframe (Default: 4-Hour) over a user-defined lookback period.
Premium Zone (Red): The upper 50% of the range. Ideally used for looking for Short/Sell setups.
Discount Zone (Green): The lower 50% of the range. Ideally used for looking for Long/Buy setups.
Equilibrium (Gray): The 50% midpoint. A key target for mean reversion strategies.
Whale Volume Detection (The Fuel):
Identifies "Whale Candles" where the current volume significantly exceeds the average (e.g., 2x the 20-period average).
Plots visual Bubbles (Green for Up-close, Red for Down-close) to highlight where big money is entering the market.
Filters out noise by only showing bubbles on candles with significant price movement.
Live Dashboard:
A clean table in the top-right corner displays the current Zone status (Premium vs. Discount) and Volume status in real-time.
How to Use
Trend Following: If price breaks out of the H4 High with a Green Whale Bubble, it indicates strong bullish momentum.
Reversal Trading: If price enters the Red (Premium) Zone and prints a Red Whale Bubble (rejection), it suggests institutional selling pressure at resistance.
Confluence: This tool is best used as a "Context Filter" alongside your favorite entry trigger (like a London Breakout or MACD crossover).
Settings
Structure Timeframe: Choose the HTF for your map (Default: 240/4-Hour).
Lookback: How many bars to scan for Highs/Lows (Default: 20).
Whale Multiplier: How much larger than average volume must be to trigger a bubble (Default: 2.0x).
Visuals: Toggle the Zones map on/off to fix chart scaling if needed.
Disclaimer This indicator is for educational and analytical purposes only. Past performance (structure levels) does not guarantee future price action. Always manage your risk.

Liquidity Structure & Sweeps [Visualized]Liquidity Structure & Sweeps | 流动性结构与猎杀
1. Design Philosophy & Logic
This indicator is designed based on Smart Money Concepts (SMC) and Market Microstructure principles. Unlike traditional indicators that rely on lagging averages or repainting fractals, this script focuses on "Objective Structure" and "Liquidity Grabs".
The core design philosophy rests on three pillars:
Zero Repainting (Real-time Integrity): We utilize a strict "Left-Side Confirmation" algorithm. A structure level is only stored in memory when the candle is fully closed (barstate.isconfirmed). This ensures that the historical signals you see are exactly what happened in real-time.
Institutional Memory (Visualized): Markets "remember" key levels. This script draws dashed lines extending from valid pivot points. These lines represent "resting liquidity" (Stop Orders). They remain on the chart until the price interacts with them.
Sweep vs. Breakout: Not all breaches are equal. We specifically look for "Sweeps" (Liquidity Grabs) — where price pierces a level but closes back inside. This is a classic sign of absorption and potential reversal, distinct from a structural breakout.
2. Key Features
Visualized Order Blocks: Automatically draws potential support (Green Dotted) and resistance (Red Dotted) lines based on fractal points.
Wick Detection: Filters out strong momentum breakouts. Signals are only generated when a specific "Wick Ratio" is met, indicating a rejection.
Clean Charts: Features a "Garbage Collection" mechanism. Once a level is swept, the line is removed, and a signal dot is placed. Old, untouched levels are automatically cycled out to prevent chart clutter.
3. How to Use
The Lines (Context):
Red Dotted Line: Buy-side Liquidity (Resistance). Expect potential shorts or breakouts here.
Green Dotted Line: Sell-side Liquidity (Support). Expect potential longs or breakdowns here.
The Signals (Action):
Red Dot (Bearish Sweep): Price spiked above a Resistance Line but closed below it. This suggests long stops were hunted, and bears are stepping in.
Green Dot (Bullish Sweep): Price spiked below a Support Line but closed above it. This suggests short stops were hunted, and bulls are stepping in.
Configuration:
Structure Length: Adjusts sensitivity. Higher values (e.g., 20-50) find major swing points; lower values (e.g., 5-10) find scalping setups.
Wick Filter %: The minimum size of the wick relative to the breakout. Increase this to filter for only the most dramatic rejections.
4. Developer Notes & Considerations
Why do lines disappear? In this logic, liquidity is treated as "Fuel". Once a level is swept (the stop orders are triggered), the fuel is consumed. Keeping the line would clutter the chart with invalid data.
Why is the dot small? The indicator is designed to be part of a toolchain, not a standalone signal. The minimalist design prevents visual interference with price action or other indicators.
1. 设计思路与核心逻辑
本指标基于 聪明钱概念 (SMC) 与 市场微观结构 原理设计。不同于依赖滞后均线或存在重绘问题的传统分形指标,本脚本专注于捕捉 “客观结构” 与 “流动性猎杀 (Liquidity Grabs)”。
核心设计哲学包含三大支柱:
零重绘 (Zero Repainting): 我们采用了严格的“左侧确认”算法。所有的结构位仅在K线完全收盘 (barstate.isconfirmed) 后才会被记录。这保证了您回测看到的信号与实盘完全一致,杜绝“未来函数”陷阱。
可视化的机构记忆: 市场是有记忆的。本脚本会从有效的波段高低点引出虚线。这些虚线代表了“沉睡的流动性”(止损盘聚集区)。它们会一直延伸,直到价格触碰它们。
区分“猎杀”与“突破”: 并不是所有的破位都是一样的。我们专注于识别“扫损(Sweep)”——即价格刺破了关键位,但收盘价收回了关键位内部。这是典型的吸筹或派发信号,与趋势延续的真突破有本质区别。
2. 主要功能
结构可视化: 自动基于分形点绘制潜在的支撑线(绿色虚线)和阻力线(红色虚线)。
插针检测: 过滤掉强势的实体突破。只有当价格出现明显的“长影线”拒绝行为时,才会触发信号。
图表自清洁: 内置“垃圾回收”机制。一旦某个关键位的流动性被猎杀(触发信号),该线条会被自动删除。过旧且未被触碰的线条也会被自动替换,保持图表整洁。
3. 使用指南
线条 (市场语境):
红色虚线: 买方流动性池(阻力位)。
绿色虚线: 卖方流动性池(支撑位)。
信号点 (交易动作):
红色圆点 (看跌猎杀): 价格刺破了红色阻力线,但收盘价回落到线下方。这暗示多头止损被触发,主力可能正在建立空单。
绿色圆点 (看涨猎杀): 价格刺破了绿色支撑线,但收盘价反弹到线上方。这暗示空头止损被触发,主力可能正在建立多单。
参数设置建议:
Structure Length (结构周期): 调整灵敏度。数值越大(如 20-50)锁定大级别波段;数值越小(如 5-10)适合短线剥头皮。
Wick Filter % (影线过滤): 设置影线占价格波动的最小比例。调大该数值可以只看最剧烈的反转信号。
4. 开发者注记与潜在考量
为什么线条会消失? 在本逻辑中,流动性被视为“燃料”。一旦发生猎杀(止损单成交),该位置的燃料即被消耗。移除线条是为了防止无效数据干扰判断。
为什么圆点设计得很小? 该指标旨在成为您交易工具链的一部分,而非唯一的决策依据。极简设计是为了避免干扰裸K形态或其他指标的观察。
===============================================================
这个脚本(我们称之为 Liq Structure Script)本质上是一个基于价格行为(Price Action)的结构猎杀探测器。
以下是详细的深度对比分析:
1. 如何使用? (实战操作手册)
不要把它当作“红灯停绿灯行”的傻瓜指标。把它当作一个**“战场地图”**。
第一阶段:观察结构 (The Setup)
图表上会自动画出 红色虚线(上方压力)和 绿色虚线(下方支撑)。
解读:告诉自己,“这里埋着很多人的止损单”。不要在这里盲目追涨杀跌。
第二阶段:等待猎杀 (The Trigger)
耐心等待价格冲向这些虚线。
关键动作:价格刺破虚线,然后迅速收回。
信号确认:虚线消失,留下一个 红点(顶部猎杀)或 绿点(底部猎杀)。
第三阶段:进场逻辑 (The Execution)
做空逻辑:出现红点 + K线留长上影线 → 说明多头试图突破失败,被主力“倒了一盆冷水”。此时可尝试做空,止损设在刚刚那个最高点上方一点点。
做多逻辑:出现绿点 + K线留长下影线 → 说明空头试图砸盘失败,被主力接住了。
传统爆量是“燃料”,Liq 脚本是“引爆点”。没有引爆点的爆量可能是空转;没有爆量的引爆点可能是假摔。Liq 脚本是一个免费、轻量级、基于K线逻辑的替代品。它不需要你买昂贵的数据服务,它利用的是“图表形态学”中的流动性共识。
结论:如何定位这个工具?
这个脚本不是“预测未来的水晶球”,而是一个**“高胜率区域提示器”**。
用它来找位置(哪里有陷阱?)。
用成交量来做确认(是不是真的有主力介入?)。
用宏观逻辑来定方向(现在该做多还是做空?)。
它是你交易工具链中负责**“微观入场时机(Timing)”**的那一环。

Volume Gaps & Imbalances (Zeiierman)█ Overview
Volume Gaps & Imbalances (Zeiierman) is an advanced market-structure and order-flow visualizer that maps where the market traded, where it did not, and how buyer-vs-seller pressure accumulated across the entire price range.
The core of the indicator is a price-by-price volume profile built from Bullish and Bearish volume assignments. The script highlights:
True zero-volume voids (regions of no traded volume)
Bull/Bear imbalance rows (horizontal volume slices)
A multi-section Delta Panel, showing aggregated Buy–Sell pressure per vertical sector
A clean separation between profile structure, volume efficiency, and delta flows
Together, these components reveal market inefficiencies, displacement zones, and fair-value regions that price tends to revisit — making it an exceptional tool for structural trading, order-flow analysis, and contextual confluence.
Highlights
Identifies true volume voids (untraded price regions), more precisely than standard FVG tools
Plots Bull vs Bear volume at each price row for fine-grained imbalance reading
Includes a sector-based Delta Grid that aggregates Buy–Sell dominance
█ How It Works
⚪ Profile Construction
The indicator scans a user-defined Lookback window and divides the full high–low range into Rows. Each bar's volume is allocated into the correct price bucket:
Bullish volume when close > open
Bearish volume when close <= open
This produces three values per price level:
Bull Volume
Bear Volume
Total Volume & Imbalance Profile
Rows where no volume at all occurred are marked as volume gaps — signaling true untraded zones, often produced by impulsive imbalanced moves.
⚪ Zero-Volume Gaps (True Voids)
Unlike candle-based Fair Value Gaps (FVGs), volume gaps identify the deeper, structural inefficiency: Price moved so fast through a region that no trades occurred at those prices. These areas often attract revisits because liquidity never exchanged hands there.
⚪ Bull/Bear Volume Imbalance
Every price row is drawn using two colored horizontal segments:
Bull segment proportional to bullish volume
Bear segment proportional to bearish volume
This reveals where buyers or sellers dominated individual price levels.
⚪ Delta Panel
The full volume profile is cut into Summary Sections. For each block, the script computes: Δ = (Bull Volume − Bear Volume) ÷ Total Volume × 100%
█ How to Use
⚪ Spot True Voids & Inefficiencies
Zero-volume zones highlight where the price moved without trading. These areas often behave like:
Refill zones during retracements
Targets during displacement
Thin regions price slices through quickly
Ideal for both SMC-style trading and structural mapping.
⚪ Identify Bull/Bear Control at Each Price Level
Broad bullish segments show zones of buyer absorption, while wide bearish slices reveal seller control.
This helps you interpret:
Where buyers supported the price
Where sellers defended a level
Which price levels matter for continuation or reversal
⚪ Use Delta Sectors for Contextual Direction
The delta panel shows where market pressure is accumulating, revealing whether the profile is dominated by:
Bullish flow (positive delta)
Bearish flow (negative delta)
Neutral flow (balanced or minimal delta)
█ Settings
Lookback – Number of bars scanned to build the profile.
Rows – Vertical resolution of price bins.
Source – Price source used to assign volume into rows.
Summary Sections – Number of vertical delta sectors.
Summary Width – Horizontal size of the delta bar panel.
Gap From Profile – Distance between profile and delta grid.
Show Delta Text – Toggle Δ% labels.
-----------------
Disclaimer
The content provided in my scripts, indicators, ideas, algorithms, and systems is for educational and informational purposes only. It does not constitute financial advice, investment recommendations, or a solicitation to buy or sell any financial instruments. I will not accept liability for any loss or damage, including without limitation any loss of profit, which may arise directly or indirectly from the use of or reliance on such information.
All investments involve risk, and the past performance of a security, industry, sector, market, financial product, trading strategy, backtest, or individual's trading does not guarantee future results or returns. Investors are fully responsible for any investment decisions they make. Such decisions should be based solely on an evaluation of their financial circumstances, investment objectives, risk tolerance, and liquidity needs.

Float Rotation TrackerFloat Rotation Tracker - Quick Reference Guide
What is Float Rotation?
Float Rotation = Cumulative Daily Volume ÷ Float
Example:
Float = 5,000,000 shares
Day Volume = 7,500,000 shares
Rotation = 7.5M ÷ 5M = 1.5x (150%)
When rotation hits 1x (100%), every available share has theoretically changed hands at least once during the trading day.
Why It Matters
RotationMeaningImplication0.5x50% of float tradedInterest building1.0x 🔥Full rotationExtreme interest confirmed2.0x 🔥🔥Double rotationVery high volatility3.0x 🔥🔥🔥Triple rotationRare - maximum volatility
Key insight: High rotation on a low-float stock = explosive potential
Float Classification
Float SizeClassificationRotation Impact≤ 2M🔥 MICROExtremely volatile, fast rotation≤ 5M🔥 VERY LOWExcellent momentum potential≤ 10MLOWGood for rotation plays> 10MNORMALNeeds massive volume to rotate
Rule of thumb: Focus on stocks with float under 10M for meaningful rotation signals.
Reading the Indicator
Rotation Line (Yellow)
Shows current rotation level
Rises throughout the day as volume accumulates
Crosses horizontal level lines at milestones
Level Lines
LineColorMeaning0.5Gray dotted50% rotation1.0Orange solidFull rotation2.0Red solidDouble rotation3.0Fuchsia solidTriple rotation
Volume Bars (Bottom)
ColorMeaningGrayBelow average volumeBlueNormal volume (1-2x avg)GreenHigh volume (2-5x avg)LimeExtreme volume (5x+ avg)
Milestone Markers
Circles appear when rotation crosses key levels
Labels show "50%", "1x", "2x", "3x🔥"
Background Color
Changes as rotation increases
Darker = higher rotation level
Info Table Explained
FieldDescriptionFloatShare count + classification (MICRO/LOW/NORMAL)SourceAuto ✓ = TradingView data / Manual = user enteredRotationCurrent rotation with emoji indicatorRotation %Same as rotation × 100Day VolumeCumulative volume todayTo XxVolume needed to reach next milestoneBar RVolCurrent bar's relative volumeMilestonesWhich levels have been hit todayPer RotationShares equal to one full rotationEst. TimeBars until next milestone (at current pace)
Trading with Float Rotation
Entry Signals
Early Entry (Higher Risk, Higher Reward)
Rotation approaching 0.5x
Strong price action (bull flag, breakout)
Rising relative volume bars
Confirmation Entry (Lower Risk)
Rotation at or above 1x
Price holding above VWAP
Continuous green/lime volume bars
Late Entry (Highest Risk)
Rotation above 2x
Only enter on clear pullback pattern
Tight stop required
Exit Signals
Warning Signs:
Rotation very high (2x+) with declining volume bars
Reversal candle after milestone
Price breaking below key support
Volume bars turning gray/blue after being green/lime
Take Profits:
Partial profit at each rotation milestone
Trail stop as rotation increases
Full exit on reversal pattern after 2x+ rotation
Best Setups
Ideal Float Rotation Play
✓ Float under 10M (preferably under 5M)
✓ Stock up 5%+ on the day
✓ News catalyst driving interest
✓ Rotation approaching or exceeding 1x
✓ Price above VWAP
✓ Volume bars green or lime
✓ Clear chart pattern (bull flag, flat top)
Red Flags to Avoid
✗ Float over 50M (hard to rotate meaningfully)
✗ Rotation high but price declining
✗ Volume bars turning gray after spike
✗ No clear catalyst
✗ Price below VWAP with high rotation
✗ Late in day (3pm+) after 2x rotation
Float Data Sources
If auto-detect doesn't work, get float from:
SourceHow to FindFinvizfinviz.com → ticker → "Shs Float"Yahoo FinanceFinance.yahoo.com → Statistics → "Float"MarketWatchMarketwatch.com → ticker → ProfileYour BrokerUsually in stock details/fundamentals
Note: Float can change due to offerings, buybacks, lockup expirations. Check recent data.
Settings Guide
Conservative Settings
Alert Level 1: 0.75 (75%)
Alert Level 2: 1.0 (100%)
Alert Level 3: 2.0 (200%)
Alert Level 4: 3.0 (300%)
High Vol Multiplier: 2.0
Extreme Vol Multiplier: 5.0
Aggressive Settings
Alert Level 1: 0.3 (30%)
Alert Level 2: 0.5 (50%)
Alert Level 3: 1.0 (100%)
Alert Level 4: 2.0 (200%)
High Vol Multiplier: 1.5
Extreme Vol Multiplier: 3.0
Alert Setup
Recommended Alerts
100% Rotation (1x) - Primary signal
Most important milestone
Confirms extreme interest
High Rotation + Extreme Volume
Combined condition
Very high probability signal
How to Set
Right-click chart → Add Alert
Condition: Float Rotation Tracker
Select desired milestone
Set notification (popup/email/phone)
Set expiration
Common Questions
Q: Why is my float showing "Manual (no data)"?
A: TradingView doesn't have float data for this stock. Enter the float manually in settings after looking it up on Finviz or Yahoo Finance.
Q: The rotation seems too high/low - is the float wrong?
A: Possibly. Cross-check float on Finviz. Recent offerings or share structure changes may not be reflected in TradingView's data.
Q: What if float rotates early in the day?
A: Early 1x rotation (within first hour) is very bullish - indicates massive interest. Watch for continuation patterns.
Q: High rotation but price is dropping?
A: This is distribution - large holders are selling into demand. High rotation doesn't guarantee price direction, just volatility.
Q: Can I use this for swing trading?
A: The indicator resets daily, so it's designed for intraday use. You could note multi-day rotation patterns manually.
Quick Decision Matrix
RotationPrice ActionVolumeDecision<0.5xStrong upHighWatch, early stage0.5-1xConsolidatingSteadyPrepare entry1x+Breaking outIncreasingEntry on pattern1x+DroppingHighAvoid - distribution2x+Strong upExtremePartial profit, trail stop2x+Reversal candleDecliningExit or avoid
Workflow Integration
MORNING ROUTINE:
1. Scan for gappers (5%+, high volume)
2. Check float on each candidate
3. Apply Float Rotation Tracker
4. Prioritize lowest float with building rotation
DURING SESSION:
5. Watch rotation levels on active trades
6. Enter on patterns when rotation confirms (0.5-1x)
7. Scale out as rotation increases
8. Exit or trail after 2x rotation
END OF DAY:
9. Note which stocks hit 2x+ rotation
10. Review rotation vs price action
11. Learn patterns for future trades
Combining with Other Indicators
IndicatorHow to Use Together5 PillarsScreen for low-float stocks firstGap & GoCheck rotation on gappersBull FlagEnter bull flags with 1x+ rotationVWAPOnly trade rotation plays above VWAPRSIWatch for divergence at high rotation
Key Takeaways
Float size matters - Lower float = faster rotation = more volatility
1x is the key level - Full rotation confirms extreme interest
Volume quality matters - Green/lime bars better than gray
Combine with price action - Rotation confirms, patterns trigger
Know when you're late - 2x+ rotation is late stage
Check your float data - Wrong float = wrong rotation calculation
Happy Trading! 🔥

Orderbook Table1. Indicator Name
Orderbook Table
This is an order book style trading volume map
that upgraded the price from my first script to label
2. One-line Introduction
A visual heatmap-style orderbook simulator that displays volume and delta clustering across price levels.
3. Overall Description
Orderbook Table is a powerful visual tool designed to replicate an on-chart approximation of a traditional order book.
It scans historical candles within a specified lookback window and accumulates traded volume into price "bins" or levels.
Each level is color-coded based on total volume and directional bias (delta), offering a layered view of where market interest was concentrated.
The indicator approximates order flow by analyzing each candle's directional volume, separating bullish and bearish volume.
With adjustable parameters such as level depth, price bin density, delta sensitivity, and opacity, it provides a highly customizable visualization.
Displayed directly on the chart, each level shows the volume at that price zone, along with a price label, offset to the right of the current bar.
Traders can use this tool to detect high liquidity zones, support/resistance clusters, and volume imbalances that may precede future price movements.
4. Key Benefits (Title + Description)
✅ On-Chart Volume Heatmap
Shows volume distribution across price levels in real-time directly on the price chart, creating a live “orderbook” view.
✅ Delta-Based Bias Coloring
Color changes based on net buying/selling pressure (delta), making aggressive demand/supply zones easy to spot.
✅ High Customizability
Users can adjust lookback bars, price bins, opacity levels, and delta usage to fit any market condition or asset class.
✅ Lightweight Simulation
Approximates orderbook depth using candle data without needing L2 feed access—works on all assets and timeframes.
✅ Clear Visual Anchoring
Volume quantities and price levels are offset to the right for easy viewing without cluttering the active chart area.
✅ Fast Market Context Recognition
Quickly identify price levels where volume concentrated historically, improving decision-making for entries/exits.
5. Indicator User Guide
📌 Basic Concept
Orderbook Table analyzes a configurable number of past bars and distributes traded volume into price "bins."
Each bin shows how much volume occurred around that price level, optionally adjusted for bullish/bearish candle direction.
⚙️ Settings Overview
Lookback Bars: Number of candles to scan for volume history
Levels (Total): Number of price levels to display around the current price
Price Bins: Granularity of price segmentation for volume distribution
Shift Right: How far to offset labels to the right of the current bar
Max/Min Opacity: Controls visual strength of volume coloring
Use Candle Delta Approx.: If enabled, colors the volume based on candle direction (green for up, red for down)
📈 Example Timing
Look for green clusters (bullish bias) below current price → possible strong demand zones
Price enters a high-volume level with previously aggressive buyers (green), suggesting support
📉 Example Timing
Red clusters (bearish bias) above current price can act as resistance or supply zones
Price stalling at a red-heavy volume band may indicate exhaustion or reversal opportunity
🧪 Recommended Use
Use as a support/resistance mapping tool in ranging and trending markets
Pair with candlestick analysis or momentum indicators for refined entry/exit points
Combine with VWAP or volume profile for multi-dimensional volume insight
🔒 Cautions
This is an approximation, not a true L2 orderbook—volume is based on historical candles, not actual limit order data
In low-volume markets or higher timeframes, bin granularity may be too coarse—adjust "Price Bins" accordingly
Delta calculation is based on open-close direction and does not reflect true buy/sell volume splits
Avoid overinterpreting low-opacity (light color) zones—they may indicate low interest rather than true resistance/support
+++

Dynamic Support and Resistance with Trend LinesDynamic Support and Resistance with Trend Lines (DSRTL)
1. Introduction & Methodology
The DSRTL indicator is designed to provide a multidimensional analysis of market structure. Unlike traditional tools that rely solely on price pivots, this script combines Static Volume-based Zones with Dynamic Trend Lines to evaluate the price's position relative to critical market components.
The S/R Identification Technique
Instead of standard pivot points, DSRTL utilizes Volume Analysis to highlight areas of significant trader participation:
- Strategy A:
Matrix Climax: Identifies candles within the lookback period that are near price extremes (Highs/Lows) and coincide with significant buying or selling volume.
- Strategy B:
Volume Extremes: Detects candles with the absolute highest buy/sell volumes within the selected lookback window, creating extreme volume-based S/R zones.
- Result:
This creates Support/Resistance (S/R) zones that are validated by actual market activity, not just price geometry.
Dynamic Trend Lines
To complement the static zones, the indicator employs two adaptive channel methods:
- Pivot Span: Connects recent significant pivots for a fast, reactive trend corridor.
- 5-Point Channel: Segments the lookback period into 5 parts to perform a linear regression analysis, creating a stable and statistically significant channel.
2. Volume Calculation Methodology
Accurate S/R detection requires distinguishing Buy Volume from Sell Volume. DSRTL offers two calculation modes:
- Geometry (Source File): Estimates buy/sell volume based on the Close price's position relative to the High/Low of the candle.
Note: This is an approximation that works on all plan types as it does not require intrabar data.
- Intrabar (Precise): Analyzes historical lower-timeframe data (e.g., 15S) to calculate intrabar-based volume deltas with higher precision compared to the geometric method.
Note: This offers superior accuracy. It requires access to historical intrabar data (depending on your plan limits). For the best analytical results, use this mode if available.
3. The Smart Matrix Engine (3D Analysis)
The core of DSRTL is its dashboard, powered by the "Smart Matrix Engine." This engine evaluates the current price in a multi-layer market structure context (Static Volume Zones + Dynamic Channels + Volume Metrics).:
A. S-State (Static): Where is the price relative to the Volume S/R zones?
B. D-State (Dynamic): Where is the price relative to the Trend Channels?
How to read the Matrix Map:
The dashboard displays a 5x5 grid representing 25 possible market scenarios.
- Rows (S1-S5): Represent the Static State (S1=Breakout, S3=Mid-Range, S5=Breakdown).
- Columns (D1-D5): Represent the Dynamic State (D1=Overextended Up, D3=Neutral, D5=Overextended Down).
- Active Cell: Marked with a dot, indicating the specific intersection of price action and market structure.
4. Matrix Interpretations (The 25 Scenarios)
Below is the detailed logic for every possible state displayed on the dashboard, explaining the Title, Bias, and actionable Signal.
Section I: S1 - Static Breakout (Price > Static Resistance)
The price has cleared the static volume resistance zone.
- S1 / D1: HYPER EXTENSION
Bias: Extreme Bullish
Signal: Caution: Exhaustion Risk. Trail stops tight.
- S1 / D2: RESISTANCE CLASH
Bias: Bullish
Signal: Breakout confirmed but facing immediate dynamic resistance.
- S1 / D3: CHANNEL BREAKOUT
Bias: Strong Bullish
Signal: Ideal Trend Continuation. Look to buy dips.
- S1 / D4: SMART PULLBACK
Bias: Bullish (Pullback)
Signal: A pullback occurring after a breakout. Strong buy opportunity.
- S1 / D5: CONFLICT (DIV)
Bias: Conflict/Reversal
Signal: Major Divergence. Static breakout is failing against dynamic structure. High Risk.
Section II: S2 - Inside Static Resistance
The price is currently testing the overhead resistance zone.
- S2 / D1: WEAK SPIKE
Bias: Neutral/Bullish
Signal: Testing resistance, but short-term overextended.
- S2 / D2: IRON FORTRESS (R)
Bias: Rejection Risk
Signal: Double Resistance (Static + Dynamic). High probability of rejection.
- S2 / D3: TESTING RES
Bias: Neutral
Signal: Consolidating at resistance. Wait for a clear break or rejection.
- S2 / D4: COMPRESSION (UP)
Bias: Conflict (Squeeze)
Signal: Squeezed between Static Resistance and Dynamic Support. Volatility imminent.
- S2 / D5: RES vs DOWN-TREND
Bias: Bearish
Signal: Strong downtrend meeting static resistance. Potential Short entry.
Section III: S3 - Mid-Range
The price is floating between significant Static Support and Resistance.
- S3 / D1: OVERBOUGHT RANGE
Bias: Rejection Risk (OB)
Signal: Overextended within the range. Potential fade (short).
- S3 / D2: RANGE HIGH LIMIT
Bias: Neutral/Bearish
Signal: At the top of the dynamic channel. Look for rejection signs.
- S3 / D3: NEUTRAL / CHOPPY
Bias: Neutral
Signal: Dead Center. Low probability environment. Avoid trading.
- S3 / D4: RANGE DIP BUY
Bias: Neutral/Bullish
Signal: At the bottom of the dynamic channel. Look for bounce signs.
- S3 / D5: WEAK RANGE (OS)
Bias: Bounce Risk (OS)
Signal: Oversold within the range. Potential fade (long).
Section IV: S4 - Inside Static Support
The price is currently testing the floor support zone.
- S4 / D1: SUP vs UP-TREND
Bias: Bullish
Signal: Strong uptrend meeting static support. Potential Long entry.
- S4 / D2: COMPRESSION (DN)
Bias: Conflict (Squeeze)
Signal: Squeezed between Static Support and Dynamic Resistance. Volatility imminent.
- S4 / D3: TESTING SUPPORT
Bias: Neutral
Signal: Consolidating at support. Wait for a bounce or breakdown.
- S4 / D4: IRON FLOOR (S)
Bias: Bounce Risk
Signal: Double Support (Static + Dynamic). High probability of a bounce.
- S4 / D5: WEAK DIP
Bias: Neutral/Bearish
Signal: Testing support, but short-term oversold.
Section V: S5 - Static Breakdown (Price < Static Support)
The price has dropped below the static volume support zone.
- S5 / D1: CONFLICT (DIV)
Bias: Conflict/Reversal
Signal: Major Divergence. Static breakdown is failing. High Risk.
- S5 / D2: BEAR PULLBACK
Bias: Bearish (Pullback)
Signal: A pullback occurring after a breakdown. Strong selling opportunity.
- S5 / D3: CHANNEL BREAKDOWN
Bias: Strong Bearish
Signal: Ideal Trend Continuation (Down). Sell rallies.
- S5 / D4: SUPPORT CLASH
Bias: Bearish
Signal: Breakdown confirmed but facing immediate dynamic support.
- S5 / D5: HYPER DROP (VOID)
Bias: Extreme Bearish
Signal: Caution: Climax risk. Trail stops for shorts.
DISCLAIMER & EDUCATIONAL PURPOSE
This indicator is strictly an educational tool designed to visualize complex market structure concepts. Its primary purpose is to help traders "bridge the gap" between academic theory and real-time market behavior by providing a visual representation of support, resistance, and volume dynamics.
Please Note:
1. Not a Trading Strategy: This script is an analytical assistant, not a standalone "Black Box" trading system. It does not generate buy or sell signals that should be followed blindly.
2. No Financial Advice: The data provided by this tool is for informational purposes only. It is not a recommendation to buy or sell any asset.
3. Risk Warning: Trading involves significant risk. Always use your own judgment, perform your own technical analysis, and use proper risk management. Do not use this tool as the sole basis for your trading decisions.
4. Data Precision & Platform Limits: The "Intrabar (Precise)" calculation mode relies on high-resolution historical data to provide exact results. Access to this specific data depth depends entirely on your platform's subscription capabilities. If your plan does not support this level of historical intrabar data, the Precise mode may have limited coverage. In that case, you should switch to "Geometry" mode for a fully populated view.

Filter Volume1. Indicator Name
Filter Volume
2. One-line Introduction
A regression-based trend filter that quantifies and visualizes market direction and strength using price behavior.
3. Overall Description
Filter Volume+ is a trend-detection indicator that uses linear regression to evaluate the dominant direction of price movement over a given period.
It compares historical regression values to determine whether the market is in a bullish, bearish, or neutral state.
The indicator applies a percentage threshold to filter out weak or indecisive trends, highlighting only significant movements.
Each trend state is visualized through distinct colors: bullish (greenish), bearish (reddish), and neutral (gray), with intensity reflecting trend strength.
To reduce noise and create smooth visual signals, a three-step smoothing process is applied to the raw trend intensity.
Users can customize the regression source, lookback period, and sensitivity, allowing the indicator to adapt to various assets and timeframes.
This tool is especially useful in filtering entry signals based on clear directional bias, making it suitable for trend-following or confirmation strategies.
4. Key Benefits (Title + Description)
✅ Quantified Trend Strength
Only displays trend signals when a statistically significant direction is detected using linear regression comparisons.
✅ Visual Clarity with Color Coding
Each market state (bullish, bearish, neutral) is represented with distinct colors and transparency, enabling fast interpretation.
✅ Custom Regression Source
Users can define the data input (e.g., close, open, indicator output) for regression calculation, increasing strategic flexibility.
✅ Multi-Level Smoothing
Applies three layers of smoothing (via moving averages) to eliminate noise and produce a stable, flowing trend curve.
✅ Area Fill Visualization
Plots a colored band between the trend value and zero-line, helping users quickly gauge the market's dominant force.
✅ Adjustable Sensitivity Settings
Includes tolerance and lookback controls, allowing traders to fine-tune how reactive or conservative the trend detection should be.
5. Indicator User Guide
📌 Basic Concept
Filter Volume+ assesses the direction of price by comparing regression values over a selected period.
If the percentage of upward comparisons exceeds a threshold, a bullish state is shown; if downward comparisons dominate, it shows a bearish state.
⚙️ Settings Overview
Lookback Period (n): The number of bars to compare for trend analysis
Range Tolerance (%): Minimum threshold for declaring a strong trend
Regression Source: The data used for regression (e.g., close, open)
Linear Regression Length: Number of bars used to compute each regression value
Bull/Bear Color: Custom colors for bullish and bearish trends
📈 Example Timing
When the trend line stays above zero and the green color intensity increases → trend gaining strength
After a neutral phase (gray), the color shifts quickly to greenish → early trend reversal
📉 Example Timing
When the trend line stays below zero with deepening red color → strong bearish continuation
Sudden change from bullish to bearish color with rising intensity
🧪 Recommended Use
Use as a trend confirmation filter alongside entry/exit strategies
Ideal for swing or position trades in trending markets
Combine with oscillators like RSI or MACD for improved signal validation
🔒 Cautions
In ranging (sideways) markets, the color may change frequently – avoid relying solely on this indicator in those zones.
Low-intensity colors (faded) suggest weak trends – better to stay on the sidelines.
A short lookback period may cause over-sensitivity and false signals.
When using non-price regression sources, expect the indicator to behave differently – test before deploying.
+++

CVD [able0.1]# CVD Overlay iOS Style - Complete User Guide
## 📖 Table of Contents
1. (#what-is-cvd)
2. (#installation-guide)
3. (#understanding-the-display)
4. (#reading-the-info-table)
5. (#settings--customization)
6. (#trading-strategies)
7. (#common-mistakes-to-avoid)
---
## 🎯 What is CVD?
**CVD (Cumulative Volume Delta)** tracks the **difference between buying and selling pressure** over time.
### Simple Explanation:
- **Positive CVD** (Orange) = More buying than selling = Bulls winning
- **Negative CVD** (Gray) = More selling than buying = Bears winning
- **Rising CVD** = Increasing buying pressure = Potential uptrend
- **Falling CVD** = Increasing selling pressure = Potential downtrend
### Why It Matters:
CVD helps you see **who's really in control** of the market - not just price movement, but actual buying/selling volume.
---
## 🚀 Installation Guide
### Step 1: Open Pine Editor
1. Go to TradingView
2. Click the **"Pine Editor"** tab at the bottom of the screen
3. Click **"New"** or open an existing script
### Step 2: Copy & Paste the Code
1. Select all existing code (Ctrl+A / Cmd+A)
2. Delete it
3. Copy the entire CVD iOS Style code
4. Paste it into Pine Editor
### Step 3: Add to Chart
1. Click **"Save"** button (or Ctrl+S / Cmd+S)
2. Click **"Add to Chart"** button
3. The indicator will appear on your chart!
### Step 4: Initial Setup
- The indicator appears as an **overlay** on your price chart
- You'll see an **orange/gray line** following price
- An **info table** appears in the top-right corner
---
## 📊 Understanding the Display
### Main Chart Elements:
#### 1. **CVD Line** (Orange/Gray)
- **Orange Line** = Positive CVD (buying pressure)
- **Gray Line** = Negative CVD (selling pressure)
- This line moves with your price chart but shows volume delta
#### 2. **CVD Zone** (Shaded Area)
- Light shaded box around the CVD line
- Shows the "range" of CVD movement
- Helps visualize CVD boundaries
#### 3. **Center Line** (Dotted)
- Gray dotted line in the middle of the zone
- Represents the "neutral" point
- CVD crossing this = shift in market control
#### 4. **Reference Asset Line** (Light Gray)
- Shows Bitcoin (BTC) price movement for comparison
- Helps you see if your asset moves with or against BTC
- Can be changed to any asset you want
#### 5. **CVD Label**
- Shows current CVD value
- Positioned above/below zone to avoid overlap
- Updates in real-time
#### 6. **Reset Background** (Very Light Gray)
- Appears when CVD resets
- Indicates a new calculation period
---
## 📋 Reading the Info Table
The info table (top-right) shows **8 key metrics**:
### Row 1: **Header**
```
╔═ CVD able ═╗ | 15m | ████████ | able
```
- **CVD able** = Indicator name + creator
- **15m** = Current timeframe
- **████████** = Visual decoration
- **able** = Creator signature
### Row 2: **CVD Value**
```
CVD▲ | 7.39K | ████████ | █
█
█
```
- **CVD▲** = CVD with trend arrow
- ▲ = CVD increasing
- ▼ = CVD decreasing
- ► = CVD unchanged
- **7.39K** = Actual CVD number
- **Progress Bar** = Visual strength (darker = stronger)
- **Vertical Bars** = Height shows intensity
### Row 3: **Delta**
```
◆DELTA | -1.274K | ████░░░░ | ░
░
```
- **Delta** = Volume change THIS BAR ONLY
- **Negative** = More selling this bar
- **Positive** = More buying this bar
- Shows **immediate** pressure (not cumulative)
### Row 4: **UP Volume**
```
UP↑ | -1.263K | ████████ | █
█
█
```
- Total **buying volume** this bar
- Higher = Stronger buying pressure
- Green/Orange vertical bars = Bullish strength
### Row 5: **DOWN Volume**
```
DN↓ | 2.643K | ████████ | ░
░
░
```
- Total **selling volume** this bar
- Higher = Stronger selling pressure
- Gray vertical bars = Bearish strength
### Row 6-7: **Reference Asset** (if enabled)
```
══ REF ══ | ══════ | ████████ | █
█
PRICE▲ | 4130.300 | ████████ | █
█
```
- **REF** = Reference asset header
- **PRICE▲** = Reference price with trend
- Shows if BTC (or chosen asset) is rising/falling
- Compare with your chart to see correlation
### Row 8: **Market Status**
```
◄STATUS► | NEUT | ████░░░░ | ▒
▒
```
- **BULL** = CVD positive + Delta positive = Strong buying
- **BEAR** = CVD negative + Delta negative = Strong selling
- **NEUT** = Mixed signals = Wait for clarity
**Status Colors:**
- **Orange background** = Bullish (good for long)
- **Gray background** = Bearish (good for short)
- **White background** = Neutral (no clear signal)
---
## ⚙️ Settings & Customization
### Main Settings (⚙️)
#### **CVD Reset**
- **None** = CVD never resets (from beginning of data)
- **On Higher Timeframe** = Resets when HTF candle closes
- 15m chart → Resets hourly
- 1h chart → Resets daily
- Recommended for most traders
- **On Session Start** = Resets at market open
- **On Visible Chart** = Resets from leftmost visible bar
#### **Precision**
- **Low (Fast)** = Uses 1m data, faster but less accurate
- **Medium** = Uses 5m data, balanced (recommended)
- **High** = Uses 15m data, most accurate but slower
#### **Cumulative**
- ✅ On = CVD accumulates over time (recommended)
- ❌ Off = Shows only current bar delta
#### **Show Labels**
- ✅ On = Shows CVD value label on chart
- ❌ Off = Cleaner chart, no label
#### **Show Info Table**
- ✅ On = Shows info table (recommended for beginners)
- ❌ Off = Hide table for minimalist view
---
### 🎨 iOS Style Colors
You can customize **every color** to match your chart theme:
#### **Primary Colors**
- **Primary (Orange)** = Main bullish color (#FF9500)
- **Secondary (Gray)** = Main bearish color (#8E8E93)
- **Background** = Table background (#FFFFFF)
- **Text** = Text color (#1C1C1E)
#### **Bullish/Bearish**
- **Bullish (Orange)** = Positive CVD color
- **Bearish (Gray)** = Negative CVD color
- **Opacity** = Zone transparency (0-100%)
- **Show Zone** = Enable/disable shaded area
#### **Table Colors** (📋)
- **Header Background** = Top row background
- **Header Text** = Top row text color
- **Cell Background** = Data cells background
- **Cell Text** = Data cells text color
- **Border** = Table border color
- **Accent Background** = Special rows background
- **Alert Background** = Warning/status background
---
### 📊 Reference Asset Settings
#### **Enable**
- ✅ On = Shows reference asset line
- ❌ Off = Hide reference asset
#### **Symbol**
- Default: `BINANCE:BTCUSDT`
- Can change to any asset:
- `BINANCE:ETHUSDT` (Ethereum)
- `SPX` (S&P 500)
- `DXY` (US Dollar Index)
- Any ticker symbol
#### **Color & Width**
- Customize line appearance
- Width: 1-4 (thickness)
---
## 💡 Trading Strategies
### Strategy 1: CVD Divergence (Beginner-Friendly)
**What to Look For:**
- Price making **higher highs** but CVD making **lower highs** = Bearish divergence
- Price making **lower lows** but CVD making **higher lows** = Bullish divergence
**How to Trade:**
1. Wait for divergence to form
2. Look for confirmation (price reversal, candlestick pattern)
3. Enter trade in divergence direction
4. Stop loss beyond recent high/low
**Example:**
```
Price: /\ /\ /\ (higher highs)
CVD: /\ / \/ (lower highs) = Bearish signal
```
### Strategy 2: CVD Trend Following (Intermediate)
**What to Look For:**
- **Strongly rising CVD** + **rising price** = Strong uptrend
- **Strongly falling CVD** + **falling price** = Strong downtrend
**How to Trade:**
1. Wait for CVD and price moving in same direction
2. Enter on pullbacks to support/resistance
3. Stay in trade while CVD trend continues
4. Exit when CVD trend breaks
**Signals:**
- CVD ▲▲▲ + Price ↑ = Go LONG
- CVD ▼▼▼ + Price ↓ = Go SHORT
### Strategy 3: CVD + Reference Asset (Advanced)
**What to Look For:**
- Your asset **rising** but BTC (reference) **falling** = Relative strength
- Your asset **falling** but BTC (reference) **rising** = Relative weakness
**How to Trade:**
1. Compare CVD movement with BTC
2. If your CVD rises faster than BTC = Buy signal
3. If your CVD falls faster than BTC = Sell signal
4. Use for **pair trading** or **asset selection**
### Strategy 4: Volume Delta Confirmation
**What to Look For:**
- **Large positive Delta** = Strong buying this bar
- **Large negative Delta** = Strong selling this bar
**How to Trade:**
1. Price breaks resistance + Large positive Delta = Confirmed breakout
2. Price breaks support + Large negative Delta = Confirmed breakdown
3. Use Delta to **confirm** price moves, not predict them
**Rules:**
- Delta > 2x average = Very strong pressure
- Delta near zero at key level = Weak move, likely false breakout
---
## 🎓 Reading Real Scenarios
### Scenario 1: Strong Buying Pressure
```
Table Shows:
CVD▲ | 12.5K | ████████ | ████ (CVD rising)
◆DELTA | +2.8K | ████████ | ▲ (Positive delta)
UP↑ | 3.1K | ████████ | ████ (High buy volume)
DN↓ | 0.3K | ██░░░░░░ | ░ (Low sell volume)
◄STATUS► | BULL | ████████ | ████ (Orange background)
```
**Interpretation:** Strong buying, good for LONG trades
### Scenario 2: Distribution (Hidden Selling)
```
Table Shows:
CVD► | 8.2K | ████░░░░ | ▒▒ (CVD flat)
◆DELTA | -1.5K | ████████ | ▼ (Negative delta)
UP↑ | 0.8K | ███░░░░░ | ░ (Low buy volume)
DN↓ | 2.3K | ████████ | ████ (High sell volume)
◄STATUS► | BEAR | ████████ | ░░░░ (Gray background)
```
**Interpretation:** Price may look stable, but selling increasing = Prepare for drop
### Scenario 3: Neutral/Choppy Market
```
Table Shows:
CVD► | 5.1K | ████░░░░ | ▒ (CVD sideways)
◆DELTA | +0.2K | ██░░░░░░ | ─ (Small delta)
UP↑ | 1.2K | ████░░░░ | ▒ (Medium buy)
DN↓ | 1.0K | ████░░░░ | ▒ (Medium sell)
◄STATUS► | NEUT | ████░░░░ | ▒▒ (White background)
```
**Interpretation:** No clear direction = Stay out or reduce position size
---
## ⚠️ Common Mistakes to Avoid
### Mistake 1: Trading on CVD Alone
- ❌ **Wrong:** "CVD is rising, I'll buy immediately"
- ✅ **Right:** "CVD is rising, let me check price structure, support/resistance, and wait for confirmation"
### Mistake 2: Ignoring Delta
- ❌ **Wrong:** Looking only at cumulative CVD
- ✅ **Right:** Watch both CVD (trend) and Delta (momentum)
- Delta shows **immediate** pressure changes
### Mistake 3: Wrong Timeframe
- ❌ **Wrong:** Using 1m chart with High Precision (too slow)
- ✅ **Right:** Match precision to timeframe:
- 1m-5m → Low Precision
- 15m-1h → Medium Precision
- 4h+ → High Precision
### Mistake 4: Not Using Reset
- ❌ **Wrong:** Using "None" reset for intraday trading
- ✅ **Right:** Use "On Higher Timeframe" to see fresh CVD each session
### Mistake 5: Overtrading Neutral Status
- ❌ **Wrong:** Forcing trades when STATUS = NEUT
- ✅ **Right:** Only trade clear BULL or BEAR status
### Mistake 6: Ignoring Reference Asset
- ❌ **Wrong:** Trading altcoin without checking BTC
- ✅ **Right:** Always check if BTC CVD agrees with your asset
---
## 🔥 Pro Tips
### Tip 1: Multi-Timeframe Analysis
- Check CVD on **3 timeframes**:
- Lower TF (15m) = Entry timing
- Current TF (1h) = Trade direction
- Higher TF (4h) = Overall trend
### Tip 2: Volume Confirmation
- Big price move + Small Delta = **Weak move** (likely reversal)
- Small price move + Big Delta = **Strong accumulation** (continuation)
### Tip 3: CVD Reset Zones
- Pay attention to **reset backgrounds** (light gray)
- Often marks **session starts** = High volatility periods
### Tip 4: Divergence + Status
- Bearish divergence + STATUS = BEAR = **Strongest short signal**
- Bullish divergence + STATUS = BULL = **Strongest long signal**
### Tip 5: Color Psychology
- **Orange** (Bullish) is **warm** = Buying energy
- **Gray** (Bearish) is **cool** = Selling pressure
- Train your eye to read colors instantly
### Tip 6: Table as Quick Scan
- Glance at table without reading numbers:
- **All orange** = Bullish
- **All gray** = Bearish
- **Mixed** = Wait
---
## 📱 Quick Reference Card
| Signal | CVD | Delta | Status | Action |
|--------|-----|-------|--------|--------|
| **Strong Buy** | ▲▲ High | ++ Positive | BULL | Long Entry |
| **Strong Sell** | ▼▼ Low | -- Negative | BEAR | Short Entry |
| **Divergence Buy** | ▲ Rising | Price ▼ | → BULL | Long Setup |
| **Divergence Sell** | ▼ Falling | Price ▲ | → BEAR | Short Setup |
| **Neutral** | → Flat | ~0 Near Zero | NEUT | Stay Out |
| **Accumulation** | → Flat | ++ Positive | NEUT→BULL | Watch for Breakout |
| **Distribution** | → Flat | -- Negative | NEUT→BEAR | Watch for Breakdown |
---
## 🆘 Troubleshooting
### Issue: "Indicator not showing"
- **Solution:** Make sure overlay=true in code, re-add to chart
### Issue: "Table overlaps with price"
- **Solution:** Change table position in code or use TradingView's "Move" feature
### Issue: "CVD line too far from price"
- **Solution:** This is normal! CVD is volume-based, not price-based. Focus on CVD direction, not position
### Issue: "Too many lines on chart"
- **Solution:** Disable "Show Zone" and "Show Labels" in settings for cleaner view
### Issue: "Calculations too slow"
- **Solution:** Change Precision to "Low (Fast)" or use higher timeframe
### Issue: "Reference asset not showing"
- **Solution:** Check if "Enable" is ON and symbol is valid (e.g., BINANCE:BTCUSDT)
---
## 🎬 Getting Started Checklist
- Install indicator on TradingView
- Set precision to "Medium"
- Set reset to "On Higher Timeframe"
- Enable info table
- Add reference asset (BTC)
- Practice reading the table on demo account
- Test on different timeframes (15m, 1h, 4h)
- Compare CVD with your current strategy
- Paper trade for 1 week before going live
- Keep a trading journal of CVD signals
---
## 📚 Summary
**CVD shows WHO is winning: Buyers or Sellers**
**Key Points:**
1. **Orange/Rising CVD** = Buying pressure = Bullish
2. **Gray/Falling CVD** = Selling pressure = Bearish
3. **Delta** = Immediate momentum THIS BAR
4. **Status** = Overall market condition
5. **Always confirm** with price action & other indicators
**Remember:**
- CVD is a **tool**, not a crystal ball
- Use with proper risk management
- Practice makes perfect
- Stay disciplined!
---
**Created by: able**
**Version:** iOS Style v1.0
**Contact:** For questions, refer to TradingView community
Happy Trading! 🚀📈

Moving VWAP-KAMA CloudMoving VWAP-KAMA Cloud
Overview
The Moving VWAP-KAMA Cloud is a high-conviction trend filter designed to solve a major problem with standard indicators: Noise. By combining a smoothed Volume Weighted Average Price (MVWAP) with Kaufman’s Adaptive Moving Average (KAMA), this indicator creates a "Value Zone" that identifies the true structural trend while ignoring choppy price action.
Unlike brittle lines that break constantly, this cloud is "slow" by design—making it exceptionally powerful for spotting genuine trend reversals and filtering out fakeouts.
How It Works
This script uses a unique "Double Smoothing" architecture:
The Anchor (MVWAP): We take the standard VWAP and smooth it with a 30-period EMA. This represents the "Fair Value" baseline where volume has supported price over time.
The Filter (KAMA): We apply Kaufman's Adaptive Moving Average to the already smoothed MVWAP. KAMA is unique because it flattens out during low-volatility (choppy) periods and speeds up during high-momentum trends.
The Cloud:
Green/Teal Cloud: Bullish Structure (MVWAP > KAMA)
Purple Cloud: Bearish Structure (MVWAP < KAMA)
🔥 The "Reversal Slingshot" Strategy
Backtests reveal a powerful behavior during major trend changes, particularly after long bear markets:
The Resistance Phase: During a long-term downtrend, price will repeatedly rally into the Purple Cloud and get rejected. The flattened KAMA line acts as a "concrete ceiling," keeping the bearish trend intact.
The Breakout & Flip: When price finally breaks above the cloud with conviction, and the cloud flips Green, it signals a structural regime change.
The "Slingshot" Retest: Often, immediately after this flip, price will drop back into the top of the cloud. This is the "Slingshot" moment. The old resistance becomes new, hardened support.
The Rally: From this support bounce, stocks often launch into a sustained, multi-month bull run. This setup has been observed repeatedly at the bottom of major corrections.
How to Use This Indicator
1. Dynamic Support & Resistance
The KAMA Wall: When price retraces into the cloud, the KAMA line often flattens out, acting as a hard "floor" or "wall." A break of this wall usually signals a genuine trend change, not just a stop hunt.
2. Trend Confirmation (Regime Filter)
Bullish Regime: If price is holding above the cloud, only look for Long setups.
Bearish Regime: If price is holding below the cloud, only look for Short setups.
No-Trade Zone: If price is stuck inside the cloud, the market is traversing fair value. Stand aside until a clear winner emerges.
3. Multi-Timeframe Versatility
While designed for trend confirmation on higher timeframes (4H, Daily), this indicator adapts beautifully to lower timeframes (5m, 15m) for intraday scalping.
On Lower Timeframes: The cloud reacts much faster, acting as a dynamic "VWAP Band" that helps intraday traders stay on the right side of momentum during the session.
Settings
Moving VWAP Period (30): The lookback period for the base VWAP smoothing.
KAMA Settings (10, 10, 30): Controls the sensitivity of the adaptive filter.
Cloud Transparency: Adjust to keep your chart clean.
Alerts Included
Price Cross Over/Under MVWAP
Price Cross Over/Under KAMA
Cloud Flip (Bullish/Bearish Trend Change)
Tip for Traders
This is not a signal entry indicator. It is a Trend Conviction tool. Use it to filter your entries from faster indicators (like RSI or MACD). If your fast indicator signals "Buy" but the cloud is Purple, the probability is low. Wait for the Cloud Flip

Mark Minervini SEPA Swing TradingMark Minervini Complete Technical Strategy with buy signals and full dashboard showing all the parameters.

HVPro Style IndicatorHVPro Style Indicator – Historical Volatility + Volume
HVPro Style Indicator is a combined volatility-and-volume tool designed to help traders visualize market expansion and contraction phases.
It calculates Historical Volatility (HV) using log-returns and a customizable lookback period, then smooths the result for a cleaner trend signal.
The script also includes a volume histogram, scaled by a multiplier, with bar colors changing based on whether volatility is rising or falling.
This makes it easy to spot moments when both volume and volatility align, often signaling trend transitions, breakouts, or exhaustion.
Features
✔ Historical Volatility calculation (annualized)
✔ Smoothed HV for cleaner visual trends
✔ Volume histogram with customizable multiplier
✔ Volume bar color shifts based on HV direction
✔ User-controlled visibility for both HV and volume
✔ Lightweight and optimized for all timeframes
How to Use
Rising HV (green volume bars) can indicate trend expansion or breakout momentum.
Falling HV (red bars) suggests contraction, ranging conditions, or volatility cooldown.
Watch for volatility shifts combined with volume spikes for potential trade entries.


ULTIMATE ORDER FLOW SYSTEM🔥 ULTIMATE ORDER FLOW SYSTEM
Overview
This comprehensive order flow analysis tool combines **Volume Profile**, **Cumulative Delta**, and **Large Order Detection** to identify high-probability trading setups. The script analyzes institutional order flow patterns and volume distribution to pinpoint key levels where price is likely to react.
📊 Core Components & Methodology
🔥 ULTIMATE ORDER FLOW SYSTEM
Overview
This comprehensive order flow analysis tool combines Volume Profile, Cumulative Delta, and Large Order Detection to identify high-probability trading setups. The script analyzes institutional order flow patterns and volume distribution to pinpoint key levels where price is likely to react.
________________________________________
📊 Core Components & Methodology
1. Volume Profile Analysis
The script constructs a horizontal volume profile by:
• Dividing the price range into configurable rows (default: 20)
• Accumulating volume at each price level over a lookback period (default: 50 bars)
• Separating buy volume (green bars close > open) from sell volume (red bars)
• Identifying three critical levels:
o POC (Point of Control): Price level with highest traded volume - acts as a strong magnet
o VAH/VAL (Value Area High/Low): Contains 70% of total volume - defines fair value zone
o HVN (High Volume Nodes): Resistance zones where institutions accumulated positions
o LVN (Low Volume Nodes): Thin zones that price moves through quickly - ideal targets
Why This Matters: Institutional traders leave footprints through volume. HVN zones show where large players defended levels, making them reliable support/resistance.
________________________________________
2. Cumulative Delta (Order Flow)
Tracks the running total of buying vs selling pressure:
• Bar Delta: Difference between buy and sell volume per candle
• Cumulative Delta: Sum of all bar deltas - shows net directional pressure
• Delta Moving Average: Smoothed delta (20-period) to identify trend
• Delta Divergences:
o Bullish: Price makes lower low, but delta makes higher low (absorption at bottom)
o Bearish: Price makes higher high, but delta makes lower high (exhaustion at top)
How It Works: When cumulative delta trends up while price consolidates, it signals accumulation. Delta divergences reveal when smart money is positioned opposite to retail expectations.
________________________________________
3. Large Order Detection
Identifies institutional-sized orders in real-time:
• Compares current bar volume to 20-period moving average
• Flags orders exceeding 2.5x average volume (configurable multiplier)
• Distinguishes bullish (green circles below) vs bearish (red circles above) large orders
Rationale: Sudden volume spikes at key levels indicate institutional participation - the "fuel" needed for breakouts or reversals.
________________________________________
🎯 Trading Signal Logic
Combined Setup Criteria
The script generates SHORT and LONG signals when multiple conditions align:
SHORT Signal Requirements:
1. Price reaches an HVN resistance zone (within 0.2%)
2. Large sell order detected (volume spike + red candle)
3. Cumulative delta is bearish OR bearish divergence present
4. 10-bar cooldown between signals (prevents overtrading)
LONG Signal Requirements:
1. Price reaches an HVN support zone
2. Large buy order detected (volume spike + green candle)
3. Cumulative delta is bullish OR bullish divergence present
4. 10-bar cooldown enforced
________________________________________
🔧 Customization Options
Setting - Purpose - Recommendation
Volume Profile Rows - Granularity of level detection - 20 (balanced)
Lookback Period - Historical data analyzed - 50 bars (intraday), 200 (swing)
Large Order Multiplier - Sensitivity to volume spikes - 2.5x (standard), 3.5x (conservative)
HVN Threshold - Resistance zone detection - 1.3 (default)
LVN Threshold - Target zone identification - 0.6 (default)
Divergence Lookback - Pivot detection period - 5 bars (responsive)
________________________________________
📈 Dashboard Indicators
The real-time panel displays:
• POC: Current Point of Control price
• Location: Whether price is at HVN resistance
• Orders: Current large buy/sell activity
• Cumulative Δ: Net order flow value + trend direction
• Divergence: Active bullish/bearish divergences
• Bar Strength: % of candle volume that's directional (>65% = strong)
• SETUP: Current trade signal (LONG/SHORT/WAIT)
________________________________________
🎨 Visual System
• Yellow POC Line: Highest volume level - primary pivot
• Blue Value Area Box: Fair value zone (VAH to VAL)
• Red HVN Zones: Resistance/support from institutional accumulation
• Green LVN Zones: Low-liquidity targets for quick moves
• Volume Bars: Green (buy pressure) vs Red (sell pressure) distribution
• Triangles: LONG (green up) and SHORT (red down) entry signals
• Diamonds: Divergence warnings (cyan=bullish, fuchsia=bearish)
________________________________________
💡 How This Script Is Unique
Unlike standalone volume profile or delta indicators, this script:
1. Synthesizes three complementary methods - volume structure, order flow momentum, and liquidity detection
2. Requires multi-factor confirmation - signals only trigger when price, volume, and delta align at key zones
3. Adapts to market regime - delta filters ensure you're trading with the dominant order flow direction
4. Provides context, not just signals - the dashboard helps you understand why a setup is forming
________________________________________
⚙️ Best Practices
Timeframes:
• 5-15 min: Scalping (use 30-50 bar lookback)
• 1-4 hour: Swing trading (use 100-200 bar lookback)
Risk Management:
• Enter on signal candle close
• Stop loss: Beyond nearest HVN/LVN zone
• Target 1: Next LVN level
• Target 2: Opposite value area boundary
Filters:
• Avoid signals during major news events
• Require bar delta strength >65% for aggressive entries
• Wait for delta MA cross confirmation in ranging markets
________________________________________
🚨 Alerts Available
• Long Setup Trigger
• Short Setup Trigger
• Bullish/Bearish Divergence Detection
• Large Buy/Sell Order Execution
________________________________________
📚 Educational Context
This methodology is based on principles used by professional order flow traders:
• Market Profile Theory: Volume distribution reveals fair value
• Tape Reading: Large orders show institutional intent
• Auction Theory: Price seeks areas of liquidity imbalance (LVN zones)
The script automates pattern recognition that discretionary traders spend years learning to identify manually.
________________________________________
⚠️ Disclaimer
This indicator is a trading tool, not a trading system. It identifies high-probability setups based on order flow analysis but requires proper risk management, market context, and trader discretion. Past performance does not guarantee future results.
________________________________________
Version: 6 (Pine Script)
Type: Overlay + Separate Pane (Delta Panel)
Resource Usage: Moderate (500 bars history, 500 lines/boxes)
________________________________________
For questions or support, please comment below. If you find this script valuable, please boost and favorite! 🚀
1. Volume Profile Analysis
The script constructs a horizontal volume profile by:
- Dividing the price range into configurable rows (default: 20)
- Accumulating volume at each price level over a lookback period (default: 50 bars)
- Separating buy volume (green bars close > open) from sell volume (red bars)
- Identifying three critical levels:
- POC (Point of Control): Price level with highest traded volume - acts as a strong magnet
- VAH/VAL (Value Area High/Low): Contains 70% of total volume - defines fair value zone
- HVN (High Volume Nodes): Resistance zones where institutions accumulated positions
- LVN (Low Volume Nodes): Thin zones that price moves through quickly - ideal targets
Why This Matters: Institutional traders leave footprints through volume. HVN zones show where large players defended levels, making them reliable support/resistance.
---
2. Cumulative Delta (Order Flow)
Tracks the running total of buying vs selling pressure:
- **Bar Delta**: Difference between buy and sell volume per candle
- **Cumulative Delta**: Sum of all bar deltas - shows net directional pressure
- **Delta Moving Average**: Smoothed delta (20-period) to identify trend
- **Delta Divergences**:
- **Bullish**: Price makes lower low, but delta makes higher low (absorption at bottom)
- **Bearish**: Price makes higher high, but delta makes lower high (exhaustion at top)
**How It Works**: When cumulative delta trends up while price consolidates, it signals accumulation. Delta divergences reveal when smart money is positioned opposite to retail expectations.
---
### 3. **Large Order Detection**
Identifies **institutional-sized orders** in real-time:
- Compares current bar volume to 20-period moving average
- Flags orders exceeding 2.5x average volume (configurable multiplier)
- Distinguishes bullish (green circles below) vs bearish (red circles above) large orders
**Rationale**: Sudden volume spikes at key levels indicate institutional participation - the "fuel" needed for breakouts or reversals.
---
## 🎯 Trading Signal Logic
### Combined Setup Criteria
The script generates **SHORT** and **LONG** signals when multiple conditions align:
**SHORT Signal Requirements:**
1. Price reaches an HVN resistance zone (within 0.2%)
2. Large sell order detected (volume spike + red candle)
3. Cumulative delta is bearish OR bearish divergence present
4. 10-bar cooldown between signals (prevents overtrading)
**LONG Signal Requirements:**
1. Price reaches an HVN support zone
2. Large buy order detected (volume spike + green candle)
3. Cumulative delta is bullish OR bullish divergence present
4. 10-bar cooldown enforced
---
## 🔧 Customization Options
| Setting | Purpose | Recommendation |
|---------|---------|----------------|
| **Volume Profile Rows** | Granularity of level detection | 20 (balanced) |
| **Lookback Period** | Historical data analyzed | 50 bars (intraday), 200 (swing) |
| **Large Order Multiplier** | Sensitivity to volume spikes | 2.5x (standard), 3.5x (conservative) |
| **HVN Threshold** | Resistance zone detection | 1.3 (default) |
| **LVN Threshold** | Target zone identification | 0.6 (default) |
| **Divergence Lookback** | Pivot detection period | 5 bars (responsive) |
---
## 📈 Dashboard Indicators
The real-time panel displays:
- **POC**: Current Point of Control price
- **Location**: Whether price is at HVN resistance
- **Orders**: Current large buy/sell activity
- **Cumulative Δ**: Net order flow value + trend direction
- **Divergence**: Active bullish/bearish divergences
- **Bar Strength**: % of candle volume that's directional (>65% = strong)
- **SETUP**: Current trade signal (LONG/SHORT/WAIT)
---
## 🎨 Visual System
- **Yellow POC Line**: Highest volume level - primary pivot
- **Blue Value Area Box**: Fair value zone (VAH to VAL)
- **Red HVN Zones**: Resistance/support from institutional accumulation
- **Green LVN Zones**: Low-liquidity targets for quick moves
- **Volume Bars**: Green (buy pressure) vs Red (sell pressure) distribution
- **Triangles**: LONG (green up) and SHORT (red down) entry signals
- **Diamonds**: Divergence warnings (cyan=bullish, fuchsia=bearish)
---
## 💡 How This Script Is Unique
Unlike standalone volume profile or delta indicators, this script:
1. **Synthesizes three complementary methods** - volume structure, order flow momentum, and liquidity detection
2. **Requires multi-factor confirmation** - signals only trigger when price, volume, and delta align at key zones
3. **Adapts to market regime** - delta filters ensure you're trading with the dominant order flow direction
4. **Provides context, not just signals** - the dashboard helps you understand *why* a setup is forming
---
## ⚙️ Best Practices
**Timeframes:**
- 5-15 min: Scalping (use 30-50 bar lookback)
- 1-4 hour: Swing trading (use 100-200 bar lookback)
**Risk Management:**
- Enter on signal candle close
- Stop loss: Beyond nearest HVN/LVN zone
- Target 1: Next LVN level
- Target 2: Opposite value area boundary
**Filters:**
- Avoid signals during major news events
- Require bar delta strength >65% for aggressive entries
- Wait for delta MA cross confirmation in ranging markets
---
## 🚨 Alerts Available
- Long Setup Trigger
- Short Setup Trigger
- Bullish/Bearish Divergence Detection
- Large Buy/Sell Order Execution
---
## 📚 Educational Context
This methodology is based on principles used by professional order flow traders:
- **Market Profile Theory**: Volume distribution reveals fair value
- **Tape Reading**: Large orders show institutional intent
- **Auction Theory**: Price seeks areas of liquidity imbalance (LVN zones)
The script automates pattern recognition that discretionary traders spend years learning to identify manually.
---
## ⚠️ Disclaimer
This indicator is a **trading tool, not a trading system**. It identifies high-probability setups based on order flow analysis but requires proper risk management, market context, and trader discretion. Past performance does not guarantee future results.
---
**Version**: 6 (Pine Script)
**Type**: Overlay + Separate Pane (Delta Panel)
**Resource Usage**: Moderate (500 bars history, 500 lines/boxes)
---
*For questions or support, please comment below. If you find this script valuable, please boost and favorite!* 🚀

SHIVAJI 1:2 SIMPLE BREAKOUT SETUP - CLEANManage risk reward and use this indicator
Breakout structure auto correct
Volume consider in break out
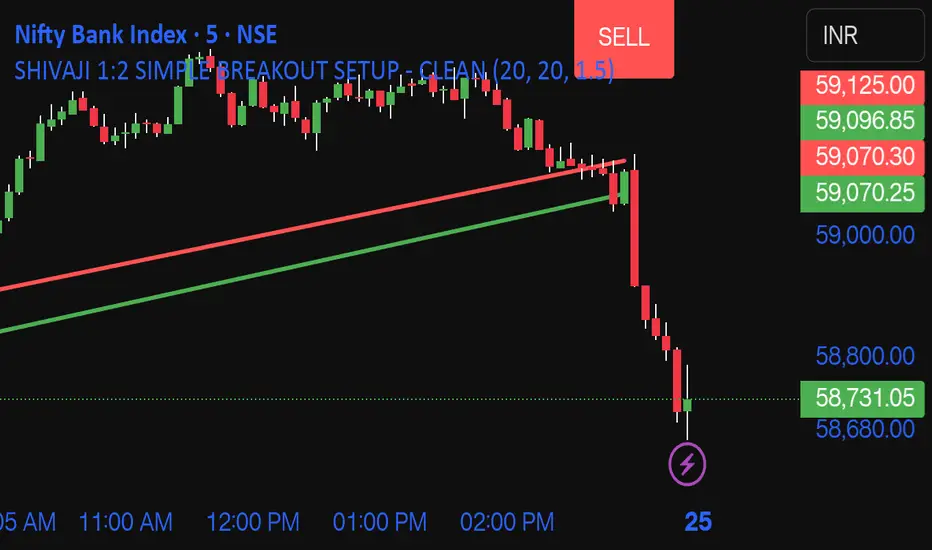
VWAP, Vol & RTH Stats (Custom Layout)VWAP, Volume & RTH Stats Box This indicator displays a data table in the top-right corner of the chart designed for intraday liquidity analysis. It fetches the true "Daily" volume to ensure accuracy regardless of the timeframe used. It specifically isolates Regular Trading Hours (RTH) to calculate the daily range performance (Max Squeeze % and Max Drop %), filtering out pre-market noise to show the true strength of the move. Includes full customization for dimensions, margins, and colors.
Accumulation And Distribution Zones (Zeiierman)█ Overview
Accumulation And Distribution Zones (Zeiierman) is a structural zone indicator that highlights where the market has recently been absorbing sell pressure (Accumulation) or releasing buy pressure (Distribution).
The indicator tracks a refined sequence of swing highs and lows and measures how these swings tighten, expand, or step directionally. When they form staircase-style structures such as higher lows with compressing highs for Accumulation or lower highs with compressing lows for Distribution, the script marks these areas as shifts in market control.
Once the full pattern completes, the indicator converts it into an Accumulation or Distribution zone. Each zone is based on a confirmed structural sequence rather than a single point, making it more reliable and reflective of actual market behavior.
The indicator can also display a mini-volume profile within each zone and extend POC levels forward, showing where trading activity clustered most. Combined, these features reveal areas where price has recently shown acceptance, absorption, or rejection, helping you understand whether current price action is reacting to, breaking from, or retesting these important structural regions.
█ How It Works
⚪ Swing Structure
The indicator builds its foundation by detecting swing highs and lows using a configurable Swing Detection Window. Each confirmed swing is stored with its price, time, bar index, and direction. If two consecutive swings share the same direction, only the more extreme one is kept. This produces a clean structural sequence that removes noise and keeps only meaningful turning points.
⚪ Accumulation vs Distribution Pattern Logic
Using the refined swing sequence, the script looks for staircase-style formations that signal shifts in control:
Accumulation (bottoming): higher lows combined with compressing highs.
Distribution (topping): lower highs combined with compressing lows.
Two detection modes are available:
Quick for compact 4-swing formations
Slow for broader 6-swing structures
When a full structural pattern completes, the indicator marks the zone and resets the swing buffer for the next formation.
⚪ Volume Profile Construction
The price range between the zone’s upper and lower boundary is divided into several Rows. For every bar within the zone’s swing range, the bar’s volume is added to the appropriate price row.
Volume is classified as:
Bullish volume when close > open
Bearish volume when close < open
Each row is drawn as two horizontal segments (bull and bear), colored with smooth gradients based on your bull/bear color settings. This creates a compact profile that reveals where trading activity is concentrated inside the zone and whether buyers or sellers dominate those price levels.
█ How to Use
The indicator is designed to provide context and confluence, not raw buy/sell signals.
⚪ Spot Fresh Accumulation & Distribution
Use newly printed zones as a map of where the market has recently:
Absorbed selling and formed a floor (Accumulation below price).
Absorbed buying and formed a cap (Distribution above price).
In a trending environment, fresh accumulation zones below price are often areas to watch for pullbacks, while distribution zones above price can act as sell zones or targets.
⚪ Volume Profile
Longer horizontal bars show where the market traded the most volume inside the zone.
Bull-leaning rows inside an accumulation zone often signal strong buying interest during the formation.
Bear-leaning rows inside a distribution zone highlight concentrated selling pressure.
By combining this volume distribution with the zone label and the broader trend context, you can judge whether the structure is more likely to hold, break, or retest as the price approaches it again.
⚪ POC (Point of Control) Trading
Extended POC zones (Regular or Faded) can be treated as dynamic support/resistance rails:
When price revisits a prior accumulation POC and rejects it from above, the level may act as support. When price retests a distribution POC from below and fails to break through, it can act as resistance.
⚪ Combine with Your Own Strategy
The script does not decide direction for you. You get the most value by combining it with:
Your own trend filters (moving averages, higher timeframe structure, volatility measures).
Your preferred entry models (reversal candles, momentum breaks, liquidity grabs, etc.).
Higher-timeframe mapping.
Think of this tool as a map of where the market did meaningful business. You decide how to trade around those areas.
█ Settings
Acc/Dist Ranges – Master switch for drawing all Accumulation and Distribution zones. Turn this off to temporarily hide boxes while leaving supporting logic active.
Pattern – Shows or hides the swing-based pattern outline that formed each zone. Good for structural debugging and education.
Pattern Sensitivity
Quick – more responsive, detects smaller compact structures.
Slow – stricter, focuses on wider and more established zones.
Swing Detection Window – Pivot width used to confirm swing highs and lows. Larger values filter noise and produce bigger zones; smaller values pick up more minor structures.
Volume Profile – Enables the embedded volume profile inside each zone.
Rows – Number of price slices used to aggregate volume in the zone. Higher values give more detail but increase visual density.
Switch Order – Flips the horizontal order of bull vs bear volume segments within each row.
Extend Zones – Behaviour of POC and zone extension:
None – No forward extension.
Faded Zones – Store and draw up to four past POC zones as faded horizontal levels.
Regular Zones – Extend POC boxes forward until price breaks out.
-----------------
Disclaimer
The content provided in my scripts, indicators, ideas, algorithms, and systems is for educational and informational purposes only. It does not constitute financial advice, investment recommendations, or a solicitation to buy or sell any financial instruments. I will not accept liability for any loss or damage, including without limitation any loss of profit, which may arise directly or indirectly from the use of or reliance on such information.
All investments involve risk, and the past performance of a security, industry, sector, market, financial product, trading strategy, backtest, or individual's trading does not guarantee future results or returns. Investors are fully responsible for any investment decisions they make. Such decisions should be based solely on an evaluation of their financial circumstances, investment objectives, risk tolerance, and liquidity needs.

Momentum + Volume Percentile
This advanced momentum indicator combines smoothed momentum analysis with percentile-based volume filtering to identify high-quality trading opportunities backed by significant market participation.
How It Works:
The indicator calculates momentum (rate of change) over a customizable period and applies multiple smoothing techniques to reduce noise. It then filters price action by highlighting only periods where volume exceeds a specified percentile threshold.
The algorithm:
Calculates raw momentum based on price changes over the specified period
Applies customizable smoothing (SMA, EMA, WMA, or HMA) to the momentum values
Computes a moving average of the smoothed momentum as a trend reference
Analyzes volume over a lookback period to establish percentile rankings
Highlights candles where volume exceeds the percentile threshold with color-coded backgrounds
Distinguishes between bullish (green) and bearish (red) high-volume events

Pso VP 2.0This indicator provides an advanced volume analysis tool that visualizes trading activity across different price levels and automatically identifies key support and resistance zones.
How It Works:
The Volume Profile analyzes historical price and volume data within a specified lookback period, distributing volume across horizontal price levels. Unlike traditional volume indicators that show volume over time, this tool displays volume at price, revealing where the most significant trading activity has occurred.
The algorithm:
Divides the price range into customizable horizontal bars (bins)
Calculates and accumulates volume for each price level
Identifies high-volume nodes that often act as support or resistance levels
Uses percentile filtering to highlight the most significant trading areas
Key Features:
Automatic S/R Detection: Uses volume percentile filtering to identify the most significant price levels
Dynamic Support/Resistance Lines: Automatically draws horizontal black lines at high-volume areas that typically act as price magnets or barriers
Customizable Parameters: Full control over lookback period, number of price bars, percentile thresholds, profile width, opacity, and line projections
Clean Aesthetic: Monochrome design for professional chart presentation

DeltaFlow Volume Dr.Ryan [Beluga Port]This is a delta volume profile copy I have made for tracking volume flow.