XBT Weekend Trade StrategyUsing Friday's GXBT close price do the following:
- Go short when price rises above 4.5%
- Go long when price falls below 4.5%
- Close all orders when profits reach threshold (default 3%)
- Close all orders start of Monday
Default leverage is 1x
Zmienność


GetTrendStrategy FastGetTrendStrategy but much much much faster, and much more productive.
Works perfect on 1m charts
(YaroslavG)

SD_Bull_Bear_Engulfing_Rsi_SdThis strategy combines the idea of a bullish or bearish candle engulfing coupled with standard deviation (a 100% increase or a 50% decrease). The exit condition is placed if the percentage increase is achieved or 35<rsi<65.
The strategy requires refinement so please test the script and let know what can be incorporated to improve the efficiency.

Noro's Bollinger Strategy v1.0Bollinger Bands only
Piramiding!!!
For:
- any crypto
- timeframe: 1min, 3min, 5min, 15min, 30min, 1h, 2h

Donchian Channel Width Strategy The Donchian Channel was developed by Richard Donchian and it could be compared
to the Bollinger Bands. When it comes to volatility analysis, the Donchian Channel
Width was created in the same way as the Bollinger Bandwidth technical indicator was.
You can change long to short in the Input Settings
WARNING:
- For purpose educate only
- This script to change bars colors.


Volume & Intraday ScriptI am still learning pinescript, and part of this was created using the Pine Script language reference manual. This includes looking at the time series, a fixed length, and the default intraday_loss variables. This also includes the basic fixed lengths for an swma (Symmetrically weighted moving average) and the script to start creating a strategy. All in all this is just a basic sample of pinescript that you can customize for your trading needs. This can work with Cryptocurrency but these moving averages usually work more efficiently for forex.
Default Strategy Inputs (Forex / Crypto)The code in this post contains a set of default strategy inputs I use in new projects / backtests in Tradingview.
Full code commentary is available on the Backtest-Rookies website. To comply with house rules, I cannot post the direct link here.
Features
Trade Direction: So that you can limit the strategy for long only, short only or trade in both directions. It is important to note that when you select “Long Only”, you will still see Short signals on the chart. However, they are only used to close a position rather than reverse it. This is the default behaviour for strategies. The same applies to “Short Only”.
Date Ranges: So that you can isolate backtesting to specific periods of interest such as bull or bear markets.
Sessions: So you can easily get an idea of the expected results during your own session. You may also notice that performance of the strategy varies depending on which session it is deployed in.
Some example stop losses: It is not an exhaustive list but it should be enough to provide some inspiration for different types of stops that you can experiment with.
Happy Scripting. I hope the community finds it useful.
Statistical Volatility - Extreme Value Method Backtest This indicator used to calculate the statistical volatility, sometime
called historical volatility, based on the Extreme Value Method.
Please use this link to get more information about Volatility.
You can change long to short in the Input Settings
WARNING:
- For purpose educate only
- This script to change bars colors.

Bollinger + RSI, Double Strategy Long-Only (by ChartArt) v1.2This strategy uses the RSI indicator together with the Bollinger Bands to go long when the price is below the lower Bollinger Band (and to close the long trade when this value is above the upper Bollinger band).
This simple strategy only places a long, when both the RSI and the Bollinger Bands indicators are at the same time in a oversold condition.
In this new version 1.2 the strategy was simplified even more than before by going long-only, which made the strategy more successful in backtesting than the previous version (that older version also opened short trades).
This strategy does not repaint and was updated to PineScript version 3.
All trading involves high risk; past performance is not necessarily indicative of future results. Hypothetical or simulated performance results have certain inherent limitations. Unlike an actual performance record, simulated results do not represent actual trading. Also, since the trades have not actually been executed, the results may have under- or over-compensated for the impact, if any, of certain market factors, such as lack of liquidity. Simulated trading programs in general are also subject to the fact that they are designed with the benefit of hindsight. No representation is being made that any account will or is likely to achieve profits or losses similar to those shown.
P.S. For advanced users: If you want also be able to short with the same strategy approach, then please use my older version 1.1:

Moving Average Cross and/or Bbands botHello TradingView and world!
This is one of our latest concepts for an actual bot builder. This script comes with a bunch of features that we're hoping will alleviate a lot of the stress and confusion around using and building strategies here on TV. Especially if the end-goal is to automate the strategies using Autoview.
This is a combination of 2 strategies, and gives you full control of each component within the script.
The 2 strategies are:
2 Moving Averages == if close is greater than moving average and moving average 1 is greater than moving average 2
Bolling Bands == if close is less than lower or greater than upper
Features / Settings included :
- Ability to change settings from a commodity market (default) to an altcoin or forex market.
- Backtest time period selector component
- Heiken Ashi Candles on/off
- Moving Average Strategy on/off
- Bollinger Bands Strategy on/off
- Both Moving Average settings can be adjusted
- Bollinger Bands length and multiplier can be adjusted.
- Pyramiding Greater Than, Equal To, or Less Than
- Trailing Stop with the ability to set a price in which the Trailing Stop activate
- Take Profit on/off and editable
- Stop Loss on/off and editable
- Margin Call on/off dependent on Leverage which is editable
- If pyramiding is used, the strategy will calculate and display your average on the chart
- Profit and Loss visuals added to the chart
You can watch a video here on how all the settings can be used and work together.
www.youtube.com
You can learn more about Autoview here:
autoview.with.pink
Get your invite and join us in slack here:
slack.with.pink

Volatility Finite Volume Elements Backtest This version has an important enhancement to the previous one that`s
especially useful with intraday minute charts.
Due to the volatility had not been taken into account to avoid the extra
complication in the formula, the previous formula has some drawbacks:
The main drawback is that the constant cutoff coefficient will overestimate
price changes in minute charts and underestimate corresponding changes in
weekly or monthly charts.
And now the indicator uses adaptive cutoff coefficient which will adjust to
all time frames automatically.
You can change long to short in the Input Settings
Please, use it only for learning or paper trading. Do not for real trading.
Another Millionaire toolBack with another Millionaire tool script, put like a solid 12 minutes here curve fitting the moving averages. THIS WILL MAKE YOU A MILLIONAIRE. It is so easy, it makes one of the hardest industries very very easy. Works on any market. I'VE DECIDED TO SHARE THE SCRIPT AND MAKE IT PUBLIC SO WE CAN ALL BE RICH TOGETHER, MILLIONAIRES

[STRATEGY][RS]Open Session Breakout TraderEXPERIMENTAL: use at your own discretion.
custom session breakout strategy, it uses a percentage of daily atr to set breakout limits. strategy only viable for intraday timeframes and is suggested under 1hour.

Historical Volatility Strategy Backtest Strategy buy when HVol above BuyBand and close position when HVol below CloseBand.
Markets oscillate from periods of low volatility to high volatility
and back. The author`s research indicates that after periods of
extremely low volatility, volatility tends to increase and price
may move sharply. This increase in volatility tends to correlate
with the beginning of short- to intermediate-term moves in price.
They have found that we can identify which markets are about to make
such a move by measuring the historical volatility and the application
of pattern recognition.
The indicator is calculating as the standard deviation of day-to-day
logarithmic closing price changes expressed as an annualized percentage.
Please, use it only for learning or paper trading. Do not for real trading.

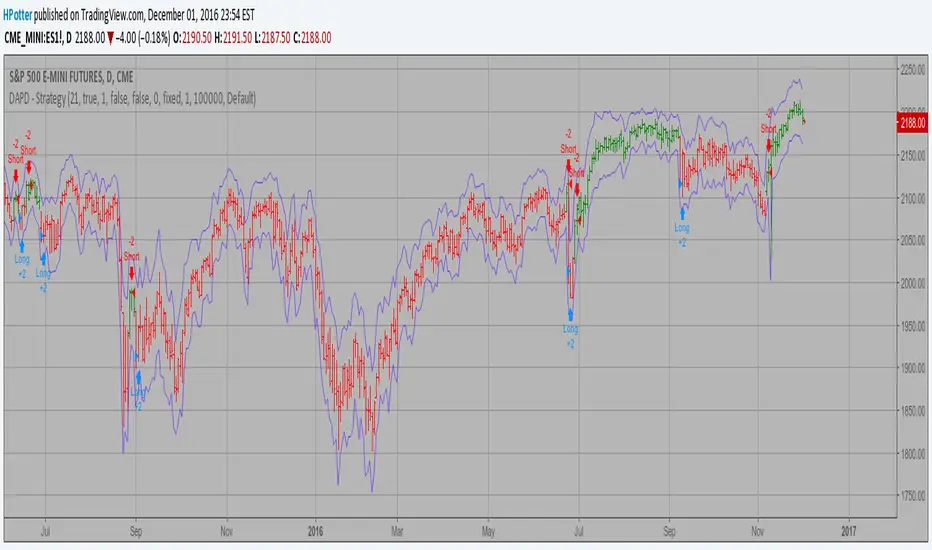
DAPD - Strategy Backtest This indicator is similar to Bollinger Bands. It based on DAPD - Daily
Average Price Delta. DAPD is based upon a summation for each of the
highs (hod) for the 21 days prior to today minus the summation for
each of the lows (lod) for the last 21 days prior to today. The result
of this calculation would then be divided by 21.
It will be buy when high above previos DAPD high and sell if low below previos DAPD low
You can change long to short in the Input Settings
Please, use it only for learning or paper trading. Do not for real trading.
Chaikin Volatility Strategy Backtest Chaikin's Volatility indicator compares the spread between a security's
high and low prices. It quantifies volatility as a widening of the range
between the high and the low price.
You can use in the xPrice1 and xPrice2 any series: Open, High, Low, Close, HL2,
HLC3, OHLC4 and ect...
You can change long to short in the Input Settings
Please, use it only for learning or paper trading. Do not for real trading.

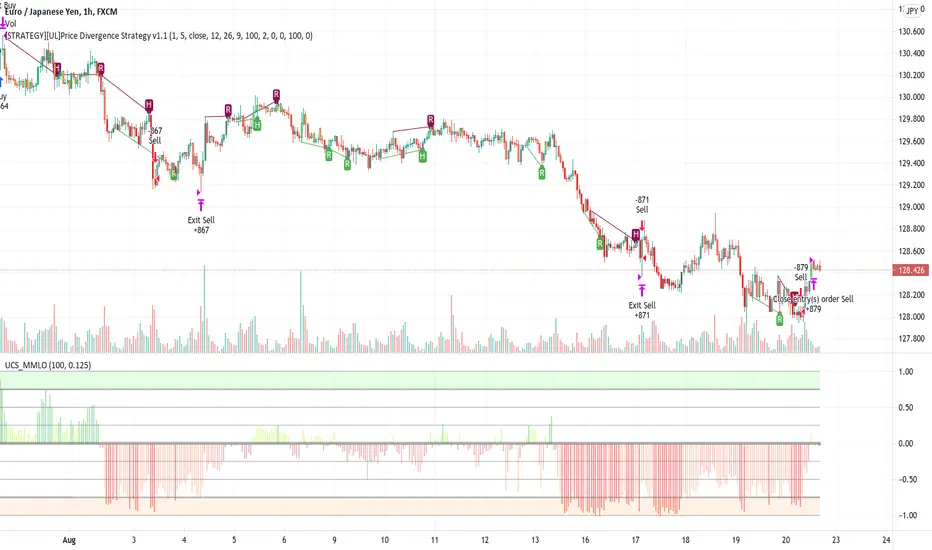
[STRATEGY][UL]Price Divergence Strategy v1.0Created by Request: This is a trend trading strategy that uses Price Divergence detection signals that are confirmed by the "Murrey's Math Oscillator" (Donchanin Channel based).
Strategy Code Based on:
Price Divergence Detector V2 by RicardoSantos
UCS_Murrey's Math Oscillator by Ucsgears
Strategy Risk Management Based on:
Strategy Code Example by JayRogers
Information on Divergence Trading:
- www.babypips.com
*** USE AT YOUR OWN RISK ***
[RichG] Easy MTF Strategy v1.1This is a second attempt at an easy to understand multiple time frame strategy. This one uses ATR for exits. If the position is long, and the price closes below the ATR multiplier, it triggers a close. If the position is short, and the price closes above the ATR/multiplier, it triggers a close. This generates a lot of little trades but is useful because it uses multiple time frames along with cutting losses when the ATR disagrees.
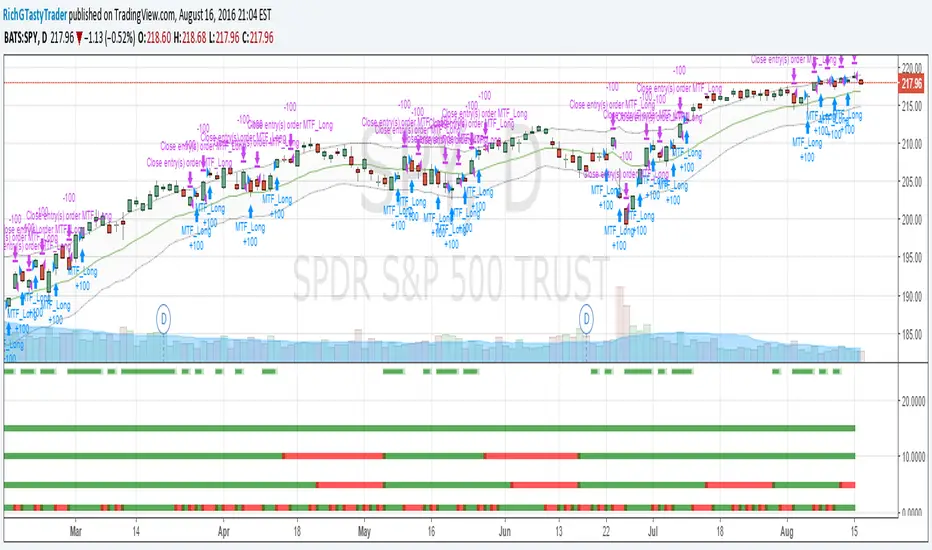
[RichG] Easy MTF StrategyAs we all know, timeframe agreement is a powerful tool. This strategy uses 4 time frames and the Keltner ATR for entries and exits.

GBPNZD ROC RF count strategyCode takes six pairs that are highly correlated to GBPNZD and determines if their ROC's are increasing or decreasing. If a pair has an increasing ROC it is given a 1, if decreasing a -1. The numbers are all added up (this is similar to a count for counting cards in blackjack). If the count goes positive the strategy enters a long position, if negative a short position.
Code is tuned for GBPNZD for 1HR chart. Returns $97 on an initial balance of $100 (if I am reading Tradingview Tester correctly)
*** Should work for GBPJPY, its has the same correlated pairs
Comments welcomed
