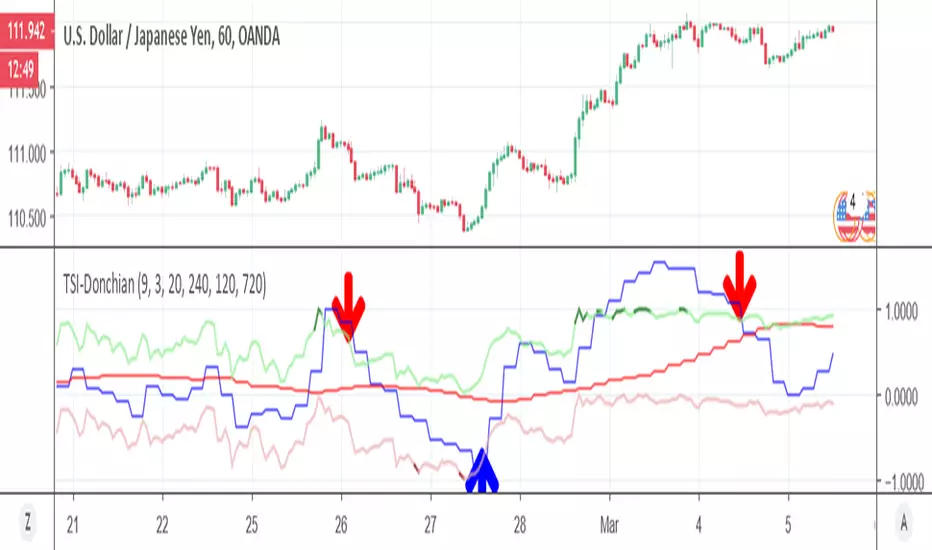
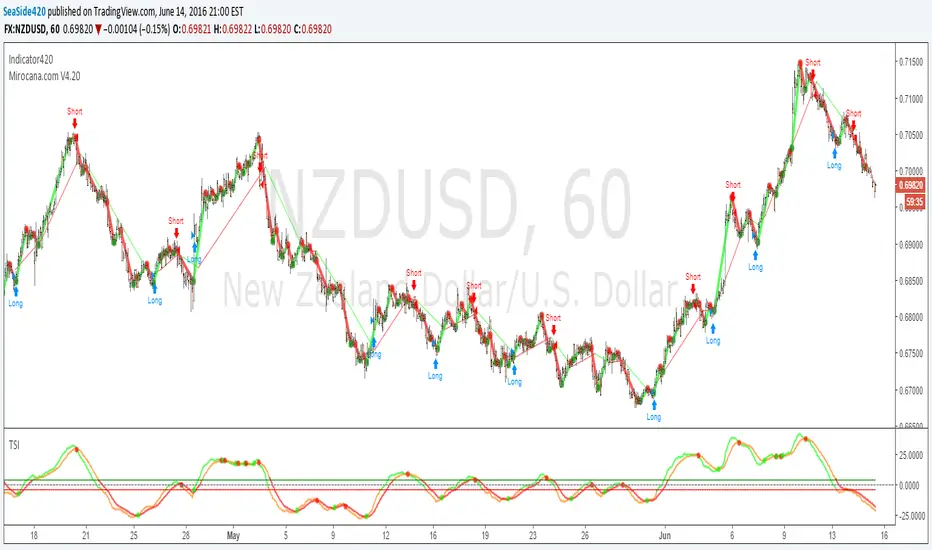
TSI-DonchianHere it a TSI with MTF function , together with Donchian high and low channel
the best entry and exit are shown in arrow
Wskaźnik Prawdziwej Siły (TSI)

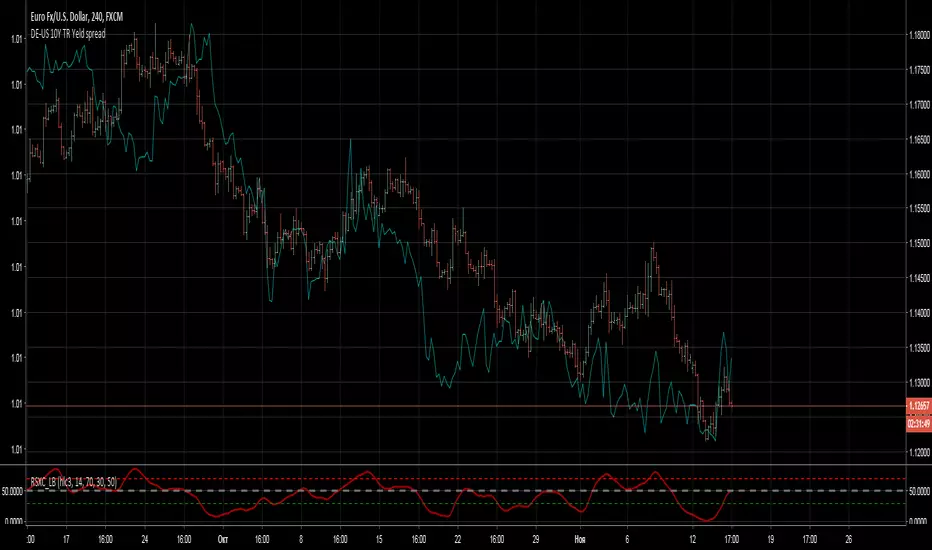
DE and US 10Y bonds spreadDE and US 10Y bonds spread
spread of DE and US 10 year bonds yield
The euro should follow it.
Price Strength Indicator by drnkThis indicator tries to help you conclude bullish or bearing trends by showing
if the price trend is stronger or weaker than short EMA , compared to a long EMA reference which is zero line.
For now please do not use it below 15 min timeframes.

SMI-VIX-SPY-NDX-Index
This script offers an SMI index of VIX, SPY, and NDX. Rather than overlaying VIX, NDX and SPY on the same chart.
It's much easier to see the correlation between VIX's price and NDX / SPY price in this manner.
Thanks to Buckkets & William Blau for the TSI smoothing method.

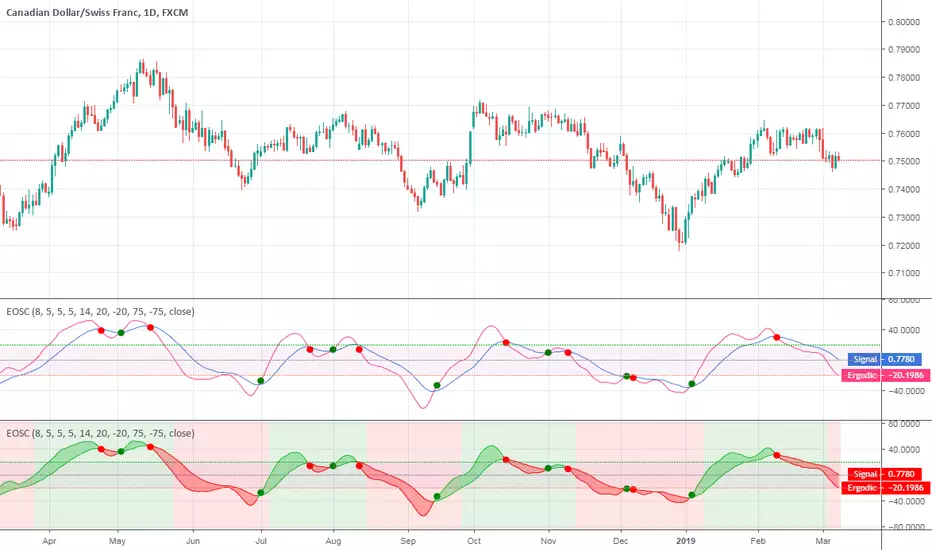
Ergodic OscillatorErgodic Oscillator indicator script.
Ergodic Oscillator is based on True Strength Index (TSI) by William Blau.
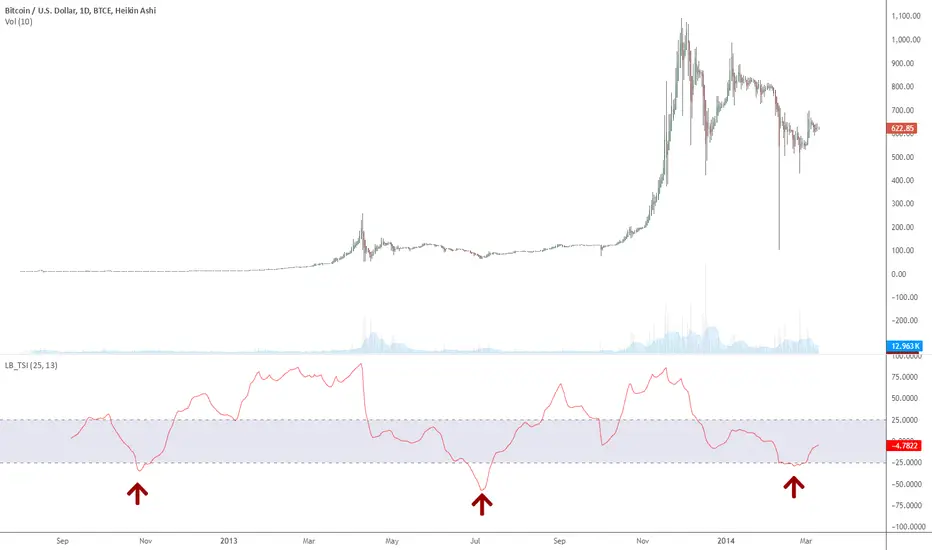
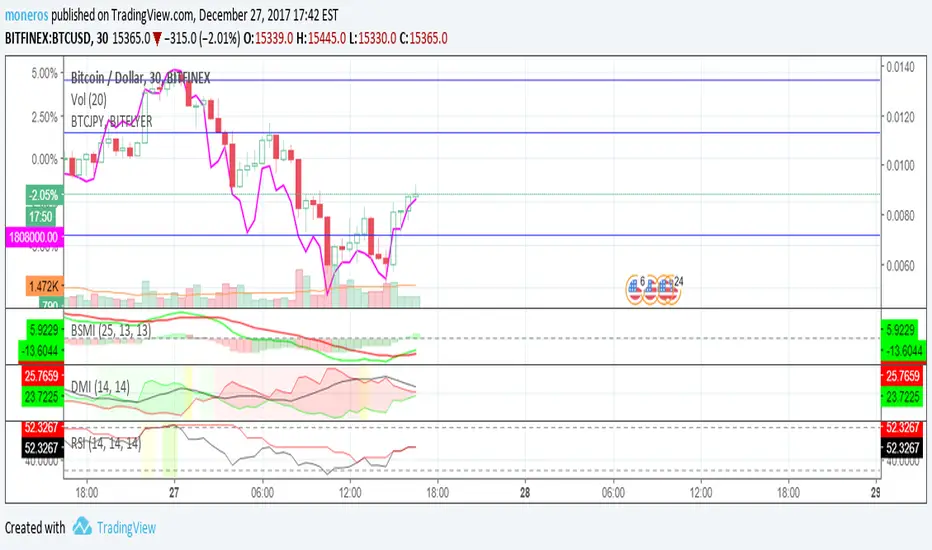
Bitcoin Momentum TSIChart based on True Strength Indicator
It was improved to show same information as Squeeze Momentum Indicator by LazyBear,
but it seems to have better and quicker response to changes and was tested on Bitcoin mainly.
Enjoy it!
BITFINEX:BTCUSD

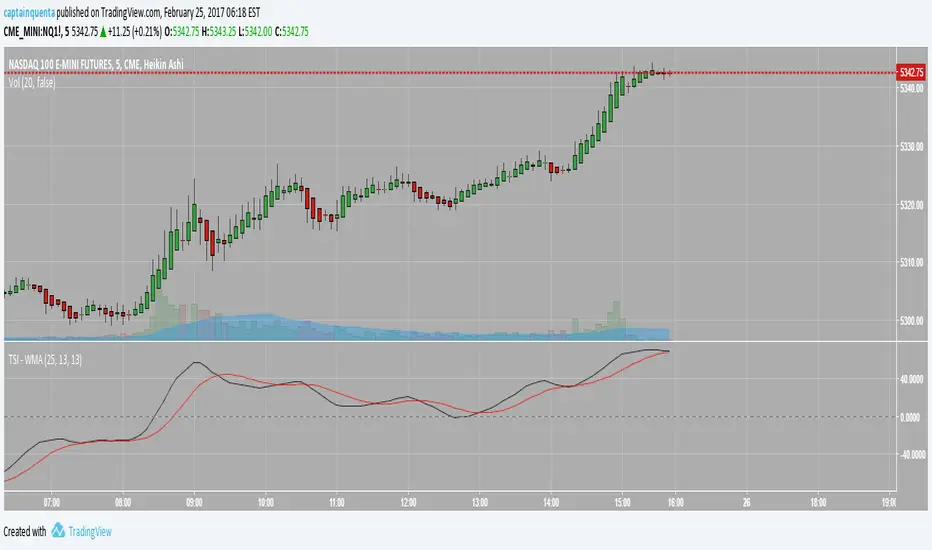
True Strength Indicator - WMAThis is the base Tradingview TSI indicator but with the WMA (weighted moving average) versus the base EMA. CME_MINI:ES1! CME_MINI:NQ1! CBOT_MINI:YM1! CME:E61!
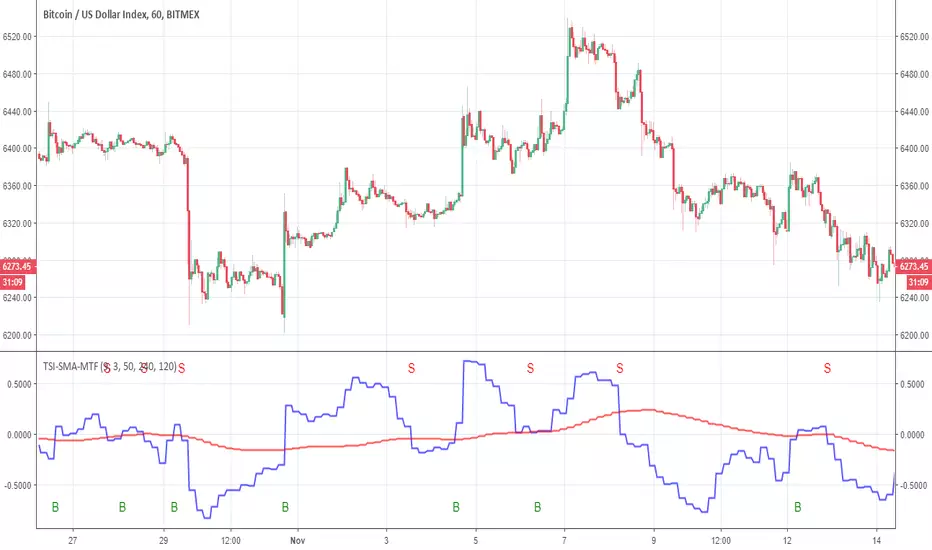
True Strength Indicator MTFHere is an example of a script showing a multi-time frame of TSI.
Chart below compares FX EURUSD Daily TSI to 1H TSI
Here is an updated version
study("True Strength Indicator MTF", shorttitle="TSI MTF")
resCustom = input(title="Timeframe", type=resolution, defval="60" )
long = input(title="Long Length", type=integer, defval=25)
short = input(title="Short Length", type=integer, defval=13)
signal = input(title="Signal Length", type=integer, defval=13)
price = close
double_smooth(src, long, short) =>
fist_smooth = ema(src, long)
ema(fist_smooth, short)
pc = change(price)
double_smoothed_pc = double_smooth(pc, long, short)
double_smoothed_abs_pc = double_smooth(abs(pc), long, short)
tsi_value = 100 * (double_smoothed_pc / double_smoothed_abs_pc)
tsi = security(tickerid, resCustom,tsi_value)
plot(tsi, color=black)
plot(ema(tsi, signal), color=red)
hline(0, title="Zero")

Indicator: True Strength IndexTSI is a "double smoothed" indicator. It is used just like RSI. Overbought and oversold levels differ. They are marked by the indicator.
BTCe shows only 3 oversold conditions so far, the last one being just days ago.