Daily Price RangeThe indicator is designed to analyze an instrument’s volatility based on daily extremes (High-Low) and to compare the current day’s range with the typical (median) range over a selected period. This helps traders assess how much of the "usual" daily movement has already occurred and how much may still be possible during the trading day.
TRUE

Custom ATR Trailing StopThis Script creates a custom ATR (Average True Range) trailing stop. It allows traders to set up automated stop-loss levels based on the ATR, which adjusts dynamically to market volatility. The script is designed to support both long and short trades, offering flexibility and precision in trade management.
When loading the indicator to your chart, simply click to set the trade begining time, confirm various settings and you are set.
Check tooltips for more details in the input settigns menu.
User Inputs
Trade Setup: Allows users to set the trade direction (Long or Short), the signal source for entries, and the specific bar time for the trade setup.
ATR Settings: Configurable ATR lookback period, ATR smoothing period, initial ATR multiplier for setting the stop-loss, breakeven ATR multiplier, and a manual breakeven level.
ATR Calculations
Computes the ATR and its moving average.
Determines initial and breakeven stop levels based on the ATR.
Signal Validation
Validates long or short trade signals based on the specified bar time and trade direction.
Triggers alerts when a valid trade signal is detected.
Trailing Stop Logic
For long trades, adjusts the stop-loss level dynamically based on the ATR.
For short trades, performs similar adjustments in the opposite direction.
Updates the trailing stop level to ensure it follows the price, moving closer as the price moves favorably.
Resets the trade state when the stop-loss is hit, triggering an alert.
Plotting
Plots the trailing stop levels on the chart.
Uses green for stop levels indicating profit and red for stop levels indicating a loss.

ATR Gerchik LightAverage True Range ( ATR ) is a technical analysis indicator that measures volatility in the market. ATR is a moving average of the true range over a period of time.
ATR calculation procedure:
1. Determine the true maximum - this is the highest of the current maximum and yesterday's closing price of the day.
2. Determine the true minimum - this is the smallest of the current minimum and yesterday's closing price.
3. Determine the true range - this is the distance between the true maximum and minimum.
4. We exclude extremely large candles (> x2 ATR) and extremely small ones (< 0.5 ATR) from the obtained true ranges.
5. We calculate the average for the selected period based on the remaining range.
6. We calculate the percentage of the current True Range relative to the average ATR value for the previous period.
Description:
If you analyze it yourself, you will see that 75-80% of the time, the instrument moves only 1 ATR per day. You must understand that if an instrument has, for example, moved 80% of its daily range, it is not advisable to purchase it. This is comparable to a car's fuel tank: if the tank is almost empty, the car won't go far. Most indicators that calculate ATR include anomalous candles, which give unreliable results and lead to incorrect decisions. Because of this, many traders prefer to calculate ATR on their own.
However, the Gerchik ATR indicator accounts for anomalous candles and filters out extremely large candles (> 2x ATR) and extremely small ones (< 0.5x ATR). Additionally, this indicator immediately shows the consumed “fuel” of the instrument as a percentage, so you don't have to calculate the distance traveled yourself. This allows you to make quick, informed decisions. If we see that the tank is almost empty, it is logical not to get into that car today. When building any strategy, you must rely on the average movement.
Key Features:
Anomalous Candle Filtering: Excludes extremely large and small candles to provide more reliable ATR values.
Consumed Fuel Indicator: Shows the percentage of the ATR consumed, helping traders quickly assess the remaining potential movement.
Daily Timeframe Focus: Designed specifically for use on daily charts for accurate long-term analysis.
Practical Applications:
Entry and Exit Points: Use the ATR to determine optimal entry and exit points by assessing market volatility and potential price movement.
Stop-Loss Placement: Calculate stop-loss levels based on ATR to ensure they are placed at appropriate distances, accounting for current market volatility.
Trend Confirmation: Use the percentage of ATR consumed to confirm the strength of a trend and decide whether to enter or exit trades.
Examples of Use:
Trend Following: During strong trends, ATR helps identify periods of increased volatility, signaling potential breakouts or reversals.
Range Trading: In ranging markets, ATR can highlight periods of low volatility, indicating consolidation and potential breakout zones.
Note: The indicator is displayed and works only on the daily timeframe!
The indicator was created according to the instructions, description of the functionality, and strategy of Mr. Gerchik. Thank you so much, Chief!
________________________
Average True Range ( ATR , средний истинный диапазон) – это индикатор технического анализа, который измеряет волатильность на рынке. ATR представляет собой скользящее среднее истинного диапазона за определенный период времени.
Порядок расчета ATR:
1. Определяем истинный максимум – это наивысшее из текущего максимума и вчерашней цены закрытия дня.
2. Определяем истинный минимум – это наименьшее из текущего минимума и вчерашней цены закрытия.
3. Определяем истинный диапазон – это расстояние между истинным максимумом и минимумом.
4. Исключаем из полученных истинных диапазонов экстремально большие свечи (> x2 ATR) и экстремально маленькие (< 0.5 ATR).
5. Рассчитываем среднее за выбранный период исходя из оставшегося диапазона.
6 . Рассчитываем процент текущего истинного диапазона (True Range) относительно среднего значения ATR за предыдущий период.
Описание:
Если вы сами проанализируете, то увидите, что 75-80% времени инструмент ходит только 1 ATR. И вы должны понимать, что если инструмент внутри дня прошел, к примеру, 80% своего движения, то этот инструмент больше нельзя покупать. Это можно сравнить с баком машины: если бак почти пустой, машина далеко не уедет. Большинство индикаторов, которые рассчитывают ATR, производят расчет с паранормальными свечами. Это дает недостоверный результат и приводит к неверным решениям. Многие трейдеры из-за этого не используют готовые индикаторы и предпочитают считать ATR самостоятельно. Но индикатор ATR Gerchik учитывает паранормальные свечи и фильтрует экстремально большие свечи (> x2 ATR) и экстремально маленькие (< 0.5 ATR). Также этот индикатор сразу показывает израсходованный "бензин" инструмента в процентах. И вам не надо самостоятельно высчитывать пройденный путь. Вы можете быстро принимать правильные решения. Если мы видим, что бак почти пустой, логично не садиться в эту машину сегодня. Когда вы строите какую-то стратегию, вы должны обязательно полагаться на среднестатистическое движение.
Существует много стратегий, завязанных на ATR, которые учитывают волатильность инструмента, запас хода, точки разворота, места выставления стоп-лоссов (SL) и тейк-профитов (TP) и другие факторы. Я не буду останавливаться на них, так как каждый может найти описание этих стратегий и использовать их на свой выбор.
Индикатор отображается и работает только на дневном таймфрейме!
Индикатор создан по наставлениям, описанию функционала и стратегии господина Герчика. Огромное спасибо, Шеф!

[TTI] MarketSmith & IBD Style Model Stock Quarters 📜 ––––HISTORY & CREDITS––––
The MarketSmith & IBD Style Model Stock Quarters another Utility indicator is an original creation by TintinTrading inspired by Investor's Business Daily and William O'Neil style of presenting information. While going through the Model Stocks that IBD has been publishing, I realized that I wanted to see the exam same Quarterly presentation on the time axis in order to compare William O'Neil notes better with my own notes from Tradingview. The script is simple and could help you if you study the CANSLIM methodology.
🦄 –––UNIQUENESS–––
The distinctiveness of this indicator lies in its ability to visually delineate stock quarters directly on the price chart. It serves as a handy tool for traders who adopt a quarterly review of stock performance, in line with MarketSmith and IBD's analysis frameworks.
🛠️ ––––WHAT IT DOES––––
Quarter Marking : Draws a black line at the beginning of each financial quarter (January, April, July, and October).
Quarter Labeling : Places a label at the close of the last month in a quarter, indicating the upcoming quarter with its abbreviation and the last two digits of the year.
💡 ––––HOW TO USE IT––––
👉Installation: Add the indicator to your TradingView chart by searching for " MarketSmith & IBD Style Model Stock Quarters" in the indicator library.
👉Add to New Pane and squash the Pane Length: I add the indicator to a new pane under the price and volume charts and squash the height of the pane so that it looks exactly like the MarketSmith visuals.
👉Visual Cues:
Look for the black lines marking the start of a new quarter.
Observe the labels indicating the upcoming quarter and year, positioned at the close of the last month in a quarter.
👉Interpretation: Use these quarterly markers to align your trading strategies with quarterly performance metrics or to conduct seasonal analysis.
👉Settings: The indicator does not require any user-defined settings, making it straightforward to use.

Average True Range Trailing Mean [Alifer]Upgrade of the Average True Range default indicator by TradingView. It adds and plots a trailing mean to show periods of increased volatility more clearly.
ATR TRAILING MEAN
A trailing mean, also known as a moving average, is a statistical calculation used to smooth out data over time and identify trends or patterns in a time series.
In our indicator, it clearly shows when the ATR value spikes outside of it's average range, making it easier to identify periods of increased volatility.
Here's how the ATR Trailing Mean (atr_mean) is calculated:
atr_mean = ta.cum(atr) / (bar_index + 1) * atr_mult
The ta.cum() function calculates the cumulative sum of the ATR over all bars up to the current bar.
(bar_index + 1) represents the number of bars processed up to the current bar, including the current one.
By dividing the cumulative ATR ta.cum(atr) by (bar_index + 1) and then multiplying it by atr_mult (Multiplier), we obtain the ATR Trailing Mean value.
If atr_mult is set to 1.0, the ATR Trailing Mean will be equal to the simple average of the ATR values, and it will follow the ATR's general trend.
However, if atr_mult is increased, the ATR Trailing Mean will react more strongly to the ATR's recent changes, making it more sensitive to short-term fluctuations.
On the other hand, reducing atr_mult will make the ATR Trailing Mean less responsive to recent changes in ATR, making it smoother and less prone to reacting to short-term volatility.
In summary, adjusting the atr_mult input allows traders to fine-tune the ATR Trailing Mean's responsiveness based on their preferred level of sensitivity to recent changes in market volatility.
IMPLEMENTATION IN A STRATEGY
You can easily implement this indicator in an existing strategy, to only enter positions when the ATR is above the ATR Trailing Mean (with Multiplier-adjusted sensitivity). To do so, add the following lines of codes.
Under Inputs:
length = input.int(title="Length", defval=20, minval=1)
atr_mult = input.float(defval=1.0, step = 0.1, title = "Multiplier", tooltip = "Adjust the sensitivity of the ATR Trailing Mean line.")
smoothing = input.string(title="Smoothing", defval="RMA", options= )
ma_function(source, length) =>
switch smoothing
"RMA" => ta.rma(source, length)
"SMA" => ta.sma(source, length)
"EMA" => ta.ema(source, length)
=> ta.wma(source, length)
This will allow you to define the Length of the ATR (lookback length over which the ATR is calculated), the Multiplier to adjust the Trailing Mean's sensitivity and the type of Smoothing to be used for the ATR.
Under Calculations:
atr= ma_function(ta.tr(true), length)
atr_mean = ta.cum(atr) / (bar_index+1) * atr_mult
This will calculate the ATR based on Length and Smoothing, and the resulting ATR Trailing Mean.
Under Entry Conditions, add the following to your existing conditions:
and atr > atr_mean
This will make it so that entries are only triggered when the ATR is above the ATR Trailing Mean (adjusted by the Multiplier value you defined earlier).
ATR - DEFINITION AND HISTORY
The Average True Range (ATR) is a technical indicator used to measure market volatility, regardless of the direction of the price. It was developed by J. Welles Wilder and introduced in his book "New Concepts in Technical Trading Systems" in 1978. ATR provides valuable insights into the degree of price movement or volatility experienced by a financial asset, such as a stock, currency pair, commodity, or cryptocurrency, over a specific period.
ATR - CALCULATION AND USAGE
The ATR calculation involves three components:
1 — True Range (TR): The True Range is a measure of the asset's price movement for a given period. It takes into account the following factors:
The difference between the high and low prices of the current period.
The absolute value of the difference between the high price of the current period and the closing price of the previous period.
The absolute value of the difference between the low price of the current period and the closing price of the previous period.
Mathematically, the True Range (TR) for the current period is calculated as follows:
TR = max(high - low, abs(high - previous_close), abs(low - previous_close))
2 — ATR Calculation: The ATR is calculated as a Moving Average (MA) of the True Range over a specified period.
The ATR is calculated as follows:
ATR = MA(TR, length)
3 — ATR Interpretation: The ATR value represents the average volatility of the asset over the chosen period. Higher ATR values indicate higher volatility, while lower ATR values suggest lower volatility.
Traders and investors can use ATR in various ways:
Setting Stop Loss and Take Profit Levels: ATR can help determine appropriate stop-loss and take-profit levels in trading strategies. A larger ATR value might require wider stop-loss levels to allow for the asset's natural price fluctuations, while a smaller ATR value might allow for tighter stop-loss levels.
Identifying Market Volatility: A sharp increase in ATR might indicate heightened market uncertainty or the potential for significant price movements. Conversely, a decreasing ATR might suggest a period of low volatility and possible consolidation.
Comparing Volatility Between Assets: Since ATR uses absolute values, it shouldn't be used to compare volatility between different assets, as assets with higher prices will consistently have higher ATR values, while assets with lower prices will consistently have lower ATR values. However, the addition of a trailing mean makes such a comparison possible. An asset whose ATR is consistently close to its ATR Trailing Mean will have a lower volatility than an asset whose ATR continuously moves far above and below its ATR Trailing Mean. This can help traders and investors decide which markets to trade based on their risk tolerance and trading strategies.
Determining Position Size: ATR can be used to adjust position sizes, taking into account the asset's volatility. Smaller position sizes might be appropriate for more volatile assets to manage risk effectively.

SuperTrend with Chebyshev FilterModified Super Trend with Chebyshev Filter
The Modified Super Trend is an innovative take on the classic Super Trend indicator. This advanced version incorporates a Chebyshev filter, which significantly enhances its capabilities by reducing false signals and improving overall signal quality. In this post, we'll dive deep into the Modified Super Trend, exploring its history, the benefits of the Chebyshev filter, and how it effectively addresses the challenges associated with smoothing, delay, and noise.
History of the Super Trend
The Super Trend indicator, developed by Olivier Seban, has been a popular tool among traders since its inception. It helps traders identify market trends and potential entry and exit points. The Super Trend uses average true range (ATR) and a multiplier to create a volatility-based trailing stop, providing traders with a dynamic tool that adapts to changing market conditions. However, the original Super Trend has its limitations, such as the tendency to produce false signals during periods of low volatility or sideways trading.
The Chebyshev Filter
The Chebyshev filter is a powerful mathematical tool that makes an excellent addition to the Super Trend indicator. It effectively addresses the issues of smoothing, delay, and noise associated with traditional moving averages. Chebyshev filters are named after Pafnuty Chebyshev, a renowned Russian mathematician who made significant contributions to the field of approximation theory.
The Chebyshev filter is capable of producing smoother, more responsive moving averages without introducing additional lag. This is possible because the filter minimizes the worst-case error between the ideal and the actual frequency response. There are two types of Chebyshev filters: Type I and Type II. Type I Chebyshev filters are designed to have an equiripple response in the passband, while Type II Chebyshev filters have an equiripple response in the stopband. The Modified Super Trend allows users to choose between these two types based on their preferences.
Overcoming the Challenges
The Modified Super Trend addresses several challenges associated with the original Super Trend:
Smoothing: The Chebyshev filter produces a smoother moving average without introducing additional lag. This feature is particularly beneficial during periods of low volatility or sideways trading, as it reduces the number of false signals.
Delay: The Chebyshev filter helps minimize the delay between price action and the generated signal, allowing traders to make timely decisions based on more accurate information.
Noise Reduction: The Chebyshev filter's ability to minimize the worst-case error between the ideal and actual frequency response reduces the impact of noise on the generated signals. This feature is especially useful when using the true range as an offset for the price, as it helps generate more reliable signals within a reasonable time frame.
The Great Replacement
The Modified Super Trend with Chebyshev filter is an excellent replacement for the original Super Trend indicator. It offers significant improvements in terms of signal quality, responsiveness, and accuracy. By incorporating the Chebyshev filter, the Modified Super Trend effectively reduces the number of false signals during low volatility or sideways trading, making it a more reliable tool for identifying market trends and potential entry and exit points.
In-Depth Guide to the Modified Super Trend Settings
The Modified Super Trend with Chebyshev filter offers a wide range of settings that allow traders to fine-tune the indicator to suit their specific trading styles and objectives. In this section, we will discuss each setting in detail, explaining its purpose and how to use it effectively.
Source
The source setting determines the price data used for calculations. The default setting is hl2, which calculates the average of the high and low prices. You can choose other price data sources such as close, open, or ohlc4 (average of open, high, low, and close prices) based on your preference.
Up Color and Down Color
These settings control the color of the trend line when the market is in an uptrend (up_color) and a downtrend (down_color). You can customize these colors to your liking, making it easier to visually identify the current market trend.
Text Color
This setting controls the color of the text displayed on the chart when using labels to indicate trend changes. You can choose any color that contrasts well with your chart background for better readability.
Mean Length
The mean_length setting determines the length (number of bars) used for the Chebyshev moving average calculation. A shorter length will make the moving average more responsive to price changes, while a longer length will produce a smoother moving average. It is crucial to find the right balance between responsiveness and smoothness, as a too-short length may generate false signals, while a too-long length might produce lagging signals. The default value is 64, but you can experiment with different values to find the optimal setting for your trading strategy.
Mean Ripple
The mean_ripple setting influences the Chebyshev filter's ripple effect in the passband (Type I) or stopband (Type II). The ripple effect represents small oscillations in the frequency response, which can impact the moving average's smoothness. The default value is 0.01, but you can experiment with different values to find the best balance between smoothness and responsiveness.
Chebyshev Type: Type I or Type II
The style setting allows you to choose between Type I and Type II Chebyshev filters. Type I filters have an equiripple response in the passband, while Type II filters have an equiripple response in the stopband. Depending on your preference for smoothness and responsiveness, you can choose the type that best fits your trading style.
ATR Style
The atr_style setting determines the method used for calculating the Average True Range (ATR). By default (false), it uses the traditional high-low range. When set to true, it uses the absolute difference between the open and close prices. You can choose the method that works best for your trading strategy and the market you are trading.
ATR Length
The atr_length setting controls the length (number of bars) used for calculating the ATR. Similar to the mean_length, a shorter length will make the ATR more responsive to price changes, while a longer length will produce a smoother ATR. The default value is 64, but you can experiment with different values to find the optimal setting for your trading strategy.
ATR Ripple
The atr_ripple setting, like the mean_ripple, influences the ripple effect of the Chebyshev filter used in the ATR calculation. The default value is 0.05, but you can experiment with different values to find the best balance between smoothness and responsiveness.
Multiplier
The multiplier setting determines the factor by which the ATR is multiplied before being added
Super Trend Logic and Signal Optimization
The Modified Super Trend with Chebyshev filter is designed to minimize false signals and provide a clear indication of market trends. It does so by using a combination of moving averages, Average True Range (ATR), and a multiplier. In this section, we will discuss the Super Trend's logic, its ability to prevent false signals, and the early warning crosses added to the indicator.
Super Trend Logic
The Super Trend's logic is based on a combination of the Chebyshev moving average and ATR. The Chebyshev moving average is a smooth moving average that effectively filters out market noise, while the ATR is a measure of market volatility.
The Super Trend is calculated by adding or subtracting a multiple of the ATR from the Chebyshev moving average. The multiplier is a user-defined value that determines the distance between the trend line and the price action. A larger multiplier results in a wider channel, reducing the likelihood of false signals but potentially missing out on valid trend changes.
Preventing False Signals
The Super Trend is designed to minimize false signals by maintaining its trend direction until a significant change in the market occurs. In a downtrend, the trend line will only decrease in value, and in an uptrend, it will only increase. This helps prevent false signals caused by temporary price fluctuations or market noise.
When the price crosses the trend line, the Super Trend does not immediately change its direction. Instead, it employs a safety logic to ensure that the trend change is genuine. The safety logic checks if the new trend line (calculated using the updated moving average and ATR) is more extreme than the previous one. If it is, the trend line is updated; otherwise, the previous trend line is maintained. This mechanism further reduces the likelihood of false signals by ensuring that the trend line only changes when there is a significant shift in the market.
Early Warning Crosses
To provide traders with additional insight, the Modified Super Trend with Chebyshev filter includes early warning crosses. These crosses are plotted on the chart when the price crosses the trend line without the safety logic. Although these crosses do not necessarily indicate a trend change, they can serve as a valuable heads-up for traders to monitor the market closely and prepare for potential trend reversals.
In conclusion, the Modified Super Trend with Chebyshev filter offers a significant improvement over the original Super Trend indicator. By incorporating the Chebyshev filter, this modified version effectively addresses the challenges of smoothing, delay, and noise reduction while minimizing false signals. The wide range of customizable settings allows traders to tailor the indicator to their specific needs, while the inclusion of early warning crosses provides valuable insight into potential trend reversals.
Ultimately, the Modified Super Trend with Chebyshev filter is an excellent tool for traders looking to enhance their trend identification and decision-making abilities. With its advanced features, this indicator can help traders navigate volatile markets with confidence, making more informed decisions based on accurate, timely information.

ATR Oscillator - Index (Average True range Oscillator)The purpose of converting the ATR value indicator to an oscillator;
It is known that the ATR value is not between the two specified values. So it is not compressed between 0 and 100 like RSI and %B etc. Therefore, conditions such as "A condition if ATR value is X, B condition if ATR value is Y" cannot be created. In order to create these conditions, the max and min value range of the ATR value must be determined. This indicator converts the ATR values into a percentage number according to the maximum and minimum ATR values in the period you will choose. Max value is 100, min value is 0. The considered ATR value, on the other hand, corresponds to the % of the difference between the max and min value in the selected period.
In this way, conditions such as "If the ATR Oscillator value is greater than 10 or 20 or 30" can now be created, or the value of another indicator can be calculated based on the ATR Oscillator value. For example; Let's say we want the standard deviation of BBand to change according to the value of the ATR Oscillator. If BBand Standard Deviation is 3 if ATRO value is 100, BBand Standard Deviation is 2 if ATRO value is 0, and BBand Standard Deviation is 2.5 when ATRO value is 50;
We can encode it as BBand_Std_Dev=((ATRO*0.01)+2 )
If the ATRO value is between .... and ...., you can make improvements such as plot color X.

ATR & APCAverage True Range (ATR) and Average Price Change (APC). Shows the ATR and APC as well as the TR and PC for the current bar, colour coded to indicate very large/small bars. The ATR and APC are also colour coded to reflect whether they are increasing or decreasing. Style will need to be customized.

ATR+ Advanced Sessions ATR for DaterangeATR+ Advanced Sessions ATR for Daterange
The ATR+ adds the following additional filters to the stock ATR indicator by Tradingview:
- Calculates the overall average ATR for a user defined daterange, optionally filtered by trading session and selected weekdays, presented as a secondary line over the standard ATR line.
- Basic ATR line, with colour highlight to indicate the selected sessions, days and timeframe being calculated by the average ATR+ line.
- Average ATR+ line indicating the average of all ATRs within the defined timeframe, optionally filtered by instances of a selected trading session and selected weekdays.
- Customisable appearance.
- The ATR+ also includes the basic ATR configuration options typically found in the standard ATR by Tradingview, including period length and smoothing type. Defaults are set to the factory standards: 14 length, RMA smoothing type.
What Is the Average True Range (ATR)?
The ATR is a technical analysis tool that measures market volatility by decomposing the entire range asset price for that period. Investopedia describes the ATR as follows:
"The average true range (ATR) is a technical analysis indicator, introduced by market technician J. Welles Wilder Jr. in his book New Concepts in Technical Trading Systems, that measures market volatility by decomposing the entire range of an asset price for that period.
The true range indicator is taken as the greatest of the following: current high less the current low; the absolute value of the current high less the previous close; and the absolute value of the current low less the previous close. The ATR is then a moving average, generally using 14 days, of the true ranges."
For more information on the ATR and its calculations and use cases, see here:
Investopedia link here.
Tradingview link here.
Note
The indicator may time out if the number of bars being calculated is too long. If this happens, you will need to reduce the datetime range, or increase the chart timeframe in order to reduce the number of bars being calculated and the indicator will attempt to recalculate.

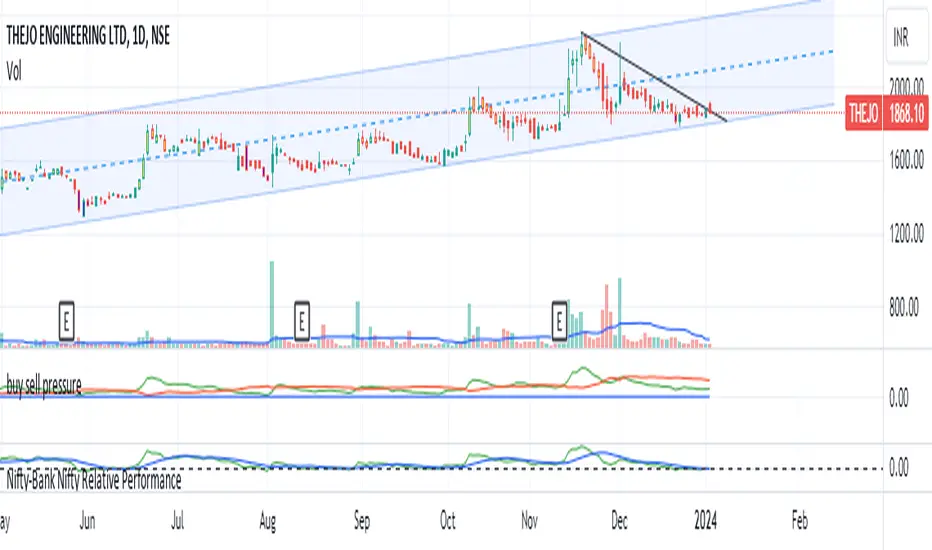
buy sell pressurebuy sell pressure indicator
Every stock /indices /chart is unique in nature. there will always be some kind of buyers and sellers present in these equities/stocks. due to their inherent buying and selling nature, these stocks also develop a pattern. such patterns are not always visible directly on the chart but we can calculate buying and selling pressure for these stocks individually . if we plot a graph on chart , we can easily see when stock is getting and when it is showing strength.
The logic for calculating buying and selling pressure is given below-
buying pressure= 14 days ema of {close- low(1)}
selling pressure= 14 days ema of {high(1)- close}
low (1) indicates 1 day ago candle's low price
high(1) indicates 1 day ago candle's high price
close= recent candle's close price
how to read chart :-
whenever buying pressure line (green color) crosses the selling pressure line (red color)stock will show strength and will go up. if the red line starts to cross the green line then we may see prices go down. so one can book profit here.
there is a unique zero line which is blue in color. it will act as a supreme buy and sell zone. if the green line touches or somehow goes below the zero line(blue line), stock will see strong buying pressure . if the red line (selling pressure line) goes below the zero line, the stock will witness strong selling pressure.
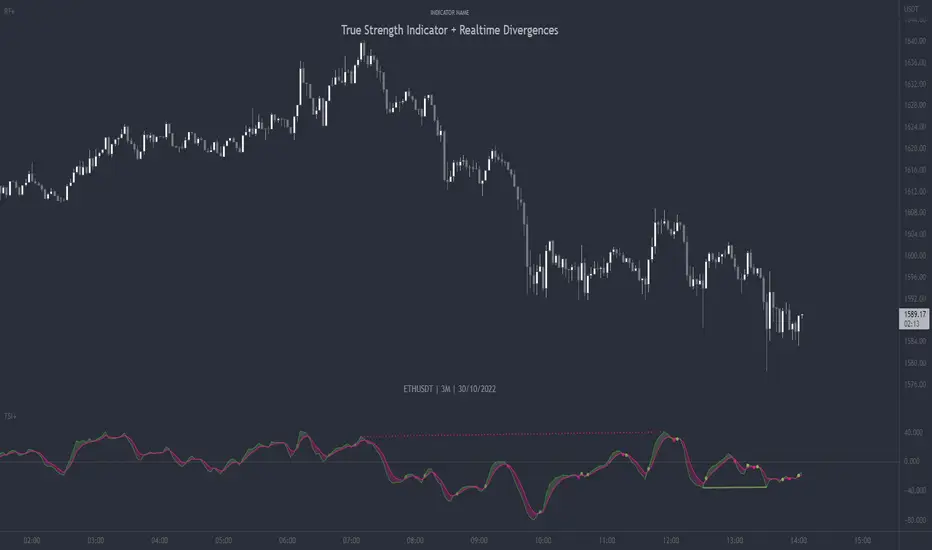
True Strength Indicator + Realtime DivergencesTrue Strength Indicator (TSI) + Realtime Divergences + Alerts + Lookback periods.
This version of the True Strength Indicator adds the following 5 additional features to the stock TSI by Tradingview:
- Optional divergence lines drawn directly onto the oscillator in realtime.
- Configurable alerts to notify you when divergences occur, as well as when the TSI and lagline bands crossover one another, when the oscillator begins heading up, or heading down.
- Configurable lookback periods to fine tune the divergences drawn in order to suit different trading styles and timeframes.
- Background colouring option to indicate when the two TSI bands, the TSI line and the TSI lagline, have crossed one another, either moving upwards or downwards, or optionally when the two TSI bands have crossed upwards and an external oscillator, which can be linked via the settings, has crossed above its centerline, and the TSI bands have crossed downwards and the external oscillator has crossed below its centerline.
- Alternate timeframe feature allows you to configure the oscillator to use data from a different timeframe than the chart it is loaded on.
This indicator adds additional features onto the stock TSI by Tradingview, whose core calculations remain unchanged, although this version has different settings as default to suit a shorter time period (it uses 6, 13, 4 by default, whereas the stock TSI typically ships with higher values, e.g. 25, 13, 13). Namely the configurable option to automatically, quickly and clearly draw divergence lines onto the oscillator for you as they occur in realtime. It also has the addition of unique alerts, so you can be notified when divergences occur without spending all day watching the charts. Furthermore, this version of the TSI comes with configurable lookback periods, which can be configured in order to adjust the sensitivity of the divergences, in order to suit shorter or higher timeframe trading approaches.
The True Strength Indicator
Tradingview describes the True Strength Indicator as follows:
“The True Strength Index (TSI) is a momentum oscillator that ranges between limits of -100 and +100 and has a base value of 0. Momentum is positive when the oscillator is positive (pointing to a bullish market bias) and vice versa. It was developed by William Blau and consists of 2 lines: the index line and an exponential moving average of the TSI, called the signal line. Traders may look for any of the following 5 types of conditions: overbought, oversold, centerline crossover, divergence and signal line crossover. The indicator is often used in combination with other signals..”
What are divergences?
Divergence is when the price of an asset is moving in the opposite direction of a technical indicator, such as an oscillator, or is moving contrary to other data. Divergence warns that the current price trend may be weakening, and in some cases may lead to the price changing direction.
There are 4 main types of divergence, which are split into 2 categories;
regular divergences and hidden divergences. Regular divergences indicate possible trend reversals, and hidden divergences indicate possible trend continuation.
Regular bullish divergence: An indication of a potential trend reversal, from the current downtrend, to an uptrend.
Regular bearish divergence: An indication of a potential trend reversal, from the current uptrend, to a downtrend.
Hidden bullish divergence: An indication of a potential uptrend continuation.
Hidden bearish divergence: An indication of a potential downtrend continuation.
Setting alerts.
With this indicator you can set alerts to notify you when any/all of the above types of divergences occur, on any chart timeframe you choose.
Configurable lookback values.
You can adjust the default lookback values to suit your prefered trading style and timeframe. If you like to trade a shorter time frame, lowering the default lookback values will make the divergences drawn more sensitive to short term price action.
How do traders use divergences in their trading?
A divergence is considered a leading indicator in technical analysis , meaning it has the ability to indicate a potential price move in the short term future.
Hidden bullish and hidden bearish divergences, which indicate a potential continuation of the current trend are sometimes considered a good place for traders to begin, since trend continuation occurs more frequently than reversals, or trend changes.
When trading regular bullish divergences and regular bearish divergences, which are indications of a trend reversal, the probability of it doing so may increase when these occur at a strong support or resistance level . A common mistake new traders make is to get into a regular divergence trade too early, assuming it will immediately reverse, but these can continue to form for some time before the trend eventually changes, by using forms of support or resistance as an added confluence, such as when price reaches a moving average, the success rate when trading these patterns may increase.
Typically, traders will manually draw lines across the swing highs and swing lows of both the price chart and the oscillator to see whether they appear to present a divergence, this indicator will draw them for you, quickly and clearly, and can notify you when they occur.
Disclaimer: This script includes code from the stock TSI by Tradingview as well as the Divergence for Many Indicators v4 by LonesomeTheBlue
TSI + DivergencesTrue Strength Indicator (TSI) + Divergences + Alerts + Lookback periods.
This version of the True Strength Indicator adds the following 3 additional features to the stock TSI by Tradingview:
- Optional divergence lines drawn directly onto the oscillator.
- Configurable alerts to notify you when divergences occur.
- Configurable lookback periods to fine tune the divergences drawn in order to suit different trading styles and timeframes.
This indicator adds additional features onto the stock TSI by Tradingview, whose core calculations remain unchanged. Namely the configurable option to automatically, quickly and clearly draw divergence lines onto the oscillator for you as they occur, with minimal delay. It also has the addition of unique alerts, so you can be notified when divergences occur without spending all day watching the charts. Furthermore, this version of the TSI comes with configurable lookback periods, which can be configured in order to adjust the sensitivity of the divergences, in order to suit shorter or higher timeframe trading approaches.
The True Strength Indicator
Tradingview describes the True Strength Indicator as follows:
“The True Strength Index (TSI) is a momentum oscillator that ranges between limits of -100 and +100 and has a base value of 0. Momentum is positive when the oscillator is positive (pointing to a bullish market bias) and vice versa. It was developed by William Blau and consists of 2 lines: the index line and an exponential moving average of the TSI, called the signal line. Traders may look for any of the following 5 types of conditions: overbought, oversold, centerline crossover, divergence and signal line crossover. The indicator is often used in combination with other signals..”
What are divergences?
Divergence is when the price of an asset is moving in the opposite direction of a technical indicator, such as an oscillator, or is moving contrary to other data. Divergence warns that the current price trend may be weakening, and in some cases may lead to the price changing direction.
There are 4 main types of divergence, which are split into 2 categories;
regular divergences and hidden divergences. Regular divergences indicate possible trend reversals, and hidden divergences indicate possible trend continuation.
Regular bullish divergence: An indication of a potential trend reversal, from the current downtrend, to an uptrend.
Regular bearish divergence: An indication of a potential trend reversal, from the current uptrend, to a downtrend.
Hidden bullish divergence: An indication of a potential uptrend continuation.
Hidden bearish divergence: An indication of a potential downtrend continuation.
Setting alerts.
With this indicator you can set alerts to notify you when any/all of the above types of divergences occur, on any chart timeframe you choose.
Configurable lookback values.
You can adjust the default lookback values to suit your prefered trading style and timeframe. If you like to trade a shorter time frame, lowering the default lookback values will make the divergences drawn more sensitive to short term price action.
How do traders use divergences in their trading?
A divergence is considered a leading indicator in technical analysis, meaning it has the ability to indicate a potential price move in the short term future.
Hidden bullish and hidden bearish divergences, which indicate a potential continuation of the current trend are sometimes considered a good place for traders to begin, since trend continuation occurs more frequently than reversals, or trend changes.
When trading regular bullish divergences and regular bearish divergences, which are indications of a trend reversal, the probability of it doing so may increase when these occur at a strong support or resistance level. A common mistake new traders make is to get into a regular divergence trade too early, assuming it will immediately reverse, but these can continue to form for some time before the trend eventually changes, by using forms of support or resistance as an added confluence, such as when price reaches a moving average, the success rate when trading these patterns may increase.
Typically, traders will manually draw lines across the swing highs and swing lows of both the price chart and the oscillator to see whether they appear to present a divergence, this indicator will draw them for you, quickly and clearly, and can notify you when they occur.
Disclaimer : This script includes code from the stock TSI by Tradingview as well as the RSI divergence indicator.

HLC True Strength Indicator (with Vix)HLC True Strength Indicator Volume Weighted with Vix Line by SpreadEagle71
This indicator is a True Strength Indicator with Close, High and Low used together, along with the TSI of the Vix.
The white line is the close. The red line is the lows and the blue is the highs. These are also volume-weighted.
How to Interpret:
1. zero line crosses. If SPY/SPX500 crosses the zero line, then its bullish. If the purple Vix line crosses up, watch out because this is bearish.
2. white/blue/red lines cross purple (Vix). If they cross upwards, this is bullish. If downward, this is bearish. Basically, SPX, ES1!, SPY or even DIA can be used. The security and the Vix should travel in opposite directions and cross the zero-line at the same time. But this is not always the case.
3. Black area infills. These are used between the close and the highs (blue) and the lows(red). Close should not be between these in order to have momentum.
4. Close (white line) leads. Close is the last price so it tends to show where the others (highs and lows) are going. If the close is sagging below a high where the blue lines are on top, this could mean that there is a reversal coming. Same holds true for a white line above a "valley" formed by the blue and red lines; it could mean a reversal to the upside soon.
5. The Black Infill areas as a squeeze or contraction/expansion area. The thinner the black infill areas, the more of a momentum "squeeze" could be present. Wide black infill areas mean increased volatility and what may come next is a reversion to the mean for volatility. See TTM Squeeze Indicator or the Squeeze Momentum Indicator (kudos LazyBear).
Lastly, just remember indicators indicate; they are not magic. :)
SpreadEagle71

Average True Range (ATR) invisible price markers / linesThis script provides the ATR price when added to the top and bottom of the currently hovered candle.
The prices are shown top left next to the indicators' name.
This means you do not have to manually subtract or add ATR to price.
Line opacity allows you to show the lines where the ATR is, however, I recommend to keep this disabled.
Line type allows you to choose where ATR is calculated from (LowHigh or LowHighBody), the second ignoring the wicks, however LH is standard.
I also recommend to keep the other parameters as default.
I hope this indicator provides useful to you and your trading.

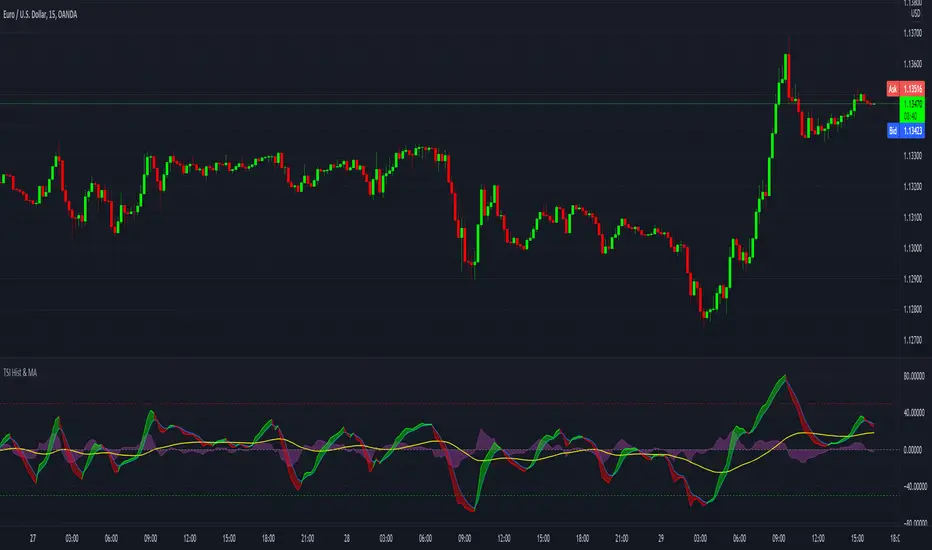
TSI with histogram and MA - SamXThis is an enhanced TSI. The others I've found on here have generally lacked sufficient settings context and/or alert definitions, so I made this version to address those gaps. In addition to that, I also added a way to plot a user-customizable moving average line of the TSI to better help identify trending conditions across TSI swings.
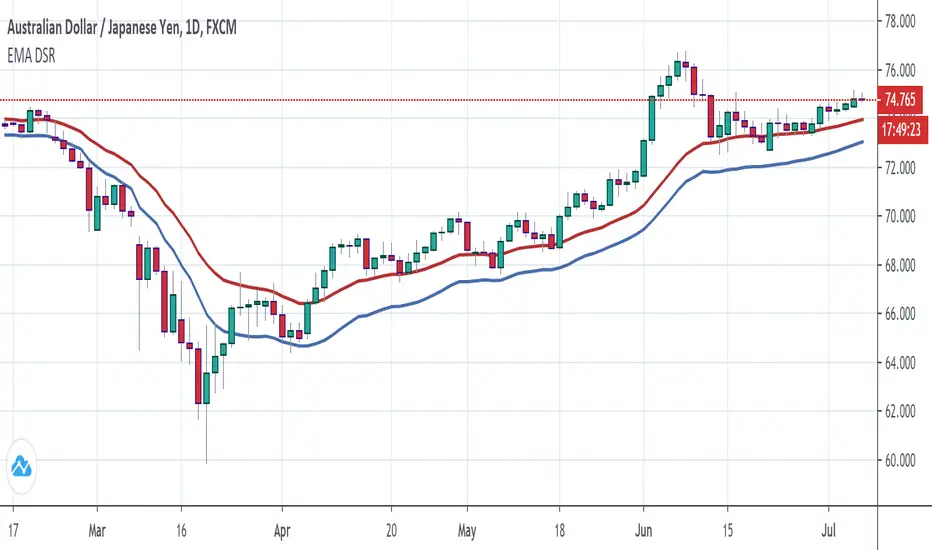
Supertrend BandsSupertrend Bands
What is the Supertrend indicator?
"The Supertrend indicator is a trend following overlay on your trading chart, much like a moving average, that shows you the current trend direction.
The indicator works well in a trending market but can give false signals when a market is trading in a range.
It uses the ATR (average true range) as part of its calculation which takes into account the volatility of the market. The ATR is adjusted using the multiplier setting which determines how sensitive the indicator is."
"For the basic Supertrend settings, you can adjust period and factor:
- The period setting is the lookback for the ATR calculation
- Factor is the what the ATR is multiplied by to offset the bands from price"
How to use this indicator
This indicator is inspired by a strategy I found. It includes four Supertrend indicators, each with different settings that displays trend strength and support/resistance zones. The default settings are optimal for cryptocurrency but do work quite well for traditional also. I highly recommend you try experimenting with different settings, increasing them to suit the instrument.
The bands are set from low to high, Band 1 being the fastest and Band 4 being the slowest. Band 4 is the one that sets the overall trend so when price is above Band 4, the trend is bullish and vice versa. Trend is strongest when price is above/below Band 1 and gets weaker as it filters through each band. Band 4 provides the strongest support/resistance and if that breaks the trend flips.
In the menu, you will see an option called "Remove Anti Trend?". It is enabled by default and it removes any bearish/resistance bands when the trend is up and any bullish/support bands when the trend is down. When turned off, it will show all Supertrend Bands as they are by default.
Bar Colors
Bar colors are optional and they reflect the current trend strength based on the Supertrend bands.
Alternate ways of using this indicator
You could leave everything as default or you can display individual bands. For instance, because I use many overlay indicators, most of the time I turn off all the bands and only show bar colors:
You can also turn off Bands 1 and 2 and only show the two slowest lengths:
This removes the noise of the two faster Supertrends.
Or just show the two fastest bands:
Any suggestions to improve this indicator are most welcome :)

TSI Strength Meter vs USD with divergenceThis indicator consists of two lines. One is a gray line (USD) and the asset indicator is green or red.
The basis of this indicator is the true strength indicator (TSI) with parameters 5,15. Both line sets are based on a TSI (5,15).
The lookback period is for new highs / new lows. Default value is 200 periods.
GREEN/RED LINE
The first that is green and red is whatever you choose to display ( BTC in this case).
The green and red lines indicate going up or going down.
GRAY LINE
The gray line is the US Dollar . So everything is relative to that by default.
ZERO LINE CROSSES
These are momentum shifts. If you see a crossover of both around the zero line, its a good indication there is a change in momentum and a reversal of trend.
NEW HIGHS NEW LOWS
There are 4 new colors added to this indicator. For the asset you are viewing, a lime color means new highs within the lookback period. A new low is indicated by a yellow line color.
The new lows for the USD are white for new lows within the lookback period and blue line for the new highs.
DIVERGENCE
You can also spot divergences easily. For example, if a lime color is seen on the indicator line, that means "new high" but if it occurs below the last "new high" it means the asset is going up to new highs but the indicator is showing us that the readings are below the previous new highs, indicating a negative divergence.
The same goes for the yellow colored lines. higher yellows mean positive divergence.
And with the US Dollar , blue lines dropping means a negative divergence in the US Dollar , while white lines moving up means a positive dollar divergence.
INTERPRETATION
Examples:
If you see a green and sometimes red line of the asset indicator and a gray line that drops below the zero line; it may mean the asset is rising and the trend is up.
If you see a green and red line below the zero line and with a gray line above the zero line , it indicates there is a negative trend. If you suddenly see blue lines on the USD, this means its hitting new lows. If these blue lines then start to slowly move downwards; then we have a positive divergence. If that were to be followed by the green line crossing the zero line, its a pretty good be that the trend is changing and its a very good buying oportunity.

ATR - ATR from Low, ATR from High LabelsChecks what the average true range is for the X amount of trading days. Then will also label the ATR from the low, and the ATR from the high of the current day.
A second label can be created dependent on current days RVOL %. If RVOL is not 0 or 1, then it will create the second label. Otherwise it will just leave it as the standard label.
The calculation for second label is RVOL * ATR.

ATR _NormalizedThis script is good to use with Williams %R indicator, to find out when price has bottomed out.
ATR has to be over 90 and Williams %R ( lenght 52 ) has to be over 95 to find out level around which one is good to buy.
You can check back, to see that this worked very well over history. Best way to use this 2 indicators is with DCA ( dollar cost average ), as area where to buy can go a little bit down and up for as long as few months. So dont just jump in, use DCA .


%ATR - TCTAThe enhanced version of %ATR of "codermua"
The %ATR calculated by EMA(red) , SMA(purple) and WMA(yellow) added to existing indicator which include only RMA(blue) calculation.
