EMA HeatmapEMA Heatmap — Indicator Description
The EMA Order Heatmap is a visual trend-structure tool designed to show whether the market is currently trending bullish, trending bearish, or moving through a neutral consolidation phase. It evaluates the alignment of multiple exponential moving averages (EMAs) at three different structural layers: short-term daily, medium-term daily, and weekly macro trend. This creates a quick and intuitive picture of how well price movement is organized across timeframes.
Each layer of the heatmap is scored from bearish to bullish based on how the EMAs are stacked relative to each other. When EMAs are in a fully bullish configuration, the row displays a bright green or lime color. Fully bearish alignment is shown in red. Yellow tones appear when the EMAs are mixed or compressing, indicating uncertainty, trend exhaustion, or a change in market character. The three rows combined offer a concise view of whether strength or weakness is isolated to one timeframe or broad across the market.
This indicator is best used as a trend filter before making trading decisions. Traders may find more consistent setups when the majority of the heatmap supports the direction of their trade. Green-dominant conditions suggest a trending bullish environment where long trades can be favored. Red-dominant conditions indicate bearish momentum and stronger potential for short opportunities. When yellow becomes more prominent, the market may be transitioning, ranging, or gearing up for a breakout, making timing more challenging and risk higher.
• Helps quickly identify directional bias
• Highlights when trends strengthen, weaken, or turn
• Provides insight into whether momentum is supported by higher timeframes
• Encourages traders to avoid fighting market structure
It is important to recognize the limitations. EMAs are lagging indicators, so the heatmap may confirm a trend after the initial move is underway, especially during fast reversals. In sideways or low-volume environments, the structure can shift frequently, reducing clarity. This tool does not generate entry or exit signals on its own and should be paired with price action, momentum studies, or support and resistance analysis for precise trade execution.
The EMA Order Heatmap offers a clean and reliable way to stay aligned with the broader market environment and avoid lower-quality trades in indecisive conditions. It supports more disciplined decision-making by helping traders focus on setups that match the prevailing structural trend.
Trendfollowing

Portfolio Strategy TesterThe Portfolio Strategy Tester is an institutional-grade backtesting framework that evaluates the performance of trend-following strategies on multi-asset portfolios. It enables users to construct custom portfolios of up to 30 assets and apply moving average crossover strategies across individual holdings. The model features a clear, color-coded table that provides a side-by-side comparison between the buy-and-hold portfolio and the portfolio using the risk management strategy, offering a comprehensive assessment of both approaches relative to the benchmark.
Portfolios are constructed by entering each ticker symbol in the menu, assigning its respective weight, and reviewing the total sum of individual weights displayed at the top left of the table. For strategy selection, users can choose between Exponential Moving Average (EMA), Simple Moving Average (SMA), Wilder’s Moving Average (RMA), Weighted Moving Average (WMA), Moving Average Convergence Divergence (MACD), and Volume-Weighted Moving Average (VWMA). Moving average lengths are defined in the menu and apply only to strategy-enabled assets.
To accurately replicate real-world portfolio conditions, users can choose between daily, weekly, monthly, or quarterly rebalancing frequencies and decide whether cash is held or redistributed. Daily rebalancing maintains constant portfolio weights, while longer intervals allow natural drift. When cash positions are not allowed, capital from bearish assets is automatically redistributed proportionally among bullish assets, ensuring the portfolio remains fully invested at all times. The table displays a comprehensive set of widely used institutional-grade performance metrics:
CAGR = Compounded annual growth rate of returns.
Volatility = Annualized standard deviation of returns.
Sharpe = CAGR per unit of annualized standard deviation.
Sortino = CAGR per unit of annualized downside deviation.
Calmar = CAGR relative to maximum drawdown.
Max DD = Largest peak-to-trough decline in value.
Beta (β) = Sensitivity of returns relative to benchmark returns.
Alpha (α) = Excess annualized risk-adjusted returns relative to benchmark.
Upside = Ratio of average return to benchmark return on up days.
Downside = Ratio of average return to benchmark return on down days.
Tracking = Annualized standard deviation of returns versus benchmark.
Turnover = Average sum of absolute changes in weights per year.
Cumulative returns are displayed on each label as the total percentage gain from the selected start date, with green indicating positive returns and red indicating negative returns. In the table, baseline metrics serve as the benchmark reference and are always gray. For portfolio metrics, green indicates outperformance relative to the baseline, while red indicates underperformance relative to the baseline. For strategy metrics, green indicates outperformance relative to both the baseline and the portfolio, red indicates underperformance relative to both, and gray indicates underperformance relative to either the baseline or portfolio. Metrics such as Volatility, Tracking Error, and Turnover ratio are always displayed in gray as they serve as descriptive measures.
In summary, the Portfolio Strategy Tester is a comprehensive backtesting tool designed to help investors evaluate different trend-following strategies on custom portfolios. It enables real-world simulation of both active and passive investment approaches and provides a full set of standard institutional-grade performance metrics to support data-driven comparisons. While results are based on historical performance, the model serves as a powerful portfolio management and research framework for developing, validating, and refining systematic investment strategies.

Curved Radius Supertrend [BOSWaves]Curved Radius Supertrend — Adaptive Parabolic Trend Framework with Dynamic Acceleration Geometry
Overview
The Curved Radius Supertrend introduces an evolution of the classic Supertrend indicator - engineered with a dynamic curvature engine that replaces rigid ATR bands with parabolic, radius-based motion. Traditional Supertrend systems rely on static band displacement, reacting linearly to volatility and often lagging behind emerging price acceleration. The Curved Radius Supertend model redefines this by integrating controlled acceleration and curvature geometry, allowing the trend bands to adapt fluidly to both velocity and duration of price movement.
The result is a smoother, more organic trend flow that visually captures the momentum curve of price action - not just its direction. Instead of sharp pivots or whipsaws, traders experience a structurally curved trajectory that mirrors real market inertia. This makes it particularly effective for identifying sustained directional phases, detecting early trend rotations, and filtering out noise that plagues standard Supertrend methodologies.
Unlike conventional band-following systems, the Curved Radius framework is time-reactive and velocity-aware, providing a nuanced signal structure that blends geometric precision with volatility sensitivity.
Theoretical Foundation
The Curved Radius Supertrend draws from the intersection of mathematical curvature dynamics and adaptive volatility processing. Standard Supertrend algorithms extend from Average True Range (ATR) envelopes - a linear measure of volatility that moves proportionally with price deviation. However, markets do not expand or contract linearly. Trend velocity typically accelerates and decelerates in nonlinear arcs, forming natural parabolas across price phases.
By embedding a radius-based acceleration function, the indicator models this natural behavior. The core variable, radiusStrength, controls how aggressively curvature accelerates over time. Instead of simply following price distance, the band now evolves according to temporal acceleration - each bar contributes incremental velocity, bending the trend line into a radius-like curve.
This structural design allows the indicator to anticipate rather than just respond to price action, capturing momentum transitions as curved accelerations rather than binary flips. In practice, this eliminates the stutter effect typical of standard Supertrends and replaces it with fluid directional motion that better reflects actual trend geometry.
How It Works
The Curved Radius Supertrend is constructed through a multi-stage process designed to balance price responsiveness with geometric stability:
1. Baseline Supertrend Core
The framework begins with a standard ATR-derived upper and lower band calculation. These define the volatility envelope that constrains potential price zones. Directional bias is determined through crossover logic - prices above the lower band confirm an uptrend, while prices below the upper band confirm a downtrend.
2. Curvature Acceleration Engine
Once a trend direction is established, a curvature engine is activated. This system uses radiusStrength as a coefficient to simulate acceleration per bar, incrementally increasing velocity over time. The result is a parabolic displacement from the anchor price (the price level at trend change), creating a curved motion path that dynamically widens or tightens as the trend matures.
Mathematically, this acceleration behaves quadratically - each new bar compounds the previous velocity, forming an exponential rate of displacement that resembles curved inertia.
3. Adaptive Smoothing Layer
After the radius curve is applied, a smoothing stage (defined by the smoothness parameter) uses a simple moving average to regulate curve noise. This ensures visual coherence without sacrificing responsiveness, producing flowing arcs rather than jagged band steps.
4. Directional Visualization and Outer Envelope
Directional state (bullish or bearish) dictates both the color gradient and band displacement. An outer envelope is plotted one ATR beyond the curved band, creating a layered trend visualization that shows the extent of volatility expansion.
5. Signal Events and Alerts
Each directional transition triggers a 'BUY' or 'SELL' signal, clearly labeling phase shifts in market structure. Alerts are built in for automation and backtesting.
Interpretation
The Curved Radius Supertrend reframes how traders visualize and confirm trends. Instead of simply plotting a trailing stop, it maps the dynamic curvature of trend development.
Uptrend Phases : The band curves upward with increasing acceleration, reflecting the market’s growing directional velocity. As curvature steepens, conviction strengthens.
Downtrend Phases : The band bends downward in a mirrored acceleration pattern, indicating sustained bearish momentum.
Trend Change Points : When the direction flips and a new anchor point forms, the curve resets - providing a clean, early visual confirmation of structural reversal.
Smoothing and Radius Interplay : A lower radius strength produces a tighter, more reactive curve ideal for scalping or short timeframes. Higher values generate broad, sweeping arcs optimized for swing or positional analysis.
Visually, this curvature system translates market inertia into shape - revealing how trends bend, accelerate, and ultimately exhaust.
Strategy Integration
The Curved Radius Supertrend is versatile enough to integrate seamlessly into multiple trading frameworks:
Trend Following : Use BUY/SELL flips to identify emerging directional bias. Strong curvature continuation confirms sustained momentum.
Momentum Entry Filtering : Combine with oscillators or volume tools to filter entries only when the curve slope accelerates (high momentum conditions).
Pullback and Re-entry Timing : The smooth curvature of the radius band allows traders to identify shallow retracements without premature exits. The band acts as a dynamic, self-adjusting support/resistance arc.
Volatility Compression and Expansion : Flattening curvature indicates volatility compression - a potential pre-breakout zone. Rapid re-steepening signals expansion and directional conviction.
Stop Placement Framework : The curved band can serve as a volatility-adjusted trailing stop. Because the curve reflects acceleration, it adapts naturally to market rhythm - widening during momentum surges and tightening during stagnation.
Technical Implementation Details
Curved Radius Engine : Parabolic acceleration algorithm that applies quadratic velocity based on bar count and radiusStrength.
Anchor Logic : Resets curvature at each trend change, establishing a new reference base for directional acceleration.
Smoothing Layer : SMA-based curve smoothing for noise reduction.
Outer Envelope : ATR-derived band offset visualizing volatility extension.
Directional Coloring : Candle and band coloration tied to current trend state.
Signal Engine : Built-in BUY/SELL markers and alert conditions for automation or script integration.
Optimal Application Parameters
Timeframe Guidance :
1-5 min (Scalping) : 0.08–0.12 radius strength, minimal smoothing for rapid responsiveness.
15 min : 0.12–0.15 radius strength for intraday trends.
1H : 0.15–0.18 radius strength for structured short-term swing setups.
4H : 0.18–0.22 radius strength for macro-trend shaping.
Daily : 0.20–0.25 radius strength for broad directional curves.
Weekly : 0.25–0.30 radius strength for smooth macro-level cycles.
The suggested radius strength ranges provide general structural guidance. Optimal values may vary across assets and volatility regimes, and should be refined through empirical testing to account for instrument-specific behavior and prevailing market conditions.
Asset Guidance :
Cryptocurrency : Higher radius and multiplier values to stabilize high-volatility environments.
Forex : Midrange settings (0.12-0.18) for clean curvature transitions.
Equities : Balanced curvature for trending sectors or momentum rotation setups.
Indices/Futures : Moderate radius values (0.15-0.22) to capture cyclical macro swings.
Performance Characteristics
High Effectiveness :
Trending environments with directional expansion.
Markets exhibiting clean momentum arcs and low structural noise.
Reduced Effectiveness :
Range-bound or low-volatility conditions with repeated false flips.
Ultra-short-term timeframes (<1m) where curvature acceleration overshoots.
Integration Guidelines
Confluence Framework : Combine with structure tools (order blocks, BOS, liquidity zones) for entry validation.
Risk Management : Trail stops along the curved band rather than fixed points to align with adaptive market geometry.
Multi-Timeframe Confirmation : Use higher timeframe curvature as a trend filter and lower timeframe curvature for execution timing.
Curve Compression Awareness : Treat flattening arcs as potential exhaustion zones - ideal for scaling out or reducing exposure.
Disclaimer
The Curved Radius Supertrend is a geometric trend model designed for professional traders and analysts. It is not a predictive system or a guaranteed profit method. Its performance depends on correct parameter calibration and sound risk management. BOSWaves recommends using it as part of a comprehensive analytical framework, incorporating volume, liquidity, and structural context to validate directional signals.

Background Trend Follower by exp3rtsThe Background Trend Follower indicator visually highlights the market’s daily directional bias using subtle background colors. It calculates the price change from the daily open and shades the chart background according to the current intraday momentum.
🟢 Green background → Price is significantly above the daily open (strong bullish trend)
🔴 Red background → Price is significantly below the daily open (strong bearish trend)
🟡 Yellow background → Price is trading near the daily open (neutral or consolidating phase)
The script automatically detects each new trading day.
It records the opening price at the start of the day.
As the session progresses, it continuously measures how far the current price has moved from that open.
When the move exceeds ±50 points (custom threshold), the background color adapts to reflect the trend strength.
Perfect for traders who want a quick visual sense of intraday bias — bullish, bearish, or neutral — without cluttering the chart with extra indicators.

Advanced Chandelier Exit with S/R [Alpha Extract]Advanced Chandelier Exit with S/R is a precision-crafted trailing stop and market structure detection system that fuses advanced Chandelier Exit logic with intelligent, multi-timeframe support and resistance tracking. This indicator delivers adaptive trend detection, volatility-aware exit positioning, and real-time structural mapping in a clean, responsive format. By combining directional filtering, pivot zone detection, and customizable styling, Advanced Chandelier Exit with S/R is designed to give traders reliable context, strong risk management, and visually intuitive confirmation signals across all timeframes and asset classes.
🔶 Adaptive Trailing Stop Architecture
At the core of Advanced Chandelier Exit with S/R is a refined Chandelier Exit mechanism that dynamically calculates trailing stops based on recent highs and lows, ATR volatility, and trend sensitivity. The system features directional memory, anchoring the stop to maintain position until a confirmed trend break occurs. This method prevents premature flips and keeps the trade aligned with sustained momentum.
longStop := close > longStop ? math.max(longStop, longStop ) : longStop
shortStop := close < shortStop ? math.min(shortStop, shortStop ) : shortStop
🔶 Volatility-Weighted Filtering
To reduce noise and improve reaction quality, Advanced Chandelier Exit with S/R includes an optional volatility normalization filter. This system adjusts ATR output based on how elevated it is relative to its own average, effectively down-weighting erratic price moves while maintaining responsiveness in directional phases.
volatilityFilter = enableVolatilityFilter ? ta.sma(baseATR, length) / baseATR : 1.0
atr = mult * baseATR * sensitivity * volatilityFilter
🔶 Trend Strength-Aware State Transitions
Trend flips in Advanced Chandelier Exit with S/R are not based solely on price crossing the stop level. Instead, the system includes a momentum-derived trend strength filter that validates the legitimacy of directional shifts. This guards against weak reversals and gives stronger confidence in breakout moves.
priceChange = math.abs(close - close )
avgPriceChange = ta.sma(priceChange, length)
trendStrength = math.min(priceChange / avgPriceChange * 100, 200)
🔶 Multi-Timeframe Support & Resistance Zones
Advanced Chandelier Exit with S/R embeds a sophisticated pivot-based structure mapping engine that automatically identifies significant price reaction levels and tracks their validity over time. It filters redundant zones, removes invalidated levels, and renders real-time support and resistance overlays based on market structure.
if isUniqueLevel(ph, resistanceLevels)
array.unshift(resistanceLevels, ph)
if isUniqueLevel(pl, supportLevels)
array.unshift(supportLevels, pl)
🔶 Dynamic Visual Encoding
The indicator uses strength-scaled fills, customizable colors, and line styling to convey directional bias with clarity. Color opacity intensifies as trend strength increases, offering intuitive context at a glance. Dynamic background fills mark trend states, while S/R zones are rendered with user-defined transparency for clean integration.
🔶 Signal Detection and Alerts
Directional signals are generated upon confirmed flips between long and short regimes, validated by stop crosses and strength filters. Additionally, the indicator provides S/R breakout alerts, identifying when price breaks through a key structural level.
🔶 Performance and Customization Optimizations
Advanced Chandelier Exit with S/R is built with modularity and efficiency in mind. It supports full customization of stop logic, volatility sensitivity, structural lookback, S/R zone filtering, and visual display. The use of array-based data structures for S/R levels ensures consistent performance even across high-activity assets and longer lookback periods.
Advanced Chandelier Exit with S/R represents the next evolution in trailing stop and structure-aware trading tools. By blending the proven logic of the Chandelier Exit system with intelligent trend strength filters and robust S/R detection, it becomes more than just a stop indicator—it becomes a complete trade management companion. Traders benefit from fewer false flips, clearer directional bias, and precise structural overlays that reinforce both breakout and reversal strategies. Whether used for swing entries, intraday positioning, or zone-based re-entries, Advanced Chandelier Exit with S/R empowers traders with responsive, intelligent logic that adapts to market conditions without compromise.

Smart Money Volume Activity [AlgoAlpha]🟠 OVERVIEW
This tool visualizes how Smart Money and Retail participants behave through lower-timeframe volume analysis. It detects volume spikes far beyond normal activity, classifies them as institutional or retail, and projects those zones as reactive levels. The script updates dynamically with each bar, showing when large players enter while tracking whether those events remain profitable. Each event is drawn as a horizontal line with bubble markers and summarized in a live P/L table comparing Smart Money versus Retail.
🟠 CONCEPTS
The core logic uses Z-score normalization on lower-timeframe volumes (like 5m inside a 1h chart). This lets the script detect statistically extreme bursts of buying or selling activity. It classifies each detected event as:
Smart Money — volume inside the candle body (suggesting hidden accumulation or distribution)
Retail — volume closing at bar extremes (suggesting chase entries or panic exits)
When new events appear, the script plots them as horizontal levels that persist until price interacts again. Each level acts as a potential reaction zone or liquidity footprint. The integrated P/L table then measures which class (Retail or Smart Money) is currently “winning” — comparing cumulative profitable versus losing volume.
🟠 FEATURES
Classifies flows into Smart Money or Retail based on candle-body context.
Displays live P/L comparison table for Smart vs Retail performance.
Alerts for each detected Smart or Retail buy/sell event.
🟠 USAGE
Setup : Add the script to any chart. Set Lower Timeframe Value (e.g., “5” for 5m) smaller than your main chart timeframe. The Period input controls how many bars are analyzed for the Z-score baseline. The Threshold (|Z|) decides how extreme a volume must be to plot a level.
Read the chart : Horizontal lines mark where heavy Smart or Retail volume occurred. Bright bubbles show the strongest events — their size reflects Z-score intensity. The on-chart table updates live: green cells show profitable flows, red cells show losing flows. A dominant green Smart Money row suggests institutions are currently controlling price.
See what others are doing :
Settings that matter : Raising Threshold (|Z|) filters noise, showing only large players. Increasing Period smooths results but reacts slower to new bursts. Use Show = “Both” for full comparison or isolate “Smart Money” / “Retail” to focus on one class.

Market Regime IndexThe Market Regime Index is a top-down macro regime nowcasting tool that offers a consolidated view of the market’s risk appetite. It tracks 32 of the world’s most influential markets across asset classes to determine investor sentiment by applying trend-following signals to each independent asset. It features adjustable parameters and a built-in alert system that notifies investors when conditions transition between Risk-On and Risk-Off regimes. The selected markets are grouped into equities (7), fixed income (9), currencies (7), commodities (5), and derivatives (4):
Equities = S&P 500 E-mini Index Futures, Nasdaq-100 E-mini Index Futures, Russell 2000 E-mini Index Futures, STOXX Europe 600 Index Futures, Nikkei 225 Index Futures, MSCI Emerging Markets Index Futures, and S&P 500 High Beta (SPHB)/Low Beta (SPLV) Ratio.
Fixed Income = US 10Y Treasury Yield, US 2Y Treasury Yield, US 10Y-02Y Yield Spread, German 10Y Bund Yield, UK 10Y Gilt Yield, US 10Y Breakeven Inflation Rate, US 10Y TIPS Yield, US High Yield Option-Adjusted Spread, and US Corporate Option-Adjusted Spread.
Currencies = US Dollar Index (DXY), Australian Dollar/US Dollar, Euro/US Dollar, Chinese Yuan/US Dollar, Pound Sterling/US Dollar, Japanese Yen/US Dollar, and Bitcoin/US Dollar.
Commodities = ICE Brent Crude Oil Futures, COMEX Gold Futures, COMEX Silver Futures, COMEX Copper Futures, and S&P Goldman Sachs Commodity Index (GSCI) Futures.
Derivatives = CBOE S&P 500 Volatility Index (VIX), ICE US Bond Market Volatility Index (MOVE), CBOE 3M Implied Correlation Index, and CBOE VIX Volatility Index (VVIX)/VIX.
All assets are directionally aligned with their historical correlation to the S&P 500. Each asset contributes equally based on its individual bullish or bearish signal. The overall market regime is calculated as the difference between the number of Risk-On and Risk-Off signals divided by the total number of assets, displayed as the percentage of markets confirming each regime. Green indicates Risk-On and occurs when the number of Risk-On signals exceeds Risk-Off signals, while red indicates Risk-Off and occurs when the number of Risk-Off signals exceeds Risk-On signals.
Bullish Signal = (Fast MA – Slow MA) > (ATR × ATR Margin)
Bearish Signal = (Fast MA – Slow MA) < –(ATR × ATR Margin)
Market Regime = (Risk-On signals – Risk-Off signals) ÷ Total assets
This indicator is designed with flexibility in mind, allowing users to include or exclude individual assets that contribute to the market regime and adjust the input parameters used for trend signal detection. These parameters apply to each independent asset, and the overall regime signal is smoothed by the signal length to reduce noise and enhance reliability. Investors can position according to the prevailing market regime by selecting factors that have historically outperformed under each regime environment to minimise downside risk and maximise upside potential:
Risk-On Equity Factors = High Beta > Cyclicals > Low Volatility > Defensives.
Risk-Off Equity Factors = Defensives > Low Volatility > Cyclicals > High Beta.
Risk-On Fixed Income Factors = High Yield > Investment Grade > Treasuries.
Risk-Off Fixed Income Factors = Treasuries > Investment Grade > High Yield.
Risk-On Commodity Factors = Industrial Metals > Energy > Agriculture > Gold.
Risk-Off Commodity Factors = Gold > Agriculture > Energy > Industrial Metals.
Risk-On Currency Factors = Cryptocurrencies > Foreign Currencies > US Dollar.
Risk-Off Currency Factors = US Dollar > Foreign Currencies > Cryptocurrencies.
In summary, the Market Regime Index is a comprehensive macro risk-management tool that identifies the current market regime and helps investors align portfolio risk with the market’s underlying risk appetite. Its intuitive, color-coded design makes it an indispensable resource for investors seeking to navigate shifting market conditions and enhance risk-adjusted performance by selecting factors that have historically outperformed. While it has proven historically valuable, asset-specific characteristics and correlations evolve over time as market dynamics change.

Trend Pivots Profile [BigBeluga]🔵 OVERVIEW
The Trend Pivots Profile is a dynamic volume profile tool that builds profiles around pivot points to reveal where liquidity accumulates during trend shifts. When the market is in an uptrend , the indicator generates profiles at low pivots . In a downtrend , it builds them at high pivots . Each profile is constructed using lower timeframe volume data for higher resolution, making it highly precise even in limited space. A colored trendline helps traders instantly recognize the prevailing trend and anticipate which type of profile (bullish or bearish) will form.
🔵 CONCEPTS
Pivot-Driven Profiles : Profiles are only created when a new pivot forms, aligning liquidity analysis with market structure shifts.
Trend-Contextual : Profiles form at low pivots in uptrends and at high pivots in downtrends.
Lower Timeframe Data : Volume and close values are pulled from smaller timeframes to provide detailed, high-resolution profiles inside larger pivot windows.
Adaptive Bin Sizing : Bin size is automatically calculated relative to ATR, ensuring consistent precision across different markets and volatility conditions.
Point of Control (PoC) : The highest-volume level within each profile is marked with a PoC line that extends until the next pivot forms.
Trendline Visualization : A wide, semi-transparent line follows the rolling average of highs and lows, colored blue in uptrends and orange in downtrends.
🔵 FEATURES
Pivot Length Control : Adjust how far back the script looks to detect pivots (e.g., length 5 → profiles cover 10 bars after pivot).
Pivot Profile toggle :
On → draw the filled pivot profile + PoC + pivot label.
Off → hide profiles; show only PoC level (clean S/R mode).
Trend Length Filter : Smooths trendline detection to ensure reliable up/down bias.
Precise Volume Distribution : Volume is aggregated into bins, creating a smooth volume curve around the pivot range.
PoC Extension : Automatically extends the most active price level until a new pivot is confirmed.
Profile Visualization : Profiles appear as filled shapes anchored at the pivot candle, colored based on trend.
Trendline Overlay : Thick, semi-transparent trendline provides visual guidance on directional bias.
Automatic Cleanup : Old profiles are deleted once they exceed the chart’s capacity (default 25 stored profiles).
🔵 HOW TO USE
Spotting Trend Liquidity : In an uptrend, monitor profiles at low pivots to see where buyers concentrated. In downtrends, use high-pivot profiles to spot sell-side pressure.
Watch the PoC : The PoC line highlights the strongest traded level of the pivot structure—expect reactions when price retests it.
Anticipate Trend Continuation/Reversal : Use the trendline (blue = bullish, orange = bearish) together with pivot profiles to forecast directional momentum.
Combine with HTF Context : Overlay with higher timeframe structure (order blocks, liquidity zones, or FVGs) for confluence.
Fine-Tune with Inputs : Adjust Pivot Length for sensitivity and Trend Length for smoother or faster trend shifts.
🔵 CONCLUSION
The Trend Pivots Profile blends pivot-based structure with precise volume profiling. By dynamically plotting profiles on pivots aligned with the prevailing trend, highlighting PoCs, and overlaying a directional trendline, it equips traders with a clear view of liquidity clusters and directional momentum—ideal for anticipating reactions, pullbacks, or breakouts.

Quant Trend + Donchian (Educational, Public-Safe)What this does
Educational, public-safe visualization of a quant regime model:
• Trend : EMA(64) vs EMA(256) (EWMAC proxy)
• Breakout : Donchian channel (200)
• Volatility-awareness : internal z-scores (not plotted) for concept clarity
Why it’s useful
• Shows when trend & breakout align (clean regimes) vs conflict (chop)
• Helps explain why volatility-aware systems size up in smooth trends and scale down in noise
How to read it
• EMA64 above EMA256 with price near/above Donchian high → trend-following alignment
• EMA64 below EMA256 with price near/below Donchian low → bearish alignment
• Inside channel with EMAs tangled → range/chop risk
Notes
• Indicator is educational only (no orders).
• Built entirely with TradingView built-ins.
• For consistent visuals: enable “Indicator values on price scale” and disable “Scale price chart only” in Settings → Scales .

Fisher Transform Trend Navigator [QuantAlgo]🟢 Overview
The Fisher Transform Trend Navigator applies a logarithmic transformation to normalize price data into a Gaussian distribution, then combines this with volatility-adaptive thresholds to create a trend detection system. This mathematical approach helps traders identify high-probability trend changes and reversal points while filtering market noise in the ever-changing volatility conditions.
🟢 How It Works
The indicator's foundation begins with price normalization, where recent price action is scaled to a bounded range between -1 and +1:
highestHigh = ta.highest(priceSource, fisherPeriod)
lowestLow = ta.lowest(priceSource, fisherPeriod)
value1 = highestHigh != lowestLow ? 2 * (priceSource - lowestLow) / (highestHigh - lowestLow) - 1 : 0
value1 := math.max(-0.999, math.min(0.999, value1))
This normalized value then passes through the Fisher Transform calculation, which applies a logarithmic function to convert the data into a Gaussian normal distribution that naturally amplifies price extremes and turning points:
fisherTransform = 0.5 * math.log((1 + value1) / (1 - value1))
smoothedFisher = ta.ema(fisherTransform, fisherSmoothing)
The smoothed Fisher signal is then integrated with an exponential moving average to create a hybrid trend line that balances statistical precision with price-following behavior:
baseTrend = ta.ema(close, basePeriod)
fisherAdjustment = smoothedFisher * fisherSensitivity * close
fisherTrend = baseTrend + fisherAdjustment
To filter out false signals and adapt to market conditions, the system calculates dynamic threshold bands using volatility measurements:
dynamicRange = ta.atr(volatilityPeriod)
threshold = dynamicRange * volatilityMultiplier
upperThreshold = fisherTrend + threshold
lowerThreshold = fisherTrend - threshold
When price momentum pushes through these thresholds, the trend line locks onto the new level and maintains direction until the opposite threshold is breached:
if upperThreshold < trendLine
trendLine := upperThreshold
if lowerThreshold > trendLine
trendLine := lowerThreshold
🟢 Signal Interpretation
Bullish Candles (Green): indicate normalized price distribution favoring bulls with sustained buying momentum = Long/Buy opportunities
Bearish Candles (Red): indicate normalized price distribution favoring bears with sustained selling pressure = Short/Sell opportunities
Upper Band Zone: Area above middle level indicating statistically elevated trend strength with potential overbought conditions approaching mean reversion zones
Lower Band Zone: Area below middle level indicating statistically depressed trend strength with potential oversold conditions approaching mean reversion zones
Built-in Alert System: Automated notifications trigger when bullish or bearish states change, allowing you to act on significant developments without constantly monitoring the charts
Candle Coloring: Optional feature applies trend colors to price bars for visual consistency and clarity
Configuration Presets: Three parameter sets available - Default (balanced settings), Scalping (faster response with higher sensitivity), and Swing Trading (slower response with enhanced smoothing)
Color Customization: Four color schemes including Classic, Aqua, Cosmic, and Custom options for personalized chart aesthetics

Laguerre Filter Trend Navigator [QuantAlgo]🟢 Overview
The Laguerre Filter Trend Navigator employs advanced polynomial filtering mathematics to smooth price data while minimizing lag, creating a responsive yet stable trend-following system. Unlike simple moving averages that apply equal weight to historical data, the Laguerre filter uses recursive calculations with exponentially weighted polynomials to extract meaningful directional signals from noisy market conditions. Combined with dynamic volatility-adjusted boundaries, this creates an adaptive framework for identifying high-probability trend reversals and continuations across all tradable instruments and timeframes.
🟢 How It Works
The indicator leverages Laguerre polynomial filtering, a mathematical technique originally developed for digital signal processing applications. The core mechanism processes price data through four cascaded filter stages (L0, L1, L2, L3), each applying the gamma coefficient to recursively smooth incoming information while preserving phase relationships. This multi-stage architecture eliminates random fluctuations more effectively than traditional moving averages while responding quickly to genuine directional shifts.
The gamma coefficient serves as the primary smoothing control, determining how aggressively the filter dampens noise versus tracking price movements. Lower gamma values reduce smoothing and increase filter responsiveness, while higher values prioritize stability over reaction speed. Each filter stage compounds this effect, creating progressively smoother output that converges toward true underlying trend direction.
Surrounding the filtered price line, the algorithm constructs adaptive boundaries using dynamic volatility regime measurements. These calculations quantify current market turbulence independently of direction, expanding during active trading periods and contracting during quiet phases. By multiplying this volatility assessment by a user-defined scaling factor, the system creates self-adjusting bands that automatically conform to changing market conditions without manual intervention.
The trend-following engine monitors price position relative to these volatility-adjusted boundaries. When the upper band falls below the current trend line, the system shifts downward to track bearish momentum. Conversely, when the lower band rises above the trend line, it elevates to follow bullish movement. These crossover events trigger color transitions between bullish (green) and bearish (red) states, providing clear visual confirmation of directional changes validated by volatility-normalized thresholds.
🟢 How to Use
Green/Bullish Trend Line: Laguerre filter positioned in upward trajectory, indicating momentum-confirmed conditions favorable for establishing or maintaining long positions (buy)
Red/Bearish Trend Line: Laguerre filter trending downward, signaling regime-validated environment suitable for initiating or holding short positions (sell)
Rising Green Line: Accelerating bullish filter with expanding separation from price lows, demonstrating strengthening upward momentum and increasing confidence in trend persistence with optimal long entry timing
Declining Red Line: Steepening bearish filter creating growing distance from price highs, revealing intensifying downside pressure and enhanced probability of continued decline with favorable short positioning opportunities
Flattening Trends: Horizontal or oscillating filter movement regardless of color suggests directional uncertainty where price action contradicts filter positioning, potentially indicating consolidation phases or impending volatility expansion requiring cautious trade management
🟢 Pro Tips for Trading and Investing
→ Preset Selection Framework: Match presets to your trading style - Scalping preset employs aggressive gamma (0.4) with tight volatility bands (1.0x) for rapid signal generation on sub-15-minute charts, Day Trading preset balances responsiveness and stability for hourly timeframes, while Swing Trading preset maximizes smoothing (0.8 gamma) with wide bands (2.5x) to filter intraday noise on daily and weekly charts.
→ Gamma Coefficient Calibration: Adjust gamma based on market personality - reduce values (0.3-0.5) for highly liquid, fast-moving assets like major currency pairs and tech stocks where quick filter adaptation prevents lag-induced losses, increase values (0.7-0.9) for slower instruments or trending markets where excessive sensitivity generates false reversals and whipsaw trades.
→ Volatility Period Optimization: Tailor the volatility measurement window to information cycles. Deploy shorter lookback periods (7-10) for instruments with rapid regime changes like individual equities during earnings seasons, standard periods (14-20) for balanced assessment across general market conditions, and extended periods (21-30) for commodities and indices exhibiting persistent volatility characteristics.
→ Band Width Multiplier Adaptation: Scale boundary distance to current market phase. Contract multipliers (1.0-1.5) during range-bound consolidations to capture early breakout signals as soon as genuine momentum emerges, expand multipliers (2.0-3.0) during trending markets or high-volatility events to avoid premature exits caused by normal retracement activity rather than authentic reversals.
→ Multi-Timeframe Filter Alignment: Implement the indicator across multiple timeframes, using higher intervals (4H/Daily) to identify primary trend direction via filter slope and lower intervals (15min/1H) for precision entry timing when filter colors align, ensuring trades flow with dominant momentum while optimizing execution at favorable price levels.
→ Alert-Driven Systematic Execution: Configure trend change alerts to capture every filter-validated directional shift from bullish to bearish conditions or vice versa, enabling consistent signal response without continuous chart monitoring and eliminating emotional decision-making during critical transition moments.

Trade PullBack - EMA Pullback System with Auto Risk-Reward# Trade Pull Back - Professional Pullback Trading System
## 📊 Overview
**Trade Pull Back** is a comprehensive pullback trading system that combines trend-following principles with precise entry timing using candlestick pattern confirmation. This indicator is designed for traders who want to enter trending markets at optimal retracement levels with pre-calculated risk-reward ratios.
---
## 🎯 Core Methodology
### Why This System Works
Most traders struggle with two key challenges:
1. **Entering too early** - jumping into trades before the pullback completes
2. **Entering too late** - missing the momentum after the pullback reverses
This system solves both problems by using a **3-Phase Confirmation Process**:
**Phase 1: Trend Identification** → **Phase 2: Pullback Detection** → **Phase 3: Reversal Confirmation**
---
## 🔧 How It Works
### 1. Triple EMA Framework (The Foundation)
Unlike traditional single EMA systems, this indicator uses **3 separate EMAs** with different purposes:
- **EMA Trend (default: 50)** - Determines the overall market direction
- Source: HL/2 for balanced trend reading
- Acts as the primary filter - we only trade in its direction
- **EMA High (default: 20)** - Dynamic resistance in uptrends
- Source: High prices for accurate resistance mapping
- Entry trigger for bullish setups when price closes above it
- **EMA Low (default: 20)** - Dynamic support in downtrends
- Source: Low prices for accurate support mapping
- Entry trigger for bearish setups when price closes below it
**Why 3 EMAs?**
- Single EMA can't distinguish between trend and pullback zones
- Two EMAs (like MACD) don't provide clear entry/exit levels
- Three EMAs create a **channel system** that identifies both trend direction AND optimal entry zones
### 2. Pattern Recognition Engine
The system detects two high-probability reversal patterns:
#### Engulfing Patterns
- **Bullish Engulfing**: Previous bearish candle completely engulfed by bullish candle
- **Bearish Engulfing**: Previous bullish candle completely engulfed by bearish candle
- Validates: Strong momentum reversal with volume confirmation
#### Pin Bar Patterns
- **Bullish Pin Bar (Hammer)**: Long lower wick (60%+ of total range) rejecting lower prices
- **Bearish Pin Bar (Inverted Hammer)**: Long upper wick (60%+ of total range) rejecting higher prices
- Validates: Institutional rejection at support/resistance levels
**Pattern Quality Filter:**
- Body-to-wick ratio must meet minimum standards
- Checks previous candle momentum
- Requires trend alignment before signaling
### 3. Pullback Confirmation System
The system includes **5 mandatory conditions** before generating a signal:
#### For Bullish Signals (BUY):
1. ✅ Close > EMA Trend (uptrend confirmed)
2. ✅ EMA High > EMA Trend AND EMA Low > EMA Trend (healthy trend structure)
3. ✅ Bullish Engulfing OR Bullish Pin Bar (pattern detected)
4. ✅ Close > EMA High (breakout confirmation)
5. ✅ Optional: Low < EMA High (pullback occurred)
#### For Bearish Signals (SELL):
1. ✅ Close < EMA Trend (downtrend confirmed)
2. ✅ EMA High < EMA Trend AND EMA Low < EMA Trend (healthy trend structure)
3. ✅ Bearish Engulfing OR Bearish Pin Bar (pattern detected)
4. ✅ Close < EMA Low (breakdown confirmation)
5. ✅ Optional: High > EMA Low (pullback occurred)
**Additional Filters:**
- **Consecutive Bars Check**: Ensures pullback had momentum (1-5 bearish/bullish bars)
- **Signal Spacing**: Minimum 4 bars between signals to avoid noise
- **Confirmation Delay**: Signal appears only AFTER bar closes (no repainting)
---
## 💰 Automatic Risk-Reward Calculator
### Smart Position Sizing
When a signal triggers, the system automatically calculates:
**For Long Positions:**
- **Entry**: High of signal candle
- **Stop Loss**: Lower of last 2 candle lows (protects against false breakouts)
- **Target 1 (1R)**: Entry + 1x Risk
- **Target 2 (2R)**: Entry + 2x Risk
- **Target 3 (3R)**: Entry + 3x Risk
**For Short Positions:**
- **Entry**: Low of signal candle
- **Stop Loss**: Higher of last 2 candle highs
- **Targets**: Calculated based on risk multiple
### Auto-Remove Feature
Lines and labels automatically disappear when:
- Price hits Stop Loss (trade invalidated)
- Price reaches 3R target (trade complete)
This keeps your chart clean and focuses only on active trades.
---
## 📈 Multi-Timeframe Trend Analysis
### Confluence Trading
The built-in MTF trend box shows trend status across 7 timeframes simultaneously:
- M1, M5, M15, M30, H1, H4, D1
**Color Coding:**
- 🟢 **Green**: Uptrend (Price > EMA Trend AND EMAs aligned bullish)
- 🔴 **Red**: Downtrend (Price < EMA Trend AND EMAs aligned bearish)
- ⚪ **Gray**: No clear trend
**Why This Matters:**
- Trade with higher timeframe trends for better win rate
- Avoid counter-trend trades when all timeframes show same direction
- Identify divergences between timeframes for reversal opportunities
---
## 🎨 Customization Options
### EMA Settings
- Adjust periods for different trading styles (scalping vs swing trading)
- Choose price sources (HL/2, Close, HLC/3) for sensitivity tuning
### Pattern Selection
- Enable/disable Engulfing patterns
- Enable/disable Pin Bar patterns
- Trade only your preferred pattern type
### Signal Filters
- **Require Pullback**: Force pullback condition (stricter entries)
- **Consecutive Bars**: Set momentum requirement (1-5 bars)
### Display Options
- Show/hide EMA lines
- Show/hide signals
- Enable/disable alerts
- Customize Risk-Reward line styles and extensions
---
## 📋 How to Use This Indicator
### Step 1: Identify the Trend
- Wait for price to establish clear direction relative to EMA Trend (50)
- Check MTF box to confirm higher timeframe alignment
### Step 2: Wait for Pullback
- In uptrend: Watch for price to pull back toward EMA High
- In downtrend: Watch for price to pull back toward EMA Low
### Step 3: Pattern Confirmation
- Look for Engulfing or Pin Bar pattern (triangle/diamond markers)
- Ensure pattern forms at or near the EMA High/Low zone
### Step 4: Entry & Risk Management
- Enter when signal appears (after bar closes)
- Use displayed Stop Loss and Take Profit levels
- Consider partial profits at 1R and 2R, let remainder run to 3R
### Step 5: Trade Management
- If price hits SL, lines disappear automatically (trade invalidated)
- If price reaches 3R, lines disappear (trade complete)
- Consider trailing stop after 1R is reached
---
## ⚙️ Recommended Settings
### For Scalping (M1-M5)
- EMA Trend: 20-30
- EMA High/Low: 10-15
- Require Pullback: OFF
- Consecutive Bars: 1
### For Day Trading (M15-H1)
- EMA Trend: 50 (default)
- EMA High/Low: 20 (default)
- Require Pullback: ON
- Consecutive Bars: 2-3
### For Swing Trading (H4-D1)
- EMA Trend: 100-200
- EMA High/Low: 50
- Require Pullback: ON
- Consecutive Bars: 3-5
---
## ✅ What Makes This Script Original
### 1. Systematic Approach
This isn't just a collection of indicators. It's a **complete trading system** with:
- Defined entry rules (5-point confirmation checklist)
- Automatic risk management (SL/TP calculation)
- Trade validation (consecutive bars, signal spacing)
### 2. Smart EMA Framework
The 3-EMA system creates a **dynamic channel** that adapts to market conditions:
- Trend EMA = Direction filter
- High/Low EMAs = Entry/Exit zones
- Together they form a "trade zone" that standard EMAs can't provide
### 3. Pattern Quality Control
Not all Engulfing or Pin Bar patterns are equal. This system:
- Validates body-to-wick ratios
- Checks previous candle momentum
- Requires trend alignment before signaling
### 4. Auto Risk-Reward Management
Most indicators just show signals. This one:
- Calculates exact entry prices
- Places stop loss at optimal location (lower of 2 lows)
- Projects 3 profit targets based on risk
- Auto-removes when trade is complete/invalidated
### 5. No Repainting
- All signals appear AFTER bar closes
- No future data leaking
- What you see in backtest = what you get in real-time
---
## 🚨 Alerts
Built-in alerts notify you when:
- Bullish signal confirmed
- Bearish signal confirmed
Alerts fire once per bar (no spam) and only after bar closes (no false alerts).
---
## 📊 Best Practices
### ✅ DO:
- Trade in direction of higher timeframe trends
- Wait for full confirmation (all 5 conditions met)
- Use proper position sizing (1-2% risk per trade)
- Let winners run to at least 2R
### ❌ DON'T:
- Trade against major trend on MTF box
- Enter before signal bar closes
- Ignore the Stop Loss level
- Overtrade - respect the 4-bar minimum spacing
---
## 🔍 Limitations
This indicator is a **tool**, not a crystal ball:
- No indicator wins 100% of the time
- False signals occur in choppy/ranging markets
- Best results in trending conditions
- Requires proper risk management
- Should be combined with fundamental analysis and market context
---
## 📚 Educational Value
This script teaches:
- How to combine trend following with mean reversion
- Pattern recognition and validation
- Risk-reward ratio calculation
- Multi-timeframe analysis
- Proper trade entry timing
---
## 🎓 Credits & Disclaimer
**Original Work**: All code written from scratch
**Methodology**: Based on classical technical analysis principles (EMA crossovers, candlestick patterns, support/resistance)
**Disclaimer**: This indicator is for educational purposes. Past performance does not guarantee future results. Always practice proper risk management.
---
## 📞 Support
If you find this indicator helpful:
- Leave a review
- Share with fellow traders
- Provide feedback for improvements
**Note**: This is a closed-source script to protect the proprietary signal logic and filtering algorithms. The description above provides comprehensive understanding of the methodology without revealing exact implementation details.
---
**Version**: 1.0
**Pine Script Version**: 5
**Type**: Indicator (Overlay)
**Category**: Trend Following + Pattern Recognition
---
*Happy Trading! 🚀*
# 🇹🇭 คู่มือภาษาไทย / Thai Guide
# Trade Pull Back - คู่มือภาษาไทย
## 📊 ภาพรวม
**Trade Pull Back** เป็นระบบเทรด Pullback ที่ผสมผสานการเทรดตามเทรนด์กับการจับจังหวะเข้าออเดอร์ด้วย Candlestick Pattern พร้อมคำนวณ Risk-Reward อัตโนมัติ
---
## 🎯 หลักการทำงาน
### ทำไมระบบนี้ได้ผล?
แก้ปัญหา 2 ข้อหลักของเทรดเดอร์:
1. **เข้าเร็วเกินไป** - เข้าก่อน Pullback เสร็จ
2. **เข้าช้าเกินไป** - พลาดโมเมนตัมหลังกลับตัว
**วิธีแก้**: ใช้กระบวนการยืนยัน 3 ขั้นตอน
- **ขั้น 1**: ระบุเทรนด์ → **ขั้น 2**: ตรวจจับ Pullback → **ขั้น 3**: ยืนยันการกลับตัว
---
## 🔧 ส่วนประกอบหลัก
### 1. ระบบ EMA 3 เส้น
ต่างจาก EMA ทั่วไป ระบบนี้ใช้ 3 เส้นที่มีหน้าที่แยกกัน:
- **EMA Trend (50)** - กำหนดทิศทางเทรนด์หลัก
- **EMA High (20)** - แนวต้านไดนามิก (สำหรับ Buy)
- **EMA Low (20)** - แนวรับไดนามิก (สำหรับ Sell)
**ทำไมต้อง 3 เส้น?**
- 1 เส้น = แยกเทรนด์กับ Pullback ไม่ได้
- 2 เส้น = ไม่มีจุด Entry/Exit ชัดเจน
- 3 เส้น = สร้าง Channel ที่บอกทั้งเทรนด์และโซนเข้าออเดอร์
### 2. ตรวจจับ Pattern
ระบบตรวจจับ 2 Pattern หลัก:
**Engulfing (แท่งกลืน)**
- Bullish: แท่งเขียวกลืนแท่งแดงทั้งหมด
- Bearish: แท่งแดงกลืนแท่งเขียวทั้งหมด
**Pin Bar (แท่งหาง)**
- Bullish: หางล่างยาว 60%+ ของช่วงทั้งหมด
- Bearish: หางบนยาว 60%+ ของช่วงทั้งหมด
### 3. เงื่อนไขยืนยันสัญญาณ (5 ข้อ)
**สัญญาณ Buy:**
1. ✅ ราคาปิด > EMA Trend (เทรนด์ขาขึ้น)
2. ✅ EMA High และ Low เหนือ EMA Trend (โครงสร้างดี)
3. ✅ เกิด Bullish Engulfing หรือ Pin Bar
4. ✅ ราคาปิด > EMA High (ยืนยัน Breakout)
5. ✅ ตัวเลือก: มี Pullback มาแตะ EMA High
**สัญญาณ Sell:**
1. ✅ ราคาปิด < EMA Trend (เทรนด์ขาลง)
2. ✅ EMA High และ Low ใต้ EMA Trend (โครงสร้างดี)
3. ✅ เกิด Bearish Engulfing หรือ Pin Bar
4. ✅ ราคาปิด < EMA Low (ยืนยัน Breakdown)
5. ✅ ตัวเลือก: มี Pullback มาแตะ EMA Low
**ตัวกรองเพิ่มเติม:**
- ต้องมีแท่งติดกัน 1-5 แท่ง (กำหนดได้)
- ห่างสัญญาณก่อนหน้าอย่างน้อย 4 แท่ง
- สัญญาณปรากฏหลังแท่งปิดเท่านั้น (ไม่ Repaint)
---
## 💰 คำนวณ Risk-Reward อัตโนมัติ
เมื่อสัญญาณเกิด ระบบคำนวณให้อัตโนมัติ:
**Long Position:**
- Entry = High ของแท่งสัญญาณ
- Stop Loss = Low ที่ต่ำกว่าของ 2 แท่งล่าสุด
- Target = 1R, 2R, 3R
**Short Position:**
- Entry = Low ของแท่งสัญญาณ
- Stop Loss = High ที่สูงกว่าของ 2 แท่งล่าสุด
- Target = 1R, 2R, 3R
**ลบอัตโนมัติ:** เส้นหายเมื่อราคาชน SL หรือถึง 3R
---
## 📈 กล่องเทรนด์หลาย Timeframe
แสดงเทรนด์พร้อมกัน 7 Timeframe:
- M1, M5, M15, M30, H1, H4, D1
**สีแสดงผล:**
- 🟢 เขียว = Uptrend
- 🔴 แดง = Downtrend
- ⚪ เทา = ไม่มีเทรนด์
**ประโยชน์:** เทรดตาม Timeframe ใหญ่เพื่อเพิ่ม Win Rate
---
## 📋 วิธีใช้งาน (5 ขั้นตอน)
1. **ระบุเทรนด์** - เช็คราคาเทียบกับ EMA Trend และกล่อง MTF
2. **รอ Pullback** - เฝ้าราคา Pullback มาที่ EMA High/Low
3. **เช็ค Pattern** - มองหาลูกศรสามเหลี่ยม (Engulfing) หรือเพชร (Pin Bar)
4. **เข้าออเดอร์** - เข้าเมื่อสัญญาณปรากฏ ใช้ SL/TP ที่แสดง
5. **จัดการเทรด** - เส้นจะหายเองเมื่อชน SL หรือถึง 3R
---
## ⚙️ การตั้งค่าแนะนำ
**Scalping (M1-M5)**
- EMA Trend: 20-30
- EMA High/Low: 10-15
- Require Pullback: ปิด
**Day Trading (M15-H1)**
- EMA Trend: 50 (ค่าเริ่มต้น)
- EMA High/Low: 20 (ค่าเริ่มต้น)
- Require Pullback: เปิด
**Swing Trading (H4-D1)**
- EMA Trend: 100-200
- EMA High/Low: 50
- Require Pullback: เปิด
---
## ✅ จุดเด่นที่แตกต่าง
1. **เป็นระบบสมบูรณ์** - ไม่ใช่แค่รวม Indicator
2. **EMA 3 เส้นสร้าง Channel** - บอกทั้งเทรนด์และโซนเข้า
3. **ตรวจสอบคุณภาพ Pattern** - ไม่ใช่ทุก Pattern ที่ให้สัญญาณ
4. **คำนวณ RR อัตโนมัติ** - วาง SL/TP ให้เลย
5. **ไม่ Repaint** - สัญญาณปรากฏหลังแท่งปิดเท่านั้น
---
## 📊 ควรทำ / ไม่ควรทำ
### ✅ ควรทำ:
- เทรดตามเทรนด์ Timeframe ใหญ่
- รอยืนยันครบ 5 เงื่อนไข
- เสี่ยง 1-2% ต่อเทรด
- ปล่อยกำไรไปอย่างน้อย 2R
### ❌ ไม่ควรทำ:
- เทรดทวนเทรนด์ในกล่อง MTF
- เข้าก่อนแท่งปิด
- ละเลย Stop Loss
- เทรดบ่อยเกินไป
---
## 🔍 ข้อจำกัด
- ไม่มี Indicator ไหนชนะ 100%
- สัญญาณผิดพลาดเกิดในตลาด Sideways
- ผลดีสุดในตลาดที่มีเทรนด์ชัด
- ต้องใช้ Money Management
- ควรดูปัจจัยพื้นฐานประกอบ
---
## 🎓 คำเตือน
**Disclaimer**: อินดิเคเตอร์นี้สำหรับการศึกษา ผลในอดีตไม่รับประกันอนาคต ใช้ Risk Management ที่เหมาะสมเสมอ
---
**เวอร์ชั่น**: 1.0
**Pine Script**: v5
**ประเภท**: Indicator (Overlay)
*Happy Trading! 🚀*
## Screenshots
**Bearish Signals with Risk-Reward:**
! (drive.google.com)
**Bullish Signal with Risk-Reward:**
! (drive.google.com)
**Multi-Timeframe Trend Box:**
! (drive.google.com)
**Settings Panel:**
! (drive.google.com)

Pivot Trend Flow [BigBeluga]🔵 OVERVIEW
Pivot Trend Flow turns raw swing points into a clean, adaptive trend band. It averages recent pivot highs and lows to form two dynamic reference levels; when price crosses above the averaged highs, trend flips bullish and a green band is drawn; when it crosses below the averaged lows, trend flips bearish and a red band is drawn. During an uptrend the script highlights breakouts of previous pivot highs with ▲ labels, and during a downtrend it flags breakdowns of previous pivot lows with ▼ labels—making structure shifts and continuation signals obvious.
🔵 CONCEPTS
Pivot-Based Averages : Recent pivot highs/lows are collected and averaged to create smoothed upper/lower reference levels.
if not na(ph)
phArray.push(ph)
if not na(pl)
plArray.push(pl)
if phArray.size() > avgWindow
upper := phArray.avg()
phArray.shift()
if plArray.size() > avgWindow
lower := plArray.avg()
plArray.shift()
Trend State via Crosses : Close above the averaged-highs ⇒ bullish trend; close below the averaged-lows ⇒ bearish trend.
Trend Band : A colored band (green/red) is plotted and optionally filled to visualize the active regime around price.
Structure Triggers :
In bull mode the tool watches for prior pivot-high breakouts (▲).
In bear mode it watches for prior pivot-low breakdowns (▼).
🔵 FEATURES
Adaptive Trend Detection from averaged pivot highs/lows.
Clear Visuals : Green band in uptrends, red band in downtrends; optional fill for quick read.
Breakout/Breakdown Labels :
▲ marks breaks of previous pivot highs in uptrends
▼ marks breaks of previous pivot lows in downtrends
Minimal Clutter : Uses compact lines and labels that extend only on confirmation.
Customizable Colors & Fill for trend states and band styling.
🔵 HOW TO USE
Pivot Length : Sets how swing points are detected. Smaller = more reactive; larger = smoother.
Avg Window (pivots) : How many recent pivot highs/lows are averaged. Increase to stabilize the band; decrease for agility.
Read the Band :
Green band active ⇒ prioritize longs, pullback buys toward the band.
Red band active ⇒ prioritize shorts, pullback sells toward the band.
Trade the Triggers :
In bull mode, ▲ on a prior pivot-high break can confirm continuation.
In bear mode, ▼ on a prior pivot-low break can confirm continuation.
Combine with Context : Use HTF trend, S/R, or volume for confluence and to filter signals.
Fill Color Toggle : Enable/disable band fill to match your chart style.
🔵 CONCLUSION
Pivot Trend Flow converts swing structure into an actionable, low-lag trend framework. By blending averaged pivots with clean breakout/breakdown labels, it clarifies trend direction, timing, and continuation spots—ideal as a core bias tool or a confirmation layer in any trading system.

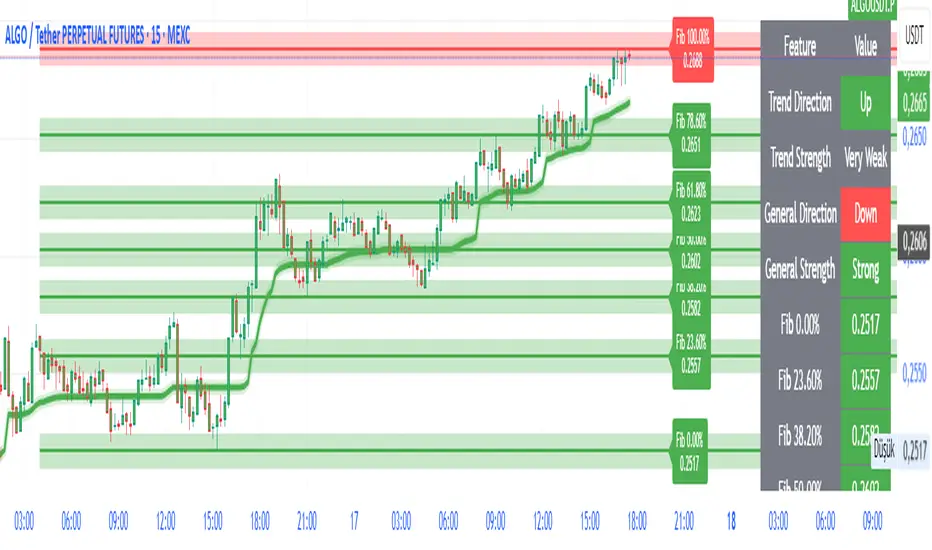
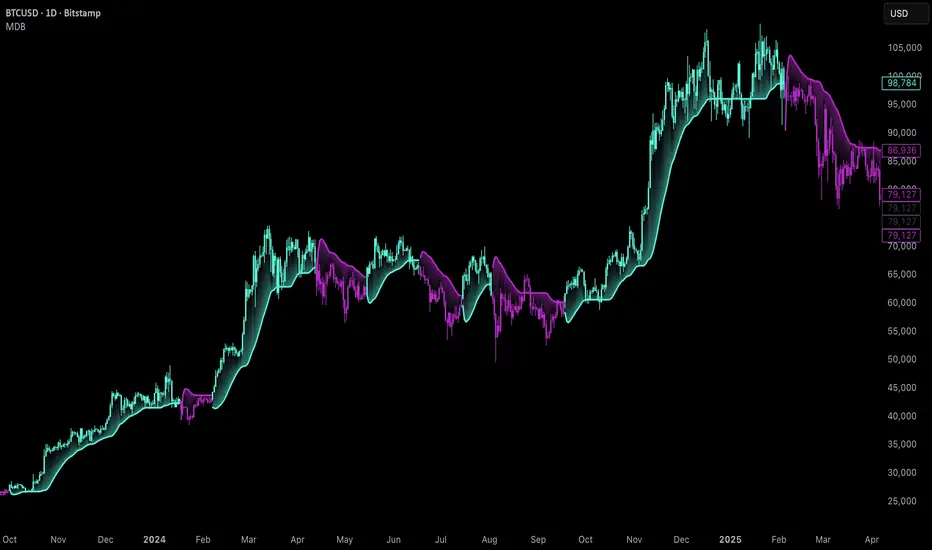
Uptrick: Majors Directional BiasOverview
Uptrick: Majors Directional Bias is a trend-following indicator designed for higher timeframe markets, with a particular focus on the daily chart. It keeps a persistent bullish or bearish stance, highlights confirmed trend flips with one-time markers, and plots a slim, adaptive flow trail that often acts as dynamic support in bullish conditions and resistance in bearish conditions. It is purpose-built for BTC, ETH, and SOL, with safeguards to warn users if applied elsewhere.
Introduction
This indicator was created to simplify trend tracking on higher timeframes. Rather than layering multiple moving averages, oscillators, or external signals, it keeps everything on the price chart itself. Candles are colored by the active stance, a single marker shows the bar where a trend flip is confirmed, and the flow trail follows price closely while adjusting to volatility. For traders working with the daily chart, the trail becomes a practical tool: in an uptrend, it often serves as a natural stop placement zone or structural support, while in a downtrend it behaves like dynamic resistance. The combination of persistence, confirmation, and structure gives traders a clean map of market direction without noise or clutter.
Purpose
The tool is designed to help traders follow medium to long-term market trends rather than react to short intraday moves. Its focus is clarity and continuity — it latches onto a stance and only changes when a new confirmed flip occurs. This makes it suitable for swing traders and position traders who want to stay aligned with the prevailing trend on the daily chart.
Practical uses include identifying trend shifts, entering trades in the direction of the new stance, managing positions by trailing stops along the flow trail, and monitoring pullbacks for whether they respect or break the trail. In this way, the indicator supports both entry timing and ongoing trade management on higher timeframe markets.
Originality and uniqueness
The originality of this script lies in its blend of complexity and simplicity. Internally, it uses multiple filters and layered components to reduce market noise, smooth out erratic fluctuations, and avoid false flips that are common on higher timeframes. Externally, the presentation is deliberately simple: candles are colored by trend, a single marker identifies each confirmed flip, and a slim trail with soft fills shows where the trend structure sits. Many tools either overload traders with information or flicker constantly in uncertain conditions. This script strikes a balance — complex logic works in the background, but what the trader sees is minimal and actionable. Its ability to filter out noise, persist with confidence, and present direction in the simplest terms makes it unique among trend-following overlays.
Why these components were merged
Each component has a clear role in supporting higher timeframe trading. Persistent bias coloring ensures the dominant trend is always visible, making it easy to stay aligned with the market. Flip markers give clarity by identifying the exact bar where the stance shifts, allowing traders to backtest or audit trends quickly. The flow trail provides a structural guide that adapts to volatility: in bull phases it runs under price, often acting as support, while in bear phases it runs above price, often behaving as resistance. Together, these features provide three layers of information in one view — direction, confirmation, and structure — giving traders a reliable framework for swing and position trading on the daily chart.
Step-by-Step
The script determines the dominant trend and locks that stance until an opposite confirmation occurs.
On confirmation of a new trend, a single marker prints on the bar of the flip.
A slim, adaptive trail plots under price in bull phases and above price in bear phases, with a soft fill to reinforce the state.
Price candles are colored by the active stance so the overall direction is always clear.
If the indicator is loaded on assets outside BTC, ETH, or SOL, a warning panel appears to set expectations.
Features
Persistent trend stance
Candles are always bull or bear, with no neutral state. This reduces ambiguity and keeps the trend visible at all times.
One-time flip markers
Markers plot once at the confirmed flip bar, preventing repetitive clutter and making historical review straightforward.
Adaptive flow trail with soft fill
The trail tracks price while adjusting to volatility. In bull trends it acts like dynamic support, in bear trends like dynamic resistance. Traders can use it as a practical stop-loss reference, trailing their risk along the line as the trend progresses.
Noise filtering logic
Internally, the indicator applies multiple filters and components to dampen false signals and avoid unnecessary flips. This is particularly important on higher timeframes, where swings are larger and stability is critical.
Asset-aware design
The indicator is tuned for BTC, ETH, and SOL, with an internal mode that adapts its responsiveness to each. A warning panel appears when used outside these majors.
Overlay-only clarity
Everything is drawn directly on the main chart. The trail gaps at regime changes, fills are soft and non-obstructive, and the overall design emphasizes readability on higher timeframe candles.
Conclusion
The MDB is a higher timeframe trend-following overlay built for BTC, ETH, and SOL, with daily charts as its ideal setting. It combines persistent bias coloring, one-time flip markers, and an adaptive flow trail to give traders direction, confirmation, and structure in the simplest possible form. Internally, it uses complex filtering to reduce noise and maintain reliable signals, but externally it stays minimal and clean. For swing and position traders who want to follow the daily trend with clarity and discipline, this indicator provides a focused solution.
Disclaimer
This indicator is provided for educational and informational purposes only and does not constitute financial advice. Trading involves risk, including the risk of loss. Past performance does not guarantee future results. Always conduct your own analysis and use appropriate risk management.
TF Sys-1Richard Dennis (Prince of the Pit) invested 1,600 dollar and reportedly made 350 Million dollars (within 10 years). The key is that, fortunes are caught by catching the big moves and catching them before they are plainly visible to the crowd.
This Trend Following Indicator combine both Trend Following Calculation and Stage Analysis to provide the clarity of trend direction and the complete plan how to trade by risking only 2%. It provides the position sizing, breakout location, stop loss and Pyramiding strategy (Conservative or Aggressive). I will provide a complete guide how to utilize the indicator and trend following Philosophy in my store in Whop.
Next time, when someone recommend any ticker you will see in which stage the ticker is and the breakout point. This indicator will not provide financial advice, it is a tool for decision making and your partner to achieve your goal (to be a successful trend following trader) where fortune lays.

Extended Majors Rotation System | AlphaNattExtended Majors Rotation System | AlphaNatt
A sophisticated cryptocurrency rotation system that dynamically allocates capital to the strongest trending major cryptocurrencies using multi-layered relative strength analysis and adaptive filtering techniques.
"In crypto markets, the strongest get stronger. This system identifies and rides the leaders while avoiding the laggards through mathematical precision."
━━━━━━━━━━━━━━━━━━━━━━━━━━━━━━━━━━━━━━━━
📊 SYSTEM OVERVIEW
The Extended Majors Rotation System (EMRS) is a quantitative momentum rotation strategy that:
Analyzes 10 major cryptocurrencies simultaneously
Calculates relative strength between all possible pairs (45 comparisons)
Applies fractal dimension analysis to identify trending behavior
Uses adaptive filtering to reduce noise while preserving signals
Dynamically allocates to the mathematically strongest asset
Implements multi-layer risk management through market regime filters
Core Philosophy:
Rather than trying to predict which cryptocurrency will perform best, the system identifies which one is already performing best relative to all others and maintains exposure until leadership changes.
━━━━━━━━━━━━━━━━━━━━━━━━━━━━━━━━━━━━━━━━
🎯 WHAT MAKES THIS SYSTEM UNEQUIVOCALLY UNIQUE
1. True Relative Strength Matrix
Unlike simple momentum strategies that look at individual asset performance, EMRS calculates the complete relative strength matrix between all assets. Each asset is compared against every other asset using fractal analysis, creating a comprehensive strength map of the entire crypto market.
2. Hurst Exponent Integration
The system employs the Hurst Exponent to distinguish between:
Trending behavior (H > 0.5) - where momentum is likely to persist
Mean-reverting behavior (H < 0.5) - where reversals are likely
Random walk (H ≈ 0.5) - where no edge exists
This ensures the system only takes positions when mathematical evidence of persistence exists.
3. Dual-Layer Filtering Architecture
Combines two advanced filtering techniques:
Laguerre Polynomial Filters: Provides low-lag smoothing with minimal distortion
Kalman-like Adaptive Smoothing: Adjusts filter parameters based on market volatility
This dual approach preserves important price features while eliminating noise.
4. Market Regime Awareness
The system monitors overall crypto market conditions through multiple lenses and only operates when:
The broad crypto market shows positive technical structure
Sufficient trending behavior exists across major assets
Risk conditions are favorable
5. Rank-Based Selection with Trend Confirmation
Rather than simply choosing the top-ranked asset, the system requires:
High relative strength ranking
Positive individual trend confirmation
Alignment with market regime
This multi-factor approach reduces false signals and whipsaws.
━━━━━━━━━━━━━━━━━━━━━━━━━━━━━━━━━━━━━━━━
🛡️ SYSTEM ROBUSTNESS & DEVELOPMENT METHODOLOGY
Pre-Coding Design Philosophy
This system was completely designed before any code was written . The mathematical framework, indicator selection, and parameter ranges were determined through:
Theoretical analysis of market microstructure
Study of persistence and mean reversion in crypto markets
Mathematical modeling of relative strength dynamics
Risk framework development based on regime theory
No Post-Optimization
Zero parameter fitting: All parameters remain at their originally designed values
No curve fitting: The system uses the same settings across all market conditions
No cherry-picking: Parameters were not adjusted after seeing results
This approach ensures the system captures genuine market dynamics rather than historical noise
Parameter Robustness Testing
Extensive testing was conducted to ensure stability:
Sensitivity Analysis: System maintains positive expectancy across wide parameter ranges
Walk-Forward Analysis: Consistent performance across different time periods
Regime Testing: Performs in both trending and choppy conditions
Out-of-Sample Validation
System was designed on a selection of 10 assets
System was tested on multiple baskets of 10 other random tokens, to simualte forwards testing
Performance remains consistent across baskets
No adjustments made based on out-of-sample results
━━━━━━━━━━━━━━━━━━━━━━━━━━━━━━━━━━━━━━━━
📈 PERFORMANCE METRICS DISPLAYED
The system provides real-time performance analytics:
Risk-Adjusted Returns:
Sharpe Ratio: Measures return per unit of total risk
Sortino Ratio: Measures return per unit of downside risk
Omega Ratio: Probability-weighted ratio of gains vs losses
Maximum Drawdown: Largest peak-to-trough decline
Benchmark Comparison:
Live comparison against Bitcoin buy-and-hold strategy
Both equity curves displayed with gradient effects
Performance metrics shown for both strategies
Visual representation of outperformance/underperformance
━━━━━━━━━━━━━━━━━━━━━━━━━━━━━━━━━━━━━━━━
🔧 OPERATIONAL MECHANICS
Asset Universe:
The system analyzes 10 major cryptocurrencies, customizable through inputs:
Bitcoin (BTC)
Ethereum (ETH)
Solana (SOL)
XRP
BNB
Dogecoin (DOGE)
Cardano (ADA)
Chainlink (LINK)
Additional majors
Signal Generation Process:
Calculate relative strength matrix
Apply Hurst Exponent analysis to each ratio
Rank assets by aggregate relative strength
Confirm individual asset trend
Verify market regime conditions
Allocate to highest-ranking qualified asset
Position Management:
Single asset allocation (no diversification)
100% in strongest trending asset or 100% cash
Daily rebalancing at close
No leverage employed in base system
━━━━━━━━━━━━━━━━━━━━━━━━━━━━━━━━━━━━━━━━
📊 VISUAL INTERFACE
Information Dashboard:
System state indicator (ON/OFF)
Current allocation display
Real-time performance metrics
Sharpe, Sortino, Omega ratios
Maximum drawdown tracking
Net profit multiplier
Equity Curves:
Cyan curve: System performance with gradient glow effect
Magenta curve: Bitcoin HODL benchmark with gradient
Visual comparison of both strategies
Labels indicating current values
Alert System:
Alerts fire when allocation changes
Displays selected asset symbol
"CASH" alert when system goes defensive
━━━━━━━━━━━━━━━━━━━━━━━━━━━━━━━━━━━━━━━━
⚠️ IMPORTANT CONSIDERATIONS
Appropriate Use Cases:
Medium to long-term crypto allocation
Systematic approach to crypto investing
Risk-managed exposure to cryptocurrency markets
Alternative to buy-and-hold strategies
Limitations:
Daily rebalancing required
Not suitable for high-frequency trading
Requires liquid markets for all assets
Best suited for spot trading (no derivatives)
Risk Factors:
Cryptocurrency markets are highly volatile
Past performance does not guarantee future results
System can underperform in certain market conditions
Not financial advice - for educational purposes only
━━━━━━━━━━━━━━━━━━━━━━━━━━━━━━━━━━━━━━━━
🎓 THEORETICAL FOUNDATION
The system is built on several academic principles:
1. Momentum Anomaly
Extensive research shows that assets exhibiting strong relative momentum tend to continue outperforming in the medium term (Jegadeesh & Titman, 1993).
2. Fractal Market Hypothesis
Markets exhibit fractal properties with periods of persistence and mean reversion (Peters, 1994). The Hurst Exponent quantifies these regimes.
3. Adaptive Market Hypothesis
Market efficiency varies over time, creating periods where momentum strategies excel (Lo, 2004).
4. Cross-Sectional Momentum
Relative strength strategies outperform time-series momentum in cryptocurrency markets due to the high correlation structure.
━━━━━━━━━━━━━━━━━━━━━━━━━━━━━━━━━━━━━━━━
💡 USAGE GUIDELINES
Capital Requirements:
Suitable for any account size
No minimum capital requirement
Scales linearly with account size
Implementation:
Can be traded manually with daily signals
Suitable for automation via alerts
Works with any broker supporting crypto
━━━━━━━━━━━━━━━━━━━━━━━━━━━━━━━━━━━━━━━━
📝 FINAL NOTES
The Extended Majors Rotation System represents a systematic, mathematically-driven approach to cryptocurrency allocation. By combining relative strength analysis with fractal market theory and adaptive filtering, it aims to capture the persistent trends that characterize crypto bull markets while avoiding the drawdowns of buy-and-hold strategies.
The system's robustness comes not from optimization, but from sound mathematical principles applied consistently. Every component was chosen for its theoretical merit before any backtesting occurred, ensuring the system captures genuine market dynamics rather than historical artifacts.
"In the race between cryptocurrencies, bet on the horse that's already winning - but only while the track conditions favour racing."
━━━━━━━━━━━━━━━━━━━━━━━━━━━━━━━━━━━━━━━━
Developed by AlphaNatt | Quantitative Rotation Systems
Version: 1.0
Strategy Type: Momentum Rotation
Classification: Systematic Trend Following
Not financial advice. Always DYOR.

Machine Learning Gaussian Mixture Model | AlphaNattMachine Learning Gaussian Mixture Model | AlphaNatt
A revolutionary oscillator that uses Gaussian Mixture Models (GMM) with unsupervised machine learning to identify market regimes and automatically adapt momentum calculations - bringing statistical pattern recognition techniques to trading.
"Markets don't follow a single distribution - they're a mixture of different regimes. This oscillator identifies which regime we're in and adapts accordingly."
━━━━━━━━━━━━━━━━━━━━━━━━━━━━━━━━━━━━━━━━
🤖 THE MACHINE LEARNING
Gaussian Mixture Models (GMM):
Unlike K-means clustering which assigns hard boundaries, GMM uses probabilistic clustering :
Models data as coming from multiple Gaussian distributions
Each market regime is a different Gaussian component
Provides probability of belonging to each regime
More sophisticated than simple clustering
Expectation-Maximization Algorithm:
The indicator continuously learns and adapts using the E-M algorithm:
E-step: Calculate probability of current market belonging to each regime
M-step: Update regime parameters based on new data
Continuous learning without repainting
Adapts to changing market conditions
━━━━━━━━━━━━━━━━━━━━━━━━━━━━━━━━━━━━━━━━
🎯 THREE MARKET REGIMES
The GMM identifies three distinct market states:
Regime 1 - Low Volatility:
Quiet, ranging markets
Uses RSI-based momentum calculation
Reduces false signals in choppy conditions
Background: Pink tint
Regime 2 - Normal Market:
Standard trending conditions
Uses Rate of Change momentum
Balanced sensitivity
Background: Gray tint
Regime 3 - High Volatility:
Strong trends or volatility events
Uses Z-score based momentum
Captures extreme moves
Background: Cyan tint
━━━━━━━━━━━━━━━━━━━━━━━━━━━━━━━━━━━━━━━━
💡 KEY INNOVATIONS
1. Probabilistic Regime Detection:
Instead of binary regime assignment, provides probabilities:
30% Regime 1, 60% Regime 2, 10% Regime 3
Smooth transitions between regimes
No sudden indicator jumps
2. Weighted Momentum Calculation:
Combines three different momentum formulas
Weights based on regime probabilities
Automatically adapts to market conditions
3. Confidence Indicator:
Shows how certain the model is (white line)
High confidence = strong regime identification
Low confidence = transitional market state
Line transparency changes with confidence
━━━━━━━━━━━━━━━━━━━━━━━━━━━━━━━━━━━━━━━━
⚙️ PARAMETER OPTIMIZATION
Training Period (50-500):
50-100: Quick adaptation to recent conditions
100: Balanced (default)
200-500: Stable regime identification
Number of Components (2-5):
2: Simple bull/bear regimes
3: Low/Normal/High volatility (default)
4-5: More granular regime detection
Learning Rate (0.1-1.0):
0.1-0.3: Slow, stable learning
0.3: Balanced (default)
0.5-1.0: Fast adaptation
━━━━━━━━━━━━━━━━━━━━━━━━━━━━━━━━━━━━━━━━
📊 TRADING STRATEGIES
Visual Signals:
Cyan gradient: Bullish momentum
Magenta gradient: Bearish momentum
Background color: Current regime
Confidence line: Model certainty
1. Regime-Based Trading:
Regime 1 (pink): Expect mean reversion
Regime 2 (gray): Standard trend following
Regime 3 (cyan): Strong momentum trades
2. Confidence-Filtered Signals:
Only trade when confidence > 70%
High confidence = clearer market state
Avoid transitions (low confidence)
3. Adaptive Position Sizing:
Regime 1: Smaller positions (choppy)
Regime 2: Normal positions
Regime 3: Larger positions (trending)
━━━━━━━━━━━━━━━━━━━━━━━━━━━━━━━━━━━━━━━━
🚀 ADVANTAGES OVER OTHER ML INDICATORS
vs K-Means Clustering:
Soft clustering (probabilities) vs hard boundaries
Captures uncertainty and transitions
More mathematically robust
vs KNN (K-Nearest Neighbors):
Unsupervised learning (no historical labels needed)
Continuous adaptation
Lower computational complexity
vs Neural Networks:
Interpretable (know what each regime means)
No overfitting issues
Works with limited data
━━━━━━━━━━━━━━━━━━━━━━━━━━━━━━━━━━━━━━━━
📈 PERFORMANCE CHARACTERISTICS
Best Market Conditions:
Markets with clear regime shifts
Volatile to trending transitions
Multi-timeframe analysis
Cryptocurrency markets (high regime variation)
Key Strengths:
Automatically adapts to market changes
No manual parameter adjustment needed
Smooth transitions between regimes
Probabilistic confidence measure
━━━━━━━━━━━━━━━━━━━━━━━━━━━━━━━━━━━━━━━━
🔬 TECHNICAL BACKGROUND
Gaussian Mixture Models are used extensively in:
Speech recognition (Google Assistant)
Computer vision (facial recognition)
Astronomy (galaxy classification)
Genomics (gene expression analysis)
Finance (risk modeling at investment banks)
The E-M algorithm was developed at Stanford in 1977 and is one of the most important algorithms in unsupervised machine learning.
━━━━━━━━━━━━━━━━━━━━━━━━━━━━━━━━━━━━━━━━
💡 PRO TIPS
Watch regime transitions: Best opportunities often occur when regimes change
Combine with volume: High volume + regime change = strong signal
Use confidence filter: Avoid low confidence periods
Multi-timeframe: Compare regimes across timeframes
Adjust position size: Scale based on identified regime
━━━━━━━━━━━━━━━━━━━━━━━━━━━━━━━━━━━━━━━━
⚠️ IMPORTANT NOTES
Machine learning adapts but doesn't predict the future
Best used with other confirmation indicators
Allow time for model to learn (100+ bars)
Not financial advice - educational purposes
Backtest thoroughly on your instruments
━━━━━━━━━━━━━━━━━━━━━━━━━━━━━━━━━━━━━━━━
🏆 CONCLUSION
The GMM Momentum Oscillator brings institutional-grade machine learning to retail trading. By identifying market regimes probabilistically and adapting momentum calculations accordingly, it provides:
Automatic adaptation to market conditions
Clear regime identification with confidence levels
Smooth, professional signal generation
True unsupervised machine learning
This isn't just another indicator with "ML" in the name - it's a genuine implementation of Gaussian Mixture Models with the Expectation-Maximization algorithm, the same technology used in:
Google's speech recognition
Tesla's computer vision
NASA's data analysis
Wall Street risk models
"Let the machine learn the market regimes. Trade with statistical confidence."
━━━━━━━━━━━━━━━━━━━━━━━━━━━━━━━━━━━━━━━━
Developed by AlphaNatt | Machine Learning Trading Systems
Version: 1.0
Algorithm: Gaussian Mixture Model with E-M
Classification: Unsupervised Learning Oscillator
Not financial advice. Always DYOR.

High Probability Order Blocks [AlgoAlpha]🟠 OVERVIEW
This script detects and visualizes high-probability order blocks by combining a volatility-based z-score trigger with a statistical survival model inspired by Kaplan-Meier estimation. It builds and manages bullish and bearish order blocks dynamically on the chart, displays live survival probabilities per block, and plots optional rejection signals. What makes this tool unique is its use of historical mitigation behavior to estimate and plot how likely each zone is to persist, offering traders a probabilistic perspective on order block strength—something rarely seen in retail indicators.
🟠 CONCEPTS
Order blocks are regions of strong institutional interest, often marked by large imbalances between buying and selling. This script identifies those areas using z-score thresholds on directional distance (up or down candles), detecting statistically significant moves that signal potential smart money footprints. A bullish block is drawn when a strong up-move (zUp > 4) follows a down candle, and vice versa for bearish blocks. Over time, each block is evaluated: if price “mitigates” it (i.e., closes cleanly past the opposite side and confirmed with a 1 bar delay), it’s considered resolved and logged. These resolved blocks then inform a Kaplan-Meier-like survival curve, estimating the likelihood that future blocks of a given age will remain unbroken. The indicator then draws a probability curve for each side (bull/bear), updating it in real time.
🟠 FEATURES
Live label inside each block showing survival probability or “N.E.D.” if insufficient data.
Kaplan-Meier survival curves drawn directly on the chart to show estimated strength decay.
Rejection markers (▲ ▼) if price bounces cleanly off an active order block.
Alerts for zone creation and rejection signals, supporting rule-based trading workflows.
🟠 USAGE
Read the label inside each block for Age | Survival% (or N.E.D. if there aren’t enough samples yet); higher survival % suggests blocks of that age have historically lasted longer.
Use the right-side survival curves to gauge how probability decays with age for bull vs bear blocks, and align entries with the side showing stronger survival at current age.
Treat ▲ (bullish rejection) and ▼ (bearish rejection) as optional confluence when price tests a boundary and fails to break.
Turn on alerts for “Bullish Zone Created,” “Bearish Zone Created,” and rejection signals so you don’t need to watch constantly.
If your chart gets crowded, enable Prevent Overlap ; tune Max Box Age to your timeframe; and adjust KM Training Window / Minimum Samples to trade off responsiveness vs stability.

Adaptive Trend Following Suite [Alpha Extract]A sophisticated multi-filter trend analysis system that combines advanced noise reduction, adaptive moving averages, and intelligent market structure detection to deliver institutional-grade trend following signals. Utilizing cutting-edge mathematical algorithms and dynamic channel adaptation, this indicator provides crystal-clear directional guidance with real-time confidence scoring and market mode classification for professional trading execution.
🔶 Advanced Noise Reduction
Filter Eliminates market noise using sophisticated Gaussian filtering with configurable sigma values and period optimization. The system applies mathematical weight distribution across price data to ensure clean signal generation while preserving critical trend information, automatically adjusting filter strength based on volatility conditions.
advancedNoiseFilter(sourceData, filterLength, sigmaParam) =>
weightSum = 0.0
valueSum = 0.0
centerPoint = (filterLength - 1) / 2
for index = 0 to filterLength - 1
gaussianWeight = math.exp(-0.5 * math.pow((index - centerPoint) / sigmaParam, 2))
weightSum += gaussianWeight
valueSum += sourceData * gaussianWeight
valueSum / weightSum
🔶 Adaptive Moving Average Core Engine
Features revolutionary volatility-responsive averaging that automatically adjusts smoothing parameters based on real-time market conditions. The engine calculates adaptive power factors using logarithmic scaling and bandwidth optimization, ensuring optimal responsiveness during trending markets while maintaining stability during consolidation phases.
// Calculate adaptive parameters
adaptiveLength = (periodLength - 1) / 2
logFactor = math.max(math.log(math.sqrt(adaptiveLength)) / math.log(2) + 2, 0)
powerFactor = math.max(logFactor - 2, 0.5)
relativeVol = avgVolatility != 0 ? volatilityMeasure / avgVolatility : 0
adaptivePower = math.pow(relativeVol, powerFactor)
bandwidthFactor = math.sqrt(adaptiveLength) * logFactor
🔶 Intelligent Market Structure Analysis
Employs fractal dimension calculations to classify market conditions as trending or ranging with mathematical precision. The system analyzes price path complexity using normalized data arrays and geometric path length calculations, providing quantitative market mode identification with configurable threshold sensitivity.
🔶 Multi-Component Momentum Analysis
Integrates RSI and CCI oscillators with advanced Z-score normalization for statistical significance testing. Each momentum component receives independent analysis with customizable periods and significance levels, creating a robust consensus system that filters false signals while maintaining sensitivity to genuine momentum shifts.
// Z-score momentum analysis
rsiAverage = ta.sma(rsiComponent, zAnalysisPeriod)
rsiDeviation = ta.stdev(rsiComponent, zAnalysisPeriod)
rsiZScore = (rsiComponent - rsiAverage) / rsiDeviation
if math.abs(rsiZScore) > zSignificanceLevel
rsiMomentumSignal := rsiComponent > 50 ? 1 : rsiComponent < 50 ? -1 : rsiMomentumSignal
❓How It Works
🔶 Dynamic Channel Configuration
Calculates adaptive channel boundaries using three distinct methodologies: ATR-based volatility, Standard Deviation, and advanced Gaussian Deviation analysis. The system automatically adjusts channel multipliers based on market structure classification, applying tighter channels during trending conditions and wider boundaries during ranging markets for optimal signal accuracy.
dynamicChannelEngine(baselineData, channelLength, methodType) =>
switch methodType
"ATR" => ta.atr(channelLength)
"Standard Deviation" => ta.stdev(baselineData, channelLength)
"Gaussian Deviation" =>
weightArray = array.new_float()
totalWeight = 0.0
for i = 0 to channelLength - 1
gaussWeight = math.exp(-math.pow((i / channelLength) / 2, 2))
weightedVariance += math.pow(deviation, 2) * array.get(weightArray, i)
math.sqrt(weightedVariance / totalWeight)
🔶 Signal Processing Pipeline
Executes a sophisticated 10-step signal generation process including noise filtering, trend reference calculation, structure analysis, momentum component processing, channel boundary determination, trend direction assessment, consensus calculation, confidence scoring, and final signal generation with quality control validation.
🔶 Confidence Transformation System
Applies sigmoid transformation functions to raw confidence scores, providing 0-1 normalized confidence ratings with configurable threshold controls. The system uses steepness parameters and center point adjustments to fine-tune signal sensitivity while maintaining statistical robustness across different market conditions.
🔶 Enhanced Visual Presentation
Features dynamic color-coded trend lines with adaptive channel fills, enhanced candlestick visualization, and intelligent price-trend relationship mapping. The system provides real-time visual feedback through gradient fills and transparency adjustments that immediately communicate trend strength and direction changes.
🔶 Real-Time Information Dashboard
Displays critical trading metrics including market mode classification (Trending/Ranging), structure complexity values, confidence scores, and current signal status. The dashboard updates in real-time with color-coded indicators and numerical precision for instant market condition assessment.
🔶 Intelligent Alert System
Generates three distinct alert types: Bullish Signal alerts for uptrend confirmations, Bearish Signal alerts for downtrend confirmations, and Mode Change alerts for market structure transitions. Each alert includes detailed messaging and timestamp information for comprehensive trade management integration.
🔶 Performance Optimization
Utilizes efficient array management and conditional processing to maintain smooth operation across all timeframes. The system employs strategic variable caching, optimized loop structures, and intelligent update mechanisms to ensure consistent performance even during high-volatility market conditions.
This indicator delivers institutional-grade trend analysis through sophisticated mathematical modelling and multi-stage signal processing. By combining advanced noise reduction, adaptive averaging, intelligent structure analysis, and robust momentum confirmation with dynamic channel adaptation, it provides traders with unparalleled trend following precision. The comprehensive confidence scoring system and real-time market mode classification make it an essential tool for professional traders seeking consistent, high-probability trend following opportunities with mathematical certainty and visual clarity.

LogPressure Envelope [BOSWaves]LogPressure Envelope – Adaptive Volatility & Trend Visualizer
Overview
LogPressure Envelope is a specialized trading tool designed to normalize market behavior using logarithmic price scaling while providing an adaptive framework for volatility and trend detection. The indicator calculates a log-based moving average midline, surrounds it with asymmetric volatility envelopes, and replaces the conventional cloud with progressive fan lines to present price action in a more interpretable form.
By integrating rate-of-change midline coloring, fading trend strength, and structured buy/sell markers, LogPressure Envelope simplifies the reading of complex market dynamics. Its design makes it suitable for multiple trading approaches, including scalping, intraday, and swing trading, where volatility behavior and trend shifts must be understood quickly and objectively.
Unlike static envelope indicators, LogPressure Envelope adapts continuously to price scale and volatility conditions. It evaluates log-transformed prices, applies configurable moving average methods (EMA, SMA, WMA), and derives asymmetric standard-deviation bands for both upside and downside moves. These envelopes are projected as fan lines with adjustable opacity, producing a layered volatility map that evolves with the market.
This system ensures each visual element—midline shading, candle coloring, fan structure, and signal markers—reflects real-time market conditions, allowing traders to interpret volatility expansion, contraction, and directional bias with clarity.
How It Works
The foundation of LogPressure Envelope is the logarithmic transformation of price. By operating in log space, the indicator removes distortions caused by large nominal price differences across assets, enabling consistent analysis of both low-priced and high-priced instruments.
A moving average of log prices is calculated (EMA, SMA, or WMA depending on user input) and then re-converted to normal price scale, forming the log midline. Standard deviation of log prices is then measured over a separate period, with independent multipliers for upside and downside deviations. This asymmetry captures the fact that markets often expand differently in bullish versus bearish phases.
Instead of plotting a filled cloud, the envelope is expressed as ten equidistant fan lines stretching from the lower to upper boundary. Each line is shaded progressively to visualize volatility clustering and directional strength without overloading the chart.
Trend determination is smoothed using a fade mechanism: shifts in bias do not flip instantly but gradually move toward the new state, producing fewer false transitions. Buy and sell markers are generated when trend strength crosses confirmation thresholds, ensuring signals are event-driven and contextually meaningful.
Signals and Visuals
LogPressure Envelope provides multiple layers of structured signals:
Midline Bias – Central moving average colored by rate-of-change, reflecting directional acceleration or deceleration.
Volatility Fan – Ten progressive lines forming a gradient between lower and upper bands, visually encoding volatility spread.
Buy Signals – Labels below bars when upward trend strength is confirmed.
Sell Signals – Labels above bars when downward trend strength is confirmed.
Candle Coloring – Optional shading of candles based on trend alignment with the log midline, highlighting bullish, bearish, or neutral conditions.
These signals remain clear even during high-volatility phases, with visual hierarchy maintained through progressive opacity control.
Interpretation
Trend Analysis : Midline direction and candle coloring provide continuous feedback on prevailing bias. Upward-sloping midlines with blue shading indicate bullish phases, while downward slopes with orange shading confirm bearish conditions.
Volatility and Risk Assessment : Expansion of fan lines indicates rising volatility and potential breakout conditions; contraction indicates consolidation and possible mean reversion.
Signal Confirmation : Buy and sell markers validate transitions when trend strength thresholds are crossed, aligning with volatility envelope dynamics.
Market Context : Asymmetric envelopes allow traders to see where bearish acceleration differs from bullish expansion, improving interpretation of liquidity conditions and institutional pressure.
Strategy Integration
LogPressure Envelope can be applied across trading styles:
Trend Following : Enter trades in the direction of midline bias, confirmed by buy or sell markers.
Pullback Entries : Use midline retests during trending conditions as lower-risk continuation points.
Volatility Breakouts : Identify sharp expansions in fan line spacing as early signals of directional moves.
Reversal Strategies : Fade extreme envelope touches when momentum shows exhaustion and fan contraction begins.
Multi-Timeframe Confirmation : Align signals from higher and lower timeframes to reduce noise and validate trade setups.
Stop-loss levels can be set near the opposite envelope boundary, while targets may be managed through progressive volatility zones or midline convergence.
Advanced Techniques
For greater precision, LogPressure Envelope can be combined with other analytical tools:
Pair with volume or liquidity measures to validate breakout or reversal conditions.
Use momentum indicators to confirm ROC-based midline bias.
Track sequences of fan line expansions and contractions to anticipate regime shifts in volatility.
Apply across multiple timeframes to monitor how volatility clusters align at different market scales.
Adjusting parameters such as envelope multipliers, moving average type, and fade bars allows the indicator to adapt to diverse asset classes and volatility environments.
Inputs and Customization
Midline Type : Select EMA, SMA, or WMA.
Line Opacity : Control visibility of fan lines.
Enable Candle Coloring : Toggle trend-based bar shading.
MA Length / StdDev Length : Define periods for midline and volatility calculation.
Multipliers : Set asymmetric scaling for upside and downside envelopes.
Fade Bars : Control smoothness of trend strength transitions.
Fan Lines : Adjust number of envelope subdivisions for visualization granularity.
Why Use LogPressure Envelope
LogPressure Envelope translates complex volatility and trend interactions into a structured and adaptive framework. By combining logarithmic normalization, asymmetric standard deviation envelopes, and smoothed trend confirmation, it allows traders to:
Normalize price analysis across assets of different scales.
Visualize volatility expansion and contraction in real time.
Identify and confirm directional shifts with objective signal markers.
Apply a disciplined system for trend, breakout, and reversal strategies.
This indicator is designed for traders who want a systematic, visually clear approach to volatility-based market analysis without relying on static bands or arbitrary scaling.
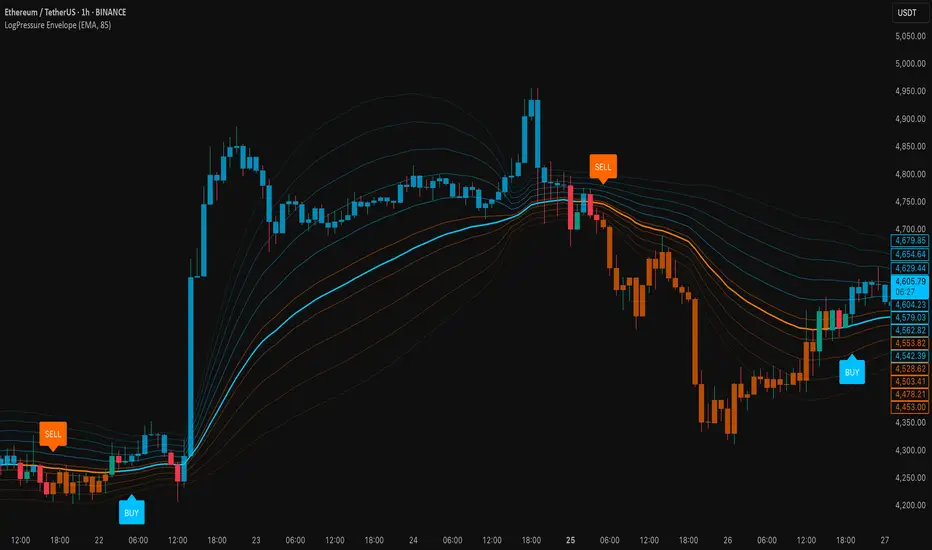
Pasrsifal.RegressionTrendStateSummary
The Parsifal.Regression.Trend.State Indicator analyzes the leading coefficients of linear and quadratic regressions of price (against time). It also considers their first- and second-order changes. These features are aggregated into a Trend-State background, shown as a gradient color. In addition, the indicator generates fast and slow signals that can be used as potential entry- or exit triggers.
This tool is designed for advanced trend-following strategies, leveraging information from multiple trendline features.
Background
Trendlines provide insight into the state of a trend or the “trendiness” of a price process. While moving averages or pivot-based lines can serve as envelopes and breakout levels, they are often too lagging for swing traders, who need tools that adapt more closely to price swings, ideally using trendlines, around which the price process swings continuously.
Regression lines address this by cutting directly through the data, making them a natural anchor for observing how price winds around a central trendline within a chosen lookback period.
Regression Trendlines
• Linear Regression:
o Minimizes distance to all closing values over the lookback period.
o The slope represents the short-term linear trend.
o The change of slope indicates trend acceleration or deceleration.
o Linear regression lags during phases of rapid market shifts.
• Quadratic Regression:
o Fits a second-degree polynomial to minimize deviation from closing prices.
o The convexity term (leading coefficient) reflects curvature:
Positive convexity → accelerating uptrend or fading downtrend.
Negative convexity → accelerating downtrend or fading uptrend.
o The change of convexity detects early shifts in momentum and often reacts faster than slope features.
Features Extracted
The indicator evaluates six features:
• Linear features: slope, first derivative of slope, second derivative of slope.
• Quadratic features: convexity term, first derivative of the convexity term, second derivative of the convexity term.
• Linear features: capture broad, background trend behavior.
• Quadratic features: detect deviations, accelerations, and smaller-scale dynamics.
Quadratic terms generally react first to market changes, while linear terms provide stability and context.
Dynamics of Market Moves as seen by linear and quadratic regressions
• At the start of a rapid move:
The change of convexity reacts first, capturing the shift in dynamics before other features. The convexity term then follows, while linear slope features lag further behind. Because convexity measures deviation from linearity, it reflects accelerating momentum more effectively than slope.
• At the end of a rapid move:
Again, the change of convexity responds first to fading momentum, signaling the transition from above-linear to below-linear dynamics. Even while a strong trend persists, the change of convexity may flip sign early, offering a warning of weakening strength. The convexity term itself adjusts more slowly but may still turn before the price process does. Linear features lag the most, typically only flipping after price has already reversed, thereby smoothing out the rapid, more sensitive reactions of quadratic terms.
________________________________________
Parsifal Regression.Trend.State Method
1. Feature Mapping:
Each feature is mapped to a range between -1 and 1, preserving zero-crossings (critical for sign interpretation).
2. Aggregation:
A heuristic linear combination*) produces a background information value, visualized as a gradient color scale:
o Deep green → strong positive trend.
o Deep red → strong negative trend.
o Yellow → neutral or transitional states.
3. Signals:
o Fast signal (oscillator): ranges from -1 to 1, reflecting short-term trend state.
o Slow signal (smoothed): moving average of the fast signal.
o Their interactions (crossovers, zero-crossings) provide actionable trading triggers.
How to Use
The Trend-State background gradient provides intuitive visual feedback on the aggregated regression features (slope, convexity, and their changes). Because these features reflect not only current trend strength but also their acceleration or deceleration, the color transitions help anticipate evolving market states:
• Solid Green: All features near their highs. Indicates a strong, accelerating uptrend. May also reflect explosive or hyperbolic upside moves (including gaps).
• Fading Solid Green: A recently strong uptrend is losing momentum. Price may shift into a slower uptrend, consolidation, or even a reversal.
• Fading Green → Yellow: Often appears as a dirty yellow or a rapidly mixing pattern of green and red. Signals that the uptrend is weakening toward neutrality or beginning to turn negative.
• Yellow → Deepening Red: Two possible scenarios:
o Coming from a strong uptrend → suggests a sharp fade, though the trend may still technically be up.
o Coming from a weaker uptrend or sideways market → suggests the start of an accelerating downtrend.
• Solid Red: All features near their lows. Indicates a strong, accelerating downtrend. May also reflect crash-type conditions or downside gaps.
• Fading Solid Red: A recently strong downtrend is losing strength. Market may move into a slower decline, consolidation, or early reversal upward.
• Fading Red → Yellow : The downtrend is weakening toward neutral, with potential for a bullish shift.
• Yellow → Increasing Green: Two possible scenarios:
o Coming from a strong downtrend, it reflects a sharp fade of bearish momentum, though the market may still technically be trending down.
o Coming from a weaker downtrend or sideways movement, it suggests the start of an accelerating uptrend.
Note: Market evolution does not always follow this neat “color cycle.” It may jump between states, skip stages, or reverse abruptly depending on market conditions. This makes the background coloring particularly valuable as a contextual map of current and evolving price dynamics.
Signal Crossovers:
Although the fast signal is very similar (but not identical) to the background coloring, it provides a numerical representation indicating a bullish interpretation for rising values and bearish for falling.
o High-confidence entries:
Fast signal rising from < -0.7 and crossing above the slow signal → potential long entry.
Fast signal falling from > +0.7 and crossing below the slow signal → potential short entry.
o Low-confidence entries:
Crossovers near zero may still provide a valid trigger but may be noisy and should be confirmed with other signals.
o Zero-crossings:
Indicate broader state changes, useful for conservative positioning or option strategies. For confirmation of a Fast signal 0-crossing, wait for the Slow signal to cross as well.
________________________________________
*) Note on Aggregation
While the indicator currently uses a heuristic linear combination of features, alternatives such as Principal Component Analysis (PCA) could provide a more formal aggregation. However, while in the absence of matrix algebra, the required eigenvalue decomposition can be approximated, its computational expense does not justify the marginal higher insight in this case. The current heuristic approach offers a practical balance of clarity, speed, and accuracy.

Reverse RSI Signals [AlgoAlpha]🟠 OVERVIEW
This script introduces the Reverse RSI Signals system, an original approach that inverts traditional RSI values back into price levels and then overlays them directly on the chart as dynamic bands. Instead of showing RSI in a subwindow, the script calculates the exact price thresholds that correspond to common RSI levels (30/70/50) and displays them as upper, lower, and midline bands. These are further enhanced with an adaptive Supertrend filter and divergence detection, allowing traders to see overbought/oversold zones translated into actionable price ranges and trend signals. The script combines concepts of RSI inversion, volatility envelopes, and divergence tracking to provide a context-driven tool for spotting reversals and regime shifts.
🟠 CONCEPTS
The script relies on inverting RSI math: by solving for the price that would yield a given RSI level, it generates real chart levels tied to oscillator conditions. These RSI-derived price bands act like support/resistance, adapting each bar as RSI changes. On top of this, a Supertrend built around the RSI midline introduces directional bias, switching regimes when the midline is breached. Regular bullish and bearish divergences are detected by comparing RSI pivots against price pivots, highlighting early reversal conditions. This layered approach means the indicator is not just RSI on price but a hybrid of oscillator translation, volatility-tracking midline envelopes, and divergence analysis.
🟠 FEATURES
Inverted RSI bands: upper (70), lower (30), and midline (50), smoothed with EMA for noise reduction.
Supertrend overlay on the RSI midline to confirm regime direction (bullish or bearish).
Gradient-filled zones between outer and inner RSI bands to visualize proximity and exhaustion.
Non-repainting bullish and bearish divergence markers plotted directly on chart highs/lows.
🟠 USAGE
Apply the indicator to any chart and use the plotted RSI price bands as adaptive support/resistance. The midline defines equilibrium, while upper and lower bands represent classic RSI thresholds translated into real price action. In bullish regimes (green candles), long trades are stronger when price approaches or bounces from the lower band; in bearish regimes (red candles), shorts are favored near the upper band. Divergence markers (▲ for bullish, ▼ for bearish) flag potential reversal points early. Traders can combine the band proximity, divergence alerts, and Supertrend context to time entries, exits, or to refine ongoing trend trades. Adjust smoothing and Supertrend ATR settings to match the volatility of the instrument being analyzed.

FibroTrend Matrix Premium [By TraderMan]📊 FibroTrend Matrix Premium
FibroTrend Matrix Premium is a powerful multi-timeframe trend and Fibonacci analysis tool. It combines trend direction, trend strength, and key Fibonacci levels into a single, clean interface with a dynamic table. Perfect for traders who want to see the market structure at a glance.
🧠 How It Works
Trend Detection 📈📉
Uses EMA-based dynamic bands to determine current trend direction.
Computes trend strength using slope of the trend line vs. price deviation.
Works on multiple timeframes (5m, 15m, 30m, 1h, 4h, 1D) for overall market context.
Fibonacci Levels & Zones 🔢
Automatically draws key Fibonacci retracement levels (0, 0.236, 0.382, 0.5, 0.618, 0.786, 1.0).
Adds zones around levels for potential support/resistance areas.
Labels are small and clear, lines slightly thicker for better visibility.
Trend Table Summary 📊
Shows current trend direction, strength, and general trend across multiple timeframes.
Fibonacci levels are included in the table with color-coded cells (green = bullish, red = bearish).
⚡ How to Use / Trading Logic
Identify Trend Direction
Uptrend (Green/“Up”) → look for buying opportunities.
Downtrend (Red/“Down”) → look for selling/shorting opportunities.
Neutral → wait or stay out.
Check Trend Strength
Very Strong / Strong (Green) → trend likely to continue.
Weak / Very Weak (Red) → trend may reverse or be choppy.
Use Fibonacci Levels for Entry & Exit
Enter near support zones in an uptrend.
Enter near resistance zones in a downtrend.
Use zone width & tolerance to set stop-loss or take-profit.
Multi-Timeframe Confirmation ✅
Ensure majority of timeframes confirm trend direction for stronger signal.
Example: if 5 out of 6 timeframes show Uptrend, trend is strong.
💡 Tips
Combine with volume, momentum, or RSI for extra confirmation.
Avoid trading solely on Fibonacci levels; use trend + strength table as main guide.
Works well for swing trading, intraday, and crypto markets.
🎯 Entry Example
Price is in an uptrend (green bars, line up).
Fibonacci retracement 0.382 aligns with support zone.
Trend strength = Strong or Very Strong.
Enter Long near zone, set stop-loss slightly below zone, take-profit near next Fibonacci level.