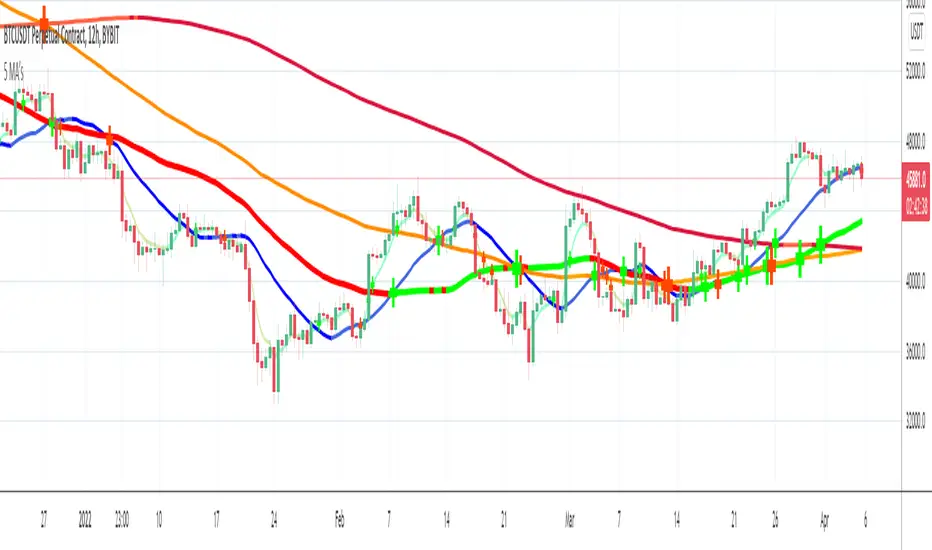
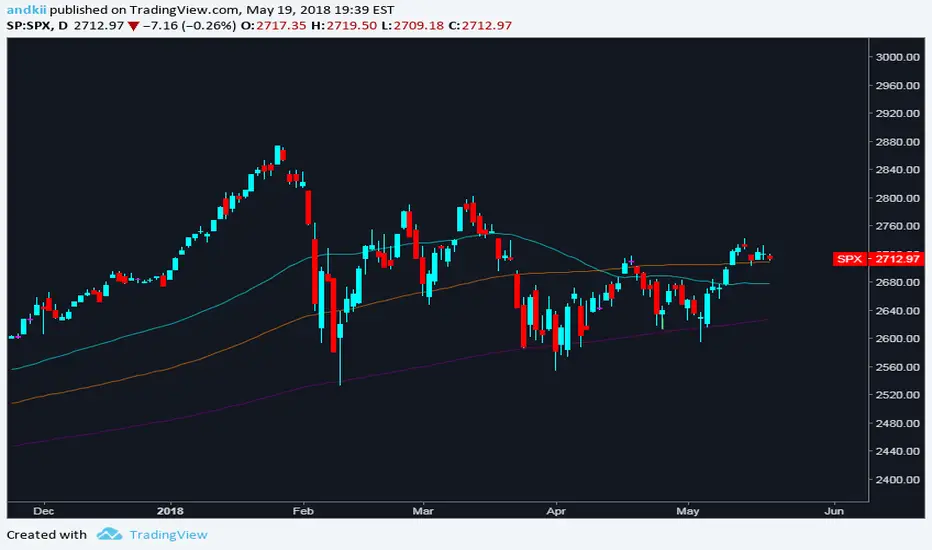
5 Definable Multiple Moving AveragesLets you select up to 5 SMA, EMA, HMA, of whatever length, source, and optional marks on their turning points. Saves on multiple indicators.
Sma
Multiple moving averages EMA and SMA (up to 4 each)Simple script lets you add multiple moving averages under one indicator. Up o 4 EMAs and 4 simple MAs. Specify the time frames for each one individual, and turn off the ones you don't need under "Style" tab in settings. Have fun.

Reap Hull SMA CrossoverHi this is my first script, it is a HMA 144 crossover with SMA 5 changes background (still needs work), provides alerts for crossover

3riple Moving AverageBITFINEX:ETHUSD
Description:
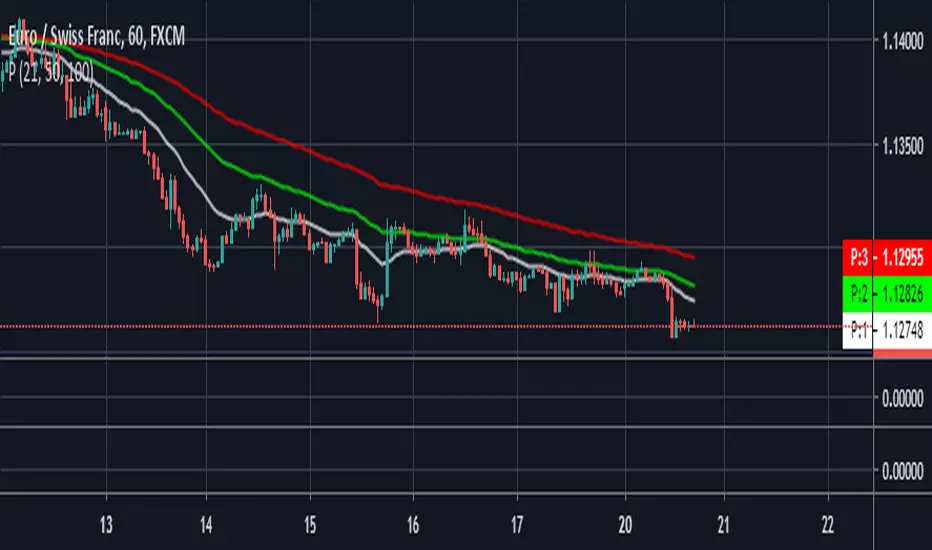
Mixing three Simple Moving Averages (7 - 20 - 65) to determine "uptrends" and "downtrends".
Uptrend: When the 7 Line is upper than 20, And 20 Line is upper than 65 that usually means the price is trending up.
Downtrend: When the 7 Line is lower than 20, And 20 Line is lower than 65 that usually means the price is trending down.


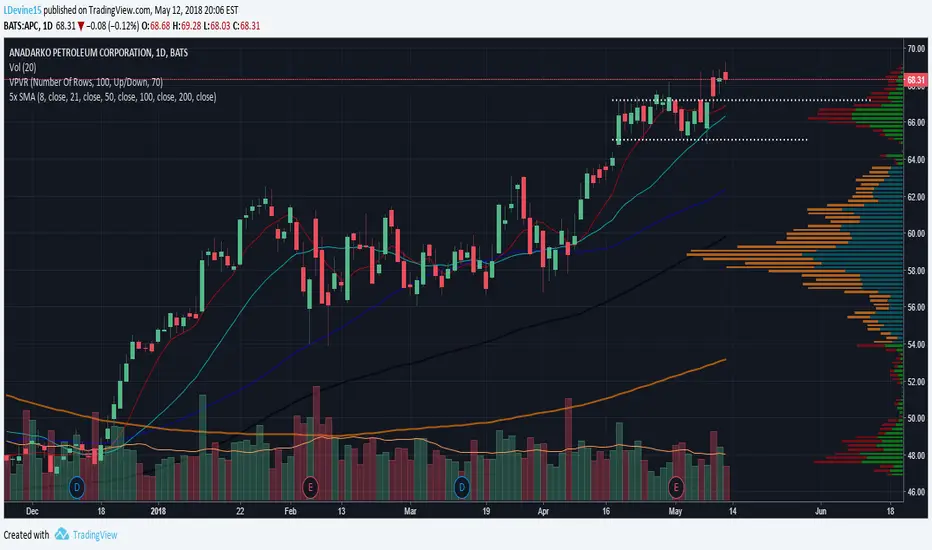
Simple Moving Averages (7, 30, 50, 100, 200)7, 30, 50, 100, 200 simple moving averages, bundled in one indicator (for users who are using the free TradingView service and can only load limited number of indicators at any given time).
You can turn each moving average on or off at will and change the colors.

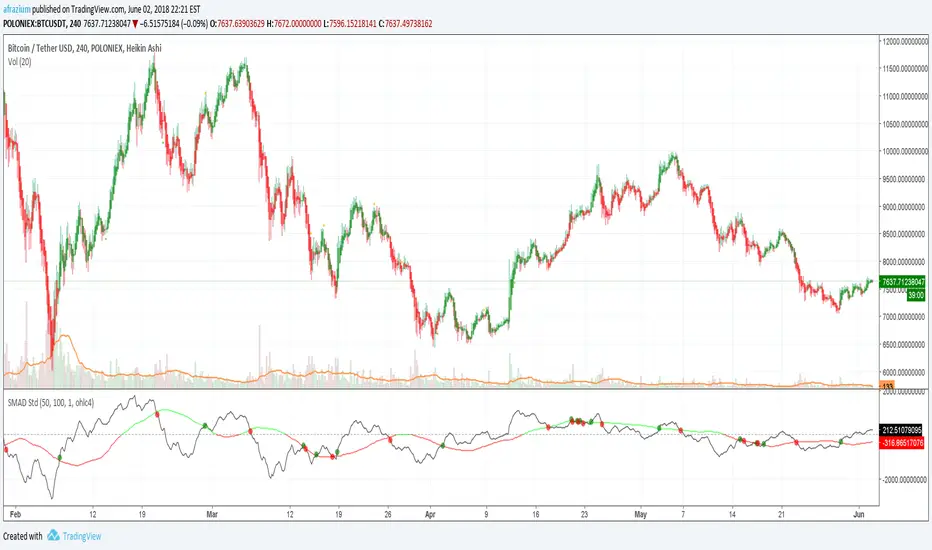
SMA Diff StdHello Tradingviewers
I don’t claim that anything I share is original, but I will never intentionally steal someone else’s work other than using plug and play pieces of code that are shared publicly because that’s how I’m learning to code in the first place
I started learning to trade and code on this very platform few months ago, AKA noob on both fronts and I still am. Many thanks to those of you who share their ideas, studies and strategies with us for free. I personally owe you most of what I know trading-related
Long story short, I ended up experimenting with all different kinds of code, some of it has no kind of logic behind it at least for me, but the results are somehow interesting, that’s why I thought about sharing them, also it is fun anyway 😊
--------------------------------------------------------------------------
Indicator info:
- Alert conditions implemented “autoview friendly”
- Use Heikin Ashi candles for better smoothing
- WARNING: Avoid use in a bear market
Any kind of feedback is appreciated, coding advice and such…
Feel free to use and share but please no commercial use. Happy trading everyone
--------------------------------------------------------------------------
As crypto is my only source of income, donations are most welcome if any of my work prove useful to you. Just a cup of tea that is
ETH/TUSD: 0xc66c009140553ef5dec23045399d9dcfddd096a5
LTC: LW4TP527c3HK6FnewXRZt3i6jnrhAynJMA
XVG: DE7uD66rYdmpqe4Fd3MxsXv7F1kNfCrzLk
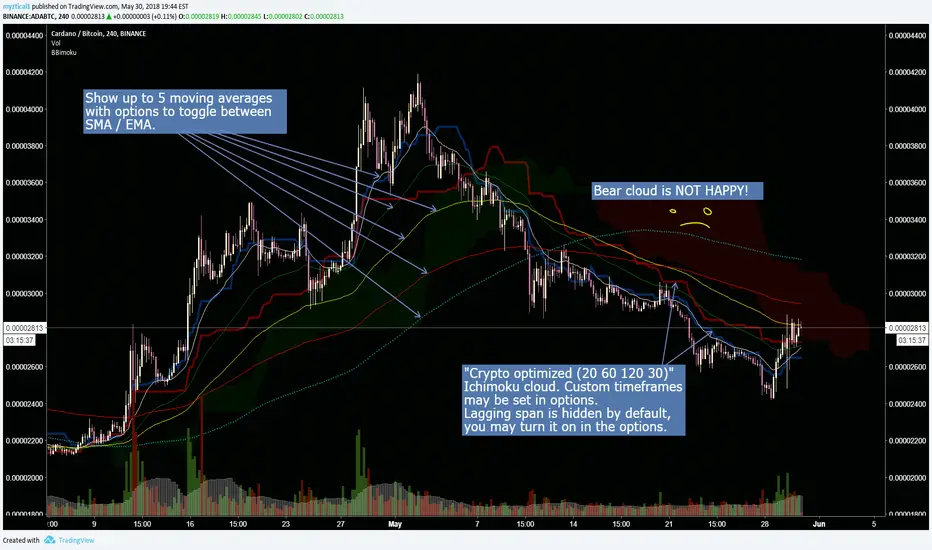
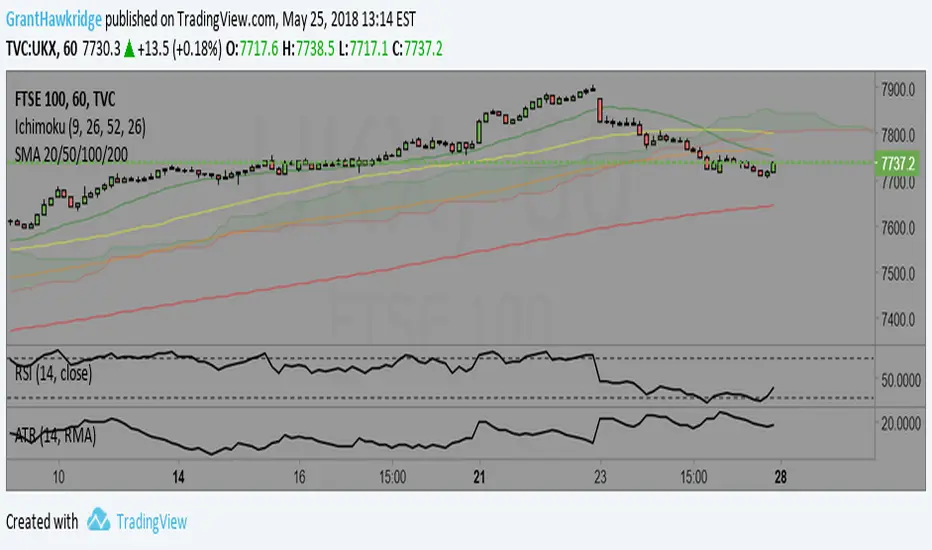
Crypto optimized Ichimoku and 5 variable SMA / EMAThis script has the option for showing up to 5 moving averages with options to toggle between SMA / EMA. Also includes crypto optimized Ichimoku cloud.
********This script was pieced together from various other's contributions from this site, and I cannot remember who the original authors are*******
Im just combining them to help others with free accounts and limited indicator availability like myself.
I hope this can help someone! Thank you and enjoy.

5 in 1 Colored SMA or EMAThis indicator displays 5 EMA’s or SMA’s that change color with the trend without needing to use up 5 charting indicators individually.
SMA Guppy (Prophet)Guppy using SMAs instead of EMAs.
SMAs commonly act as support/resistance.
Using this along with an EMA guppy gives a good trend analysis along with potential stops/targets.

Quadruple Moving Averages4 moving averages in one packages for convenience :) each customizable as simple (SMA) or exponential (EMA).
Enjoy.
SMA/EMA 12|26|50SMA/EMA 12|26|50
Exactly as title says
SMA is bold
EMA is light
Orange 12
Green 26
Blue 50

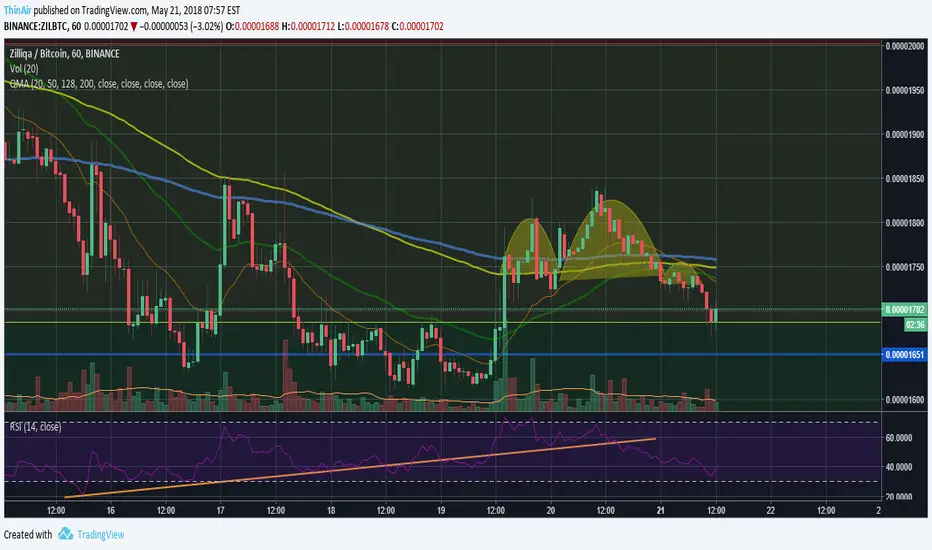
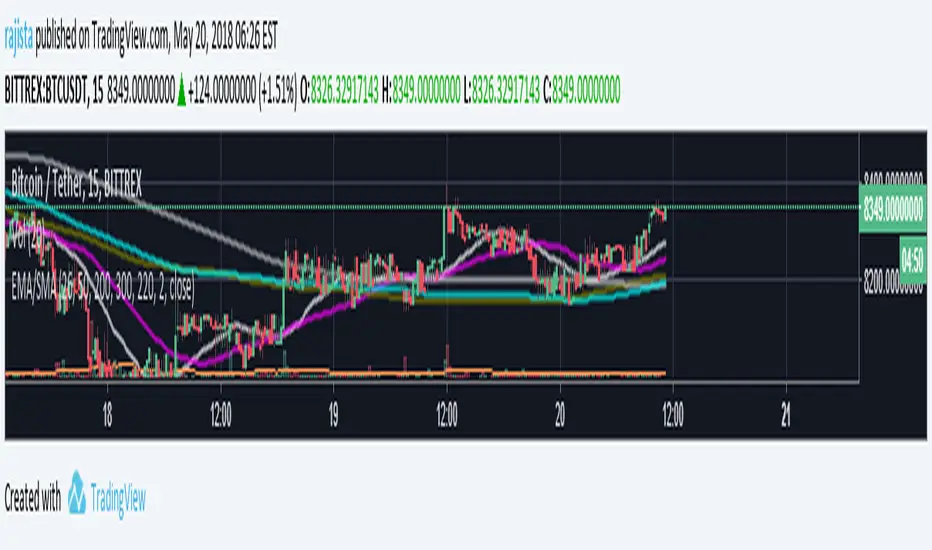
5 EMA/SMA with 8digit precision & line widthThis is a comno of 5 different EMA & SMA combined into one indicator with 8 digit precision specially designed to analyse altcoin values in satoshis .
From the setting panel you can change the values of the SMA's , EMA's , choose the line width that you want and from the style tab under settings panel you can change the colors of that you want and then save your chart layout, so that you dont need to change the colors again and again.
Triple EMA-by pooyaPublished by POOYAMONTOYA
This is a triple moving average with optional inputs in one oscillator
For more information and use our platform please contact us
Fibonacci Based Three Simple Moving AveragesSimple Moving Averages 55
Simple Moving Averages 144
Simple Moving Averages 233

Fibonacci Based Three Simple Moving AveragesSimple Moving Averages 55
Simple Moving Averages 144
Simple Moving Averages 233

Four Simple Moving AveragesFour Simple Moving Averages combined into one indicator.
For customization DM