SMI BarsUses SMI (Stochastic Momentum Index) to set bar colors:
When SMI above overbought, bar color is red.
When SMI is between 0 and overbought, bar color is maroon
When SMI is between oversold and 0, bar color is green
When SMI is below oversold, bar color is lime.
When SMI crosses above or below 0, bar color is orange.
Wyszukaj w skryptach "stoch"

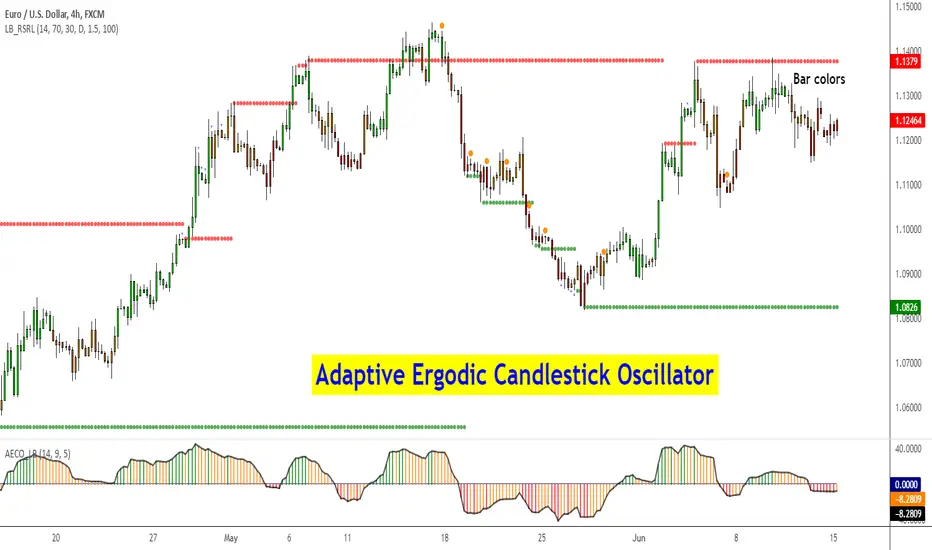
Adaptive Ergodic Candlestick Oscillator [LazyBear]This updates Blau's excellent Candlestick oscillator to be adaptive by using the length of a scaled stochastic indicator and an exponent (for calculating the smoothing coefficient) to obtain the moving average.
Check out the options page for configurable variables.
More info on Ergodic Oscillator:
Book: "Momentum, Direction and Divergence" by William Blau
List of my public indicators: bit.ly
List of my app-store indicators: blog.tradingview.com
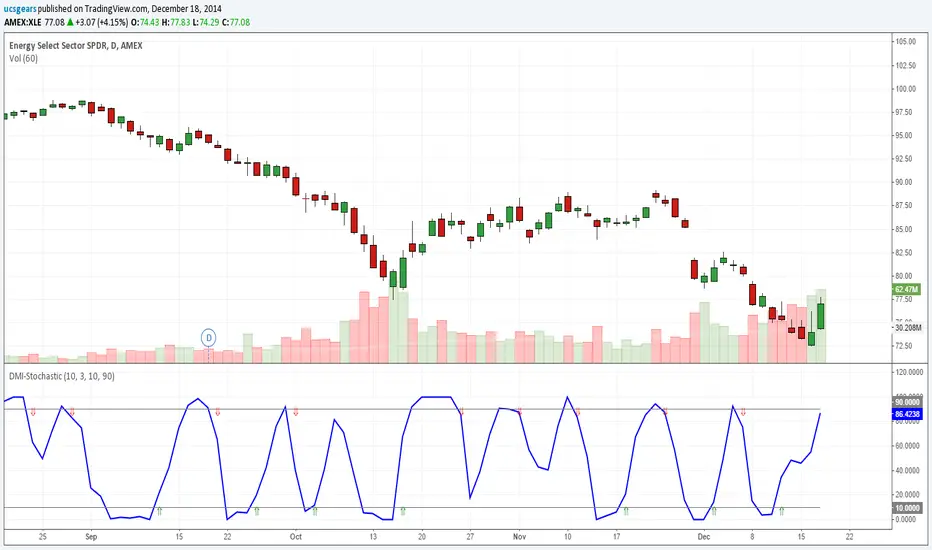
DMI Stochastic Extereme - Version 2Version 2 Includes
Custom setting for the Oversold and Overbought Levels
Replaced B and S with arrows
Cleaned up the code and finalized the indicator.
*Unless there is a real need, this indicator will not be revised further.

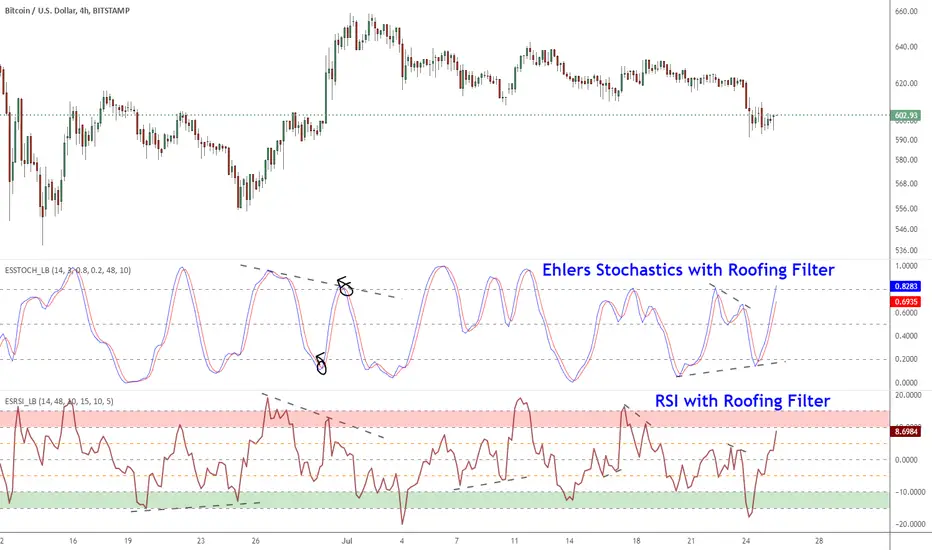
Ehlers Smoothed Stochastic & RSI with Roofing FiltersRoofing filters, first discussed by Mr.John Ehlers, act as a passband, filtering out unwanted noise from market data and accentuating turning points.
I have included 2 indicators with filters enabled. Both support double smoothing via options page. All the parameters are configurable.
Info on Roofing Filter and Ehlers Super Smoother:
----------------------------------------------------
The Ehlers' Roofing Filter is an expansion on Ehlers Super Smoother Filter, both being smoothing techniques based on analog filters. This filter aims at reducing noise in price data.
In Super Smoother Filter, regardless of the time frame used, all waves having cycles of less than 10 bars are considered noise (customizable via options page). The Roofing Filter uses this principle, however, it also creates a so-called "roof" by eliminating wave components having cycles greater than 48 bars which are perceived as "spectral dilation". Thus, the filter only passes those spectral components whose periods are between 10 and 48 bars. This technique noticeably reduces indicator lag and also helps assess turning points more accurately.
More info:
- Spectral dilation paper: www.mesasoftware.com
- John Ehlers presentation: www.youtube.com
------------------------------------------------------
If you want to use RSI %B and Bandwidth, follow this guide to "Make mine" this chart and get access to the source:
drive.google.com
For the complete list of my indicators, check this post:
Strategy Stochastic Crossover This back testing strategy generates a long trade at the Open of the following
bar when the %K line crosses below the %D line and both are above the Overbought level.
It generates a short trade at the Open of the following bar when the %K line
crosses above the %D line and both values are below the Oversold level.

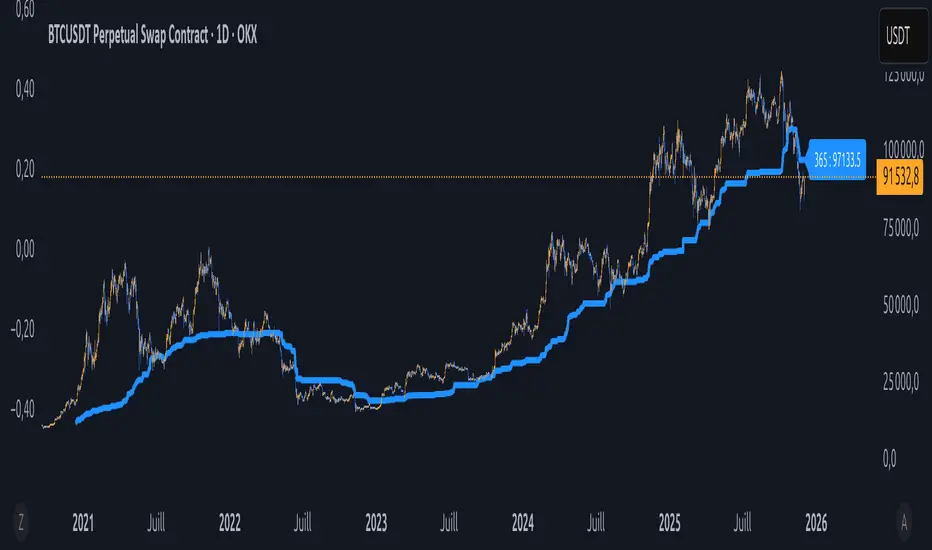
Équilibre du Sentiment – Multi-Périodes (v6)
English
A unique and advanced sentiment indicator based on the harmonic mean of highs and lows over nested rolling windows.
How it works:
The neutral sentiment point is reached when positive sentiment equals negative sentiment, which corresponds to the situation where the percentage between the price and the minimum is equal to the percentage between the maximum and the price.
For each chosen period N, the script calculates N different "neutral feeling" values:
- One using the last 1 bar
- One using the last 2 bars
- …
- One using the last N bars
It then extracts the exact median of these N values using a sorted insertion method (no approximation).
This produces an extremely smooth, non-repainting equilibrium line that represents the true "central sentiment" of the market over the selected lookback.
Features:
- Up to 3 independent periods (365, 52, 26 by default – fully customizable)
- Optional background coloring (green/red) when price is above/below the main curve
- Clean labels on the last bar showing the current value for each active period
- Zero repainting – fully compatible with strategies and alerts
- Highly responsive even with very long periods (up to 3500 bars)
Great for:
- Identifying long-term fair value / equilibrium zones
- Building mean-reversion or breakout systems
Pure Pine Script® v6 – no external libraries, no security calls, no repainting-free.
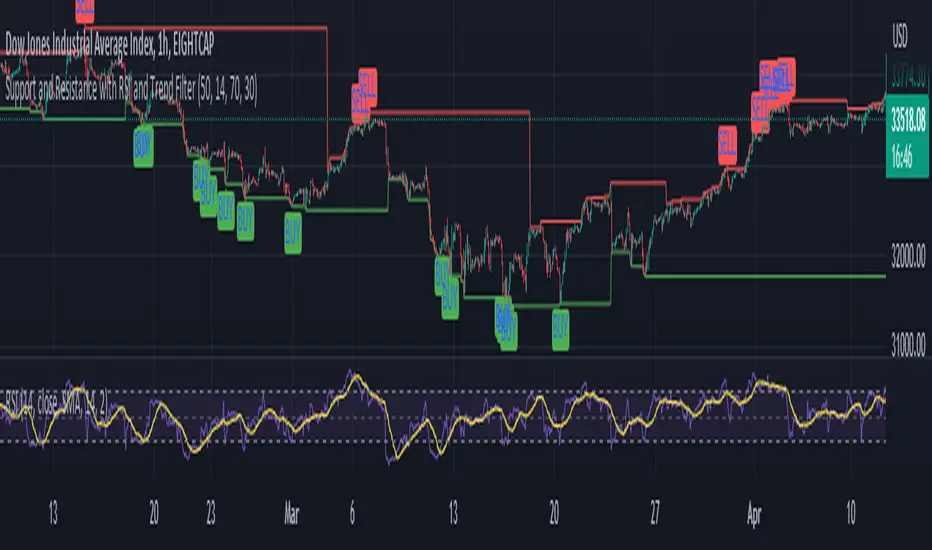
S & R RSi stratIn this updated version, a trend filter is applied using the Simple Moving Average (SMA) on the 4-hour timeframe. The trend is considered up when the 50-period SMA is below the 200-period SMA (ta.sma(trendFilterSource, 50) < ta.sma(trendFilterSource, 200)).
The buy condition (buyCondition) is triggered when the RSI crosses above the oversold threshold (ta.crossover(rsi, oversoldThreshold)), the trend filter confirms an uptrend (isUptrend is true), and the close price is greater than or equal to the support level (close >= supportLevel).
The sell condition (sellCondition) is triggered when the RSI crosses below the overbought threshold (ta.crossunder(rsi, overboughtThreshold)), the trend filter confirms a downtrend (isUptrend is false), and the close price is less than or equal to the resistance level (close <= resistanceLevel).
With this implementation, the signals will only be generated in the direction of the trend on the 4-hour timeframe.
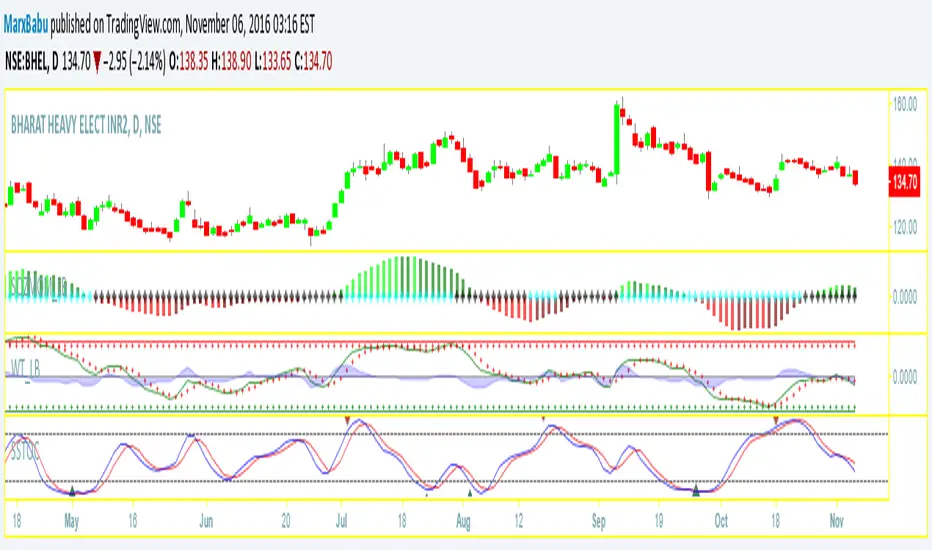
RSI + Stothis one can be used for over-bought and oversold
1d time frame is the best time frame for using this indicator
RSI measures the speed and magnitude of a security's recent price changes to evaluate overvalued or undervalued conditions in the price of that security.
The RSI can do more than point to overbought and oversold securities. It can also indicate securities that may be primed for a trend reversal or corrective pullback in price. It can signal when to buy and sell. T
traditionally, an RSI reading of 70 or above indicates an overbought situation. A reading of 30 or below indicates an oversold condition.

Madrid Bull Bear SentimentThis is an upgrade from Pinescript 1.0 published on April 2016 to Pinescript 5.0


Madrid Bull Bear SentimentThis indicator displays the distance in percentage between the highest and lowest points in a given period of time, compares them and determines which side has more dominance.

STOCHASTICSCan some Pine Sript editor help me to get the following needs
When blue==Red and below overbought line and blue just crosses above redline plot up arrow
when blue == red and above overbought line and blue started corrosing above to below on the redline plot down arrow
The code is here,only plotshape need to be added


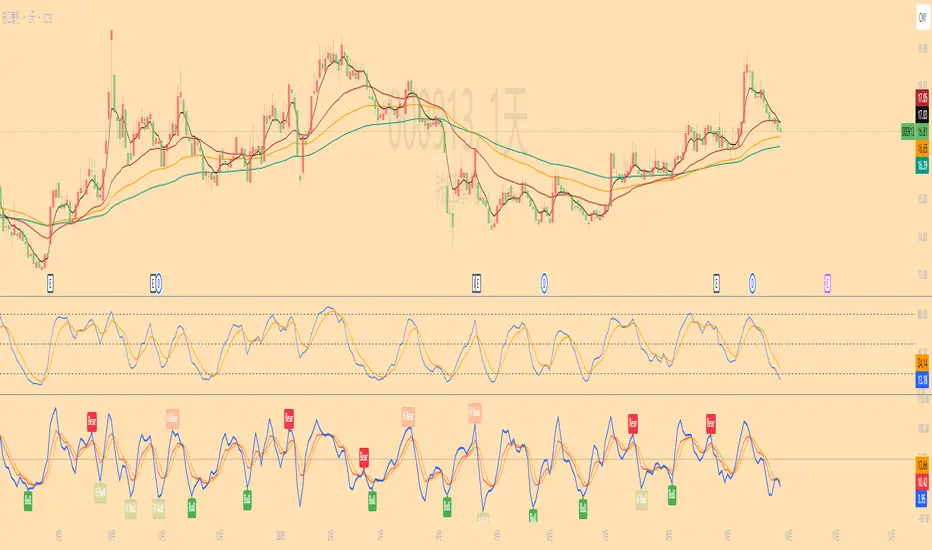
KDJ Divergence Indicator(Regular & Hidden)📌 中文介绍
KDJ 背离指标(副图版,支持 Regular & Hidden)
这是一个基于 KDJ 指标 的背离检测工具,可以在副图中直观显示 Regular 背离(顶背离/底背离) 和 Hidden 背离(隐藏顶/隐藏底)。
功能特点:
可选计算基线:支持以 J 值 或 K 值 作为背离判定依据。
多种背离类型:
Regular Bullish(底背离):价格创新低,但指标不创新低 → 可能反弹。
Regular Bearish(顶背离):价格创新高,但指标不创新高 → 可能回落。
Hidden Bullish(隐藏底背离):价格不创新低,但指标创新低 → 可能延续上涨。
Hidden Bearish(隐藏顶背离):价格不创新高,但指标创新高 → 可能延续下跌。
连线显示:在副图用线条连接前后两个背离点,帮助更直观地发现趋势变化。
自定义选项:
可选择是否显示 Regular / Hidden 背离。
可调整回溯范围(左侧/右侧/最大最小)。
可自定义颜色和信号样式。
报警提醒:背离出现时会触发报警。
适合:
波段交易者寻找趋势反转。
短线交易者捕捉关键拐点。
技术分析结合 KDJ 的交易策略。
📌 English Introduction
KDJ Divergence Indicator (Sub-Chart, Regular & Hidden Supported)
This is a KDJ-based divergence detection tool, plotted in a sub-window, that highlights Regular Divergences (Bullish/Bearish) and Hidden Divergences (Hidden Bullish/Hidden Bearish).
Key Features:
Selectable Oscillator Line: Choose between J or K line as the basis for divergence detection.
Divergence Types:
Regular Bullish: Price makes a lower low, but oscillator makes a higher low → potential rebound.
Regular Bearish: Price makes a higher high, but oscillator makes a lower high → potential drop.
Hidden Bullish: Price holds higher low, but oscillator makes a lower low → potential trend continuation upward.
Hidden Bearish: Price holds lower high, but oscillator makes a higher high → potential trend continuation downward.
Line Connections: Draws connecting lines between divergence points for better visual clarity.
Customizable Settings:
Enable/disable Regular & Hidden divergences.
Adjustable left/right lookback and range filters.
Custom colors and shapes for signals.
Alert Ready: Alerts trigger when divergences are detected.
Best for:
Swing traders spotting trend reversals.
Short-term traders catching turning points.
Technical analysts using KDJ-based strategies.
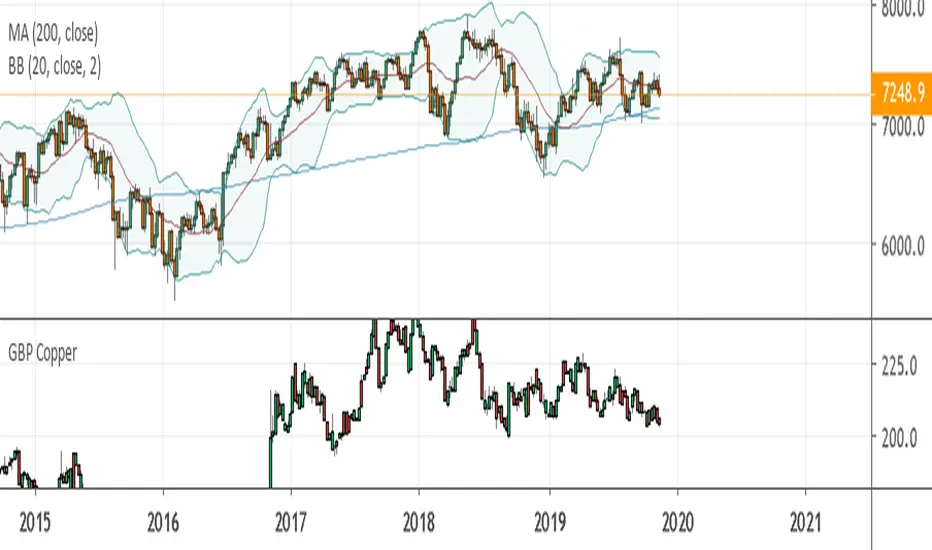
GBP CopperThis is copper prices in GBP.
After noticing that the FTSE100 shot up in March 2018 very sharply and continued into May while the rest of the world seemed to take its time carrying on until September while the FTSE fell back after its May peak, I wonder if the price of copper had any effect.
So here's the price of Copper in GBP.

Inside Bar Alert I need help!!! I created the alert but it triggering during the formation not once it has printed. Does anyone know who to make it trigger the alert once the inside bar is complete and make it plot an arrow when the inside bar has formed?

Stoch_RSIStochastic RSI – Advanced Divergence Indicator
This custom indicator is an advanced version of the Stochastic RSI that not only smooths and refines the classic RSI input but also automatically detects both regular and hidden divergences using two powerful methods: fractal-based and pivot-based detection. Originally inspired by contributions from @fskrypt, @RicardoSantos, and later improved by developers like @NeoButane and @FYMD, this script has been fully refined for clarity and ease-of-use.
Key Features:
Dual Divergence Detection:
Fractal-Based Divergence: Uses a four-candle pattern to confirm top and bottom fractals for bullish and bearish divergences.
Pivot-Based Divergence: Employs TradingView’s built-in pivot functions for an alternate view of divergence conditions.
Customizable Settings:
The inputs are organized into logical groups (Stoch RSI settings, Divergence Options, Labels, and Market Open Settings) allowing you to adjust smoothing periods, RSI and Stochastic lengths, and divergence thresholds with a user-friendly interface.
Visual Enhancements:
Plots & Fills: The indicator plots both the K and D lines with corresponding fills and horizontal bands for quick visual reference.
Divergence Markers: Diamond shapes and labeled markers indicate regular and hidden divergences on the chart.
Market Open Highlighting: Optional histogram plots highlight the market open candle based on different timeframes for stocks versus non-forex symbols.
Soul Button Scalping (1 min chart) V 1.0Indicator Description
- P Signal: The foundational buy signal. It should be confirmed by observing RSI divergence on the 1-minute chart.
- Green, Orange, and Blue Signals: Three buy signals generated through the combination of multiple oscillators. These signals should also be cross-referenced with the RSI on the 1-minute chart.
- Big White and Big Yellow Signals: These represent strong buy signals, triggered in extreme oversold conditions.
- BEST BUY Signal: The most reliable and powerful buy signal available in this indicator.
____________
Red Sell Signal: A straightforward sell signal indicating potential overbought conditions.
____________
Usage Guidance
This scalping indicator is specifically designed for use on the 1-minute chart, incorporating data from the 5-minute chart for added context. It is most effective when used in conjunction with:
• VWAP (Volume Weighted Average Price), already included in the indicator.
• RSI on the 1-minute chart, which should be opened as a separate indicator.
• Trendlines, structure breakouts, and price action analysis to confirm signals.
Intended for Crypto Scalping:
The indicator is optimized for scalping cryptocurrency markets.
____________
Future Enhancements:
• Integration of price action and candlestick patterns.
• A refined version tailored for trading futures contracts, specifically ES and MES in the stock market.

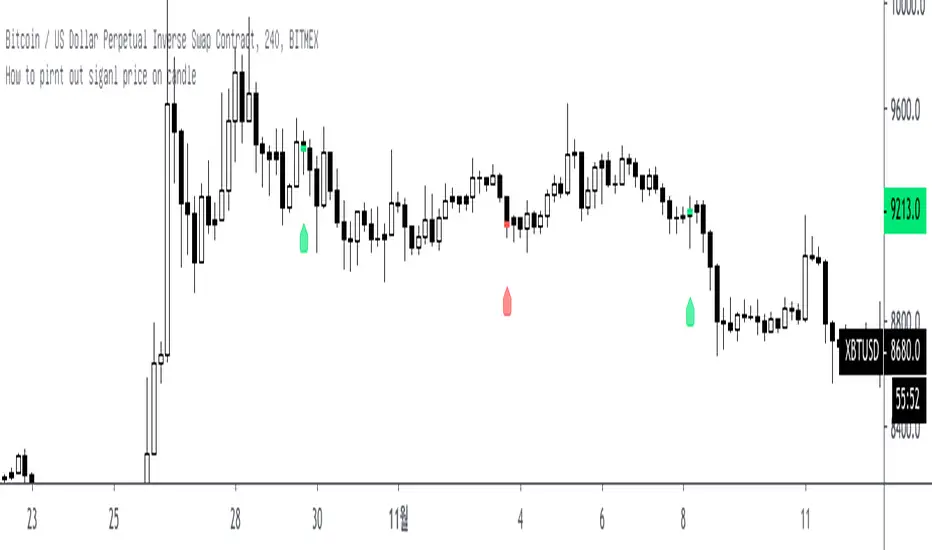
How to pirnt out siganl price on candleHi, this is Yong from Mby_lab
this codes explain how print out signal price on candles.
only working on 4H timeframe.
Core code based on 3H timeframe so This time close show on 4H, realtime close.
if 3H close fixed, then it will show on 4H line break style and this is not show twice on candle cause like this
When 3H closed / 4H = realtime
4H closed / 3H = realtime
then like this
3am close show 4am candle
6am close show next 4H candle for 8am~
..
.....
enjoy this!
this codes can help solve timeframe / security issues.
//