Double Inside Body Candles with Box & Alert + 5-Bar LinesThis indicator identifies Double Inside Body Candle patterns, where:
Candle 1 is completely inside Candle 2,
Candle 2 is completely inside Candle 3 (the parent candle),
Candle 3 has a real body (not a doji or negligible body size).
Once the pattern is detected:
A label appears below the current candle.
A highlight box is drawn around Candle 3 (the parent candle) body range.
Horizontal lines are drawn from the top and bottom of Candle 3’s body and extend forward for exactly 5 bars to visualize potential breakout levels.
The script also detects and highlights breakouts:
🔼 Bullish breakout: if price closes above Candle 3's body high.
🔽 Bearish breakout: if price closes below Candle 3's body low.
Alerts are available for:
Double Inside Body pattern detection
Bullish breakout
Bearish breakout
Traders can use this script to identify consolidation periods (double inside bars), then monitor for breakout opportunities in either direction, using the 5-bar lines as short-term breakout levels.
Wyszukaj w skryptach "bar"

Long Bar With ATR Multi Timframe | Amoo HassanLong Bar with ATR Multi Timeframe | Amoo Hassan
Looking for a smarter way to spot powerful moves in the market?
Long Bar with ATR Multi Timeframe is built exactly for that!
This tool helps you catch strong trend breakouts and potential reversals — in a simple, clear, and effective way.
What This Script Does:
Detects Long Bars: It looks for candles with a larger body compared to recent averages and confirms them with ATR (Average True Range). Only truly significant moves are highlighted.
Trend Filtering: Uses fast and slow moving averages (60 EMA, 34 EMA, and 200 SMA) to check if the overall market trend supports your trade.
Multi-Timeframe Supertrend: Supertrend signals are combined across different timeframes to give extra confirmation and reduce false signals.
Sharp Peaks and Valleys: Special candlestick patterns like sharp tops and bottoms are detected automatically.
Smart Trading Sessions: Trades are filtered based on the most active trading hours, avoiding dead times when price action is messy.
Important Date Control: On days with historically strange price action (like the 13th and 20th), the script stays cautious by disabling trades.
Clear Buy and Sell Labels: When all conditions are aligned, you'll see clean and clear "BUY" or "SELL" signals right on your chart.
Why You'll Like It:
It's easy to use, even if you're not a technical analysis expert.
It helps you avoid bad trades and focus on quality setups.
It fits into your existing trading system — or it can work as a standalone entry tool.
Friendly Reminder:
No indicator is 100% perfect! Always combine signals with good risk management and your own judgment.
And remember: Past results don't guarantee future performance.
Best Timeframes:
For the best results, we recommend using this script on 5-minute and 1-minute timeframes.

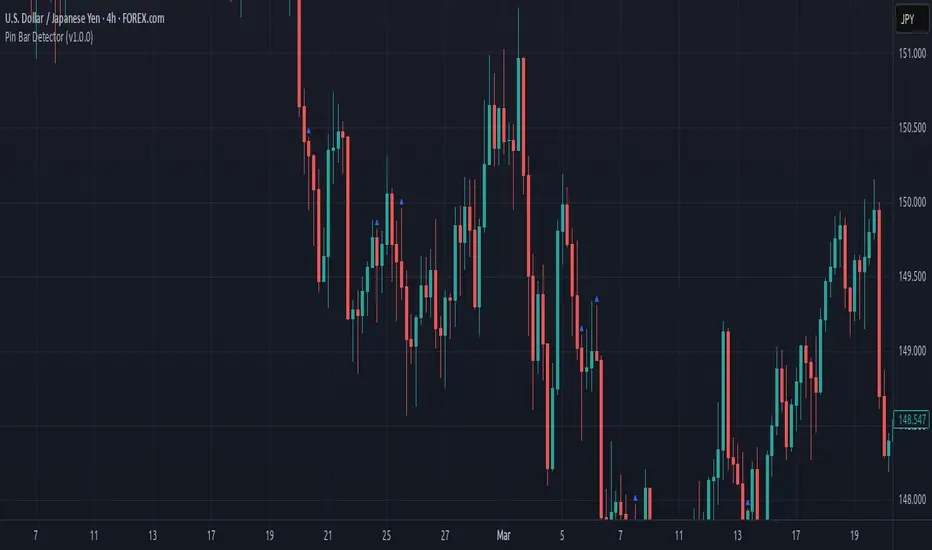
Pin Bar Detector (v1.0.0) Description:
This script detects Pin Bar candlestick patterns based on their shadows and body size.
It analyzes the candle's structure and trend direction using moving averages
to determine valid Pin Bars in an uptrend or downtrend.
The purpose of this script is to help traders identify potential reversal points
by spotting Pin Bar formations in line with the prevailing market trend.
Sunil 2 Bar Breakout StrategyDetailed Explanation of the Sunil 2 Bar Breakout Strategy
Introduction
The Sunil 2 Bar Breakout Strategy is a simple yet effective price-action-based approach designed to identify breakout opportunities in financial markets. This strategy analyzes the movement of the last three candles to detect momentum and initiates trades in the direction of the breakout. It is equipped with a built-in stop-loss mechanism to protect capital, making it suitable for traders looking for a structured and disciplined trading system.
The strategy works well across different timeframes and asset classes, including indices, stocks, forex, and cryptocurrencies. Its versatility makes it ideal for both intraday and swing trading.
Core Concept
The strategy revolves around two primary conditions: breakout identification and risk management.
Breakout Identification:
Long Trade Setup: The strategy identifies bullish breakouts when:
The current candle's closing price is higher than the previous candle's closing price.
The high of the previous candle is greater than the highs of the two candles before it.
Short Trade Setup: The strategy identifies bearish breakouts when:
The current candle's closing price is lower than the previous candle's closing price.
The low of the previous candle is lower than the lows of the two candles before it.
Risk Management:
Stop-Loss: For each trade, a stop-loss is automatically set:
For long trades, the stop-loss is set to the low of the previous candle.
For short trades, the stop-loss is set to the high of the previous candle.
This ensures that losses are minimized if the breakout fails.
Exit Logic:
The trade is closed automatically when the stop-loss is hit.
This approach maintains discipline and prevents emotional trading.
Strategy Workflow
Entry Criteria:
Long Entry: A long trade is triggered when:
The current close is greater than the previous close.
The high of the previous candle exceeds the highs of the two candles before it.
Short Entry: A short trade is triggered when:
The current close is less than the previous close.
The low of the previous candle is below the lows of the two candles before it.
Stop-Loss Placement:
For long trades, the stop-loss is set at the low of the previous candle.
For short trades, the stop-loss is set at the high of the previous candle.
Trade Management:
Trades are exited automatically if the stop-loss level is hit.
The strategy avoids re-entering trades until new breakout conditions are met.
Default Settings
Position Sizing:
The default position size is set to 1% of the account equity. This ensures proper risk management and prevents overexposure to the market.
Stop-Loss:
Stop-loss levels are automatically calculated based on the previous candle’s high or low.
Timeframes:
The strategy is versatile and works across multiple timeframes. However, it is recommended to test it on 15-minute, 1-hour, and daily charts for optimal performance.
Key Features
Automated Trade Execution:
The strategy handles both trade entry and exit automatically based on pre-defined conditions.
Built-In Risk Management:
The automatic stop-loss placement ensures losses are minimized on failed breakouts.
Works Across Markets:
The strategy is compatible with a wide range of instruments, including indices, stocks, forex, and cryptocurrencies.
Clear Signals:
Entry and exit points are straightforward and based on objective conditions, reducing ambiguity.
Versatility:
Can be used for both day trading and swing trading, depending on the chosen timeframe.
Best Practices for Using This Strategy
Backtesting:
Test the strategy on your chosen instrument and timeframe using TradingView's Strategy Tester to evaluate its performance.
Market Conditions:
The strategy performs best in trending markets or during periods of high volatility. Avoid using it in range-bound or choppy markets.
Position Sizing:
Use the default position size (1% of equity) or adjust based on your risk tolerance and account size.
Instrument Selection:
Focus on instruments with good liquidity and volatility, such as indices (e.g., NIFTY, BANKNIFTY), forex pairs, or major cryptocurrencies (e.g., Bitcoin, Ethereum).
Potential Enhancements
To make the strategy even more robust, consider adding the following optional features:
Stop-Loss Multiplier:
Allow users to customize the stop-loss distance as a multiple of the default level (e.g., 1.5x the low or high of the previous candle).
Take-Profit Levels:
Add user-defined take-profit levels, such as a fixed risk-reward ratio (e.g., 1:2).
Time Filter:
Include an option to restrict trading to specific market hours (e.g., avoid low-liquidity times).
Conclusion
The Sunil 2 Bar Breakout Strategy is an excellent tool for traders looking to capitalize on breakout opportunities while maintaining disciplined risk management. Its simplicity, combined with its effectiveness, makes it suitable for traders of all experience levels. By adhering to the clearly defined rules, traders can achieve consistent results while avoiding emotional trading decisions.
This strategy is a reliable addition to any trader’s toolbox and is designed to work seamlessly across different market conditions and instruments.

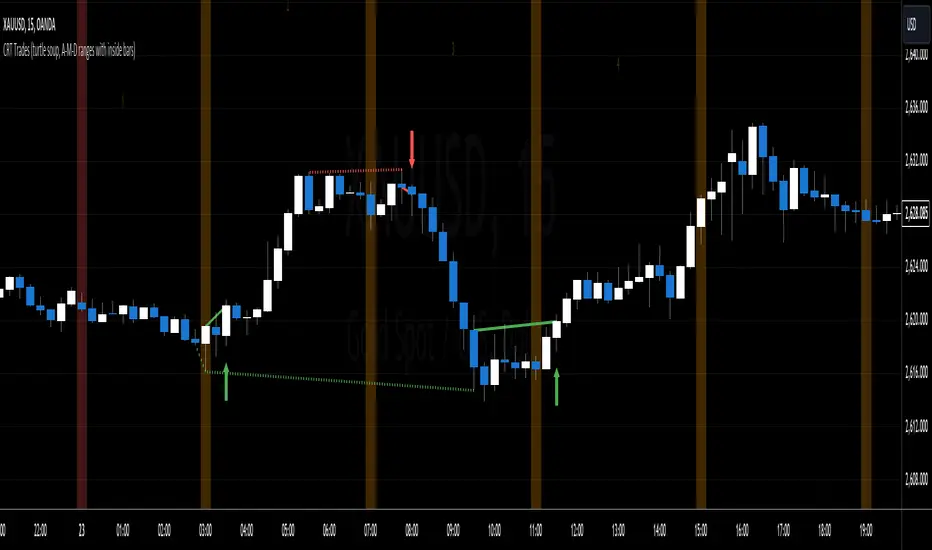
CRT Trades (turtle soup, A-M-D ranges with inside bars)CRT means Candle Range Theory. Every single candle is a range, on every single timeframe. Ranges may be either manipulated - turtle souped or broken - engulfed - closed above/below and retested.
CRT is usually presented as a 3 candle model. However it may consist of more than 3 candles due to inside bars. Inside bar is the candle where high is not higher then previous candle high and low is not lower then previous candle low.
First candle represents accumulation (may consist of more candles - inside bars), second candle represents manipulation (turtle soup) and third candle represents distribution. The abbreviation for that is A-M-D.
In accumulation the range with specific high and low is created. In manipulation (turtle soup) the high or low of the range is manipulated - liquidity taken and price should usually reverse back to the range. In distribution price is reversing back to the opposite side of the range. On higher timeframe it looks like manipulation candle wick is higher/lower than previous range high/low (may consist of 1 or more inside bar candles) but the body must not close above/below previous range high/low. Otherwise it is not manipulation (turtle soup) most likely and price should continue in direction of the candle close. Distribution candle should touch opposite side of range and it is mostly heavy and fast candle.
CRT model can be found on higher timeframe (e.g. 4h) and entries can be found on lower timeframe (e.g. 15m). You always use only lower timeframe on your chart because CRT model on the higher timeframe is shown on the lower one and also you can plan entries on the lower timeframe. You are able to change CRT model higher timeframe in the indicator settings.
There are two types of entries:
simple - wait for manipulation candle to close on higher timeframe (HTF) and then enter on lower timeframe (LTF) above open of the distribution candle on HTF if it is short or on LTF below open of the distribution candle on HTF if it is long. These entries can be done by market order.
advanced - wait for the break of previous range high/low and enter by limit order when price reverses back to the range and retraces to the order block or fair value gap created by the breaker candle.
Stop loss can be placed above/below of the top/bottom created by manipulation candle. First take profit should be placed in 1/2 of the accumulation range and second take profit should be placed at the opposite range of accumulation range.
It is possible to filter only particular accumulation (range) and manipulation (turtle soup) candles depending also on timezone set in the settings. For example on 4h CRT model if you fill input "indices" for section "range" like 1,2 and input "indices" for section "turtle soup" like 3,4 then you are awaiting the range to form during asia session and manipulation during london session if the timezone is somewhere around "UTC+2".
Dotted lines represent turtle soup of previous range and solid lines represent engulfing candle of the breaker candle on lower timeframe. When the engulfing is closed you can look for entries either by market order after closing or by limit order when the price retraces to order block (created by breaker candle) or fair value gap (created by engulfing).
Recommendations for combining lower (entries) and higher (crt model) timeframes:
1D CRT model => 1h entries,
4h CRT model => 15m entries,
1h CRT model => 5m entries,
15m CRT model => 1m entries.
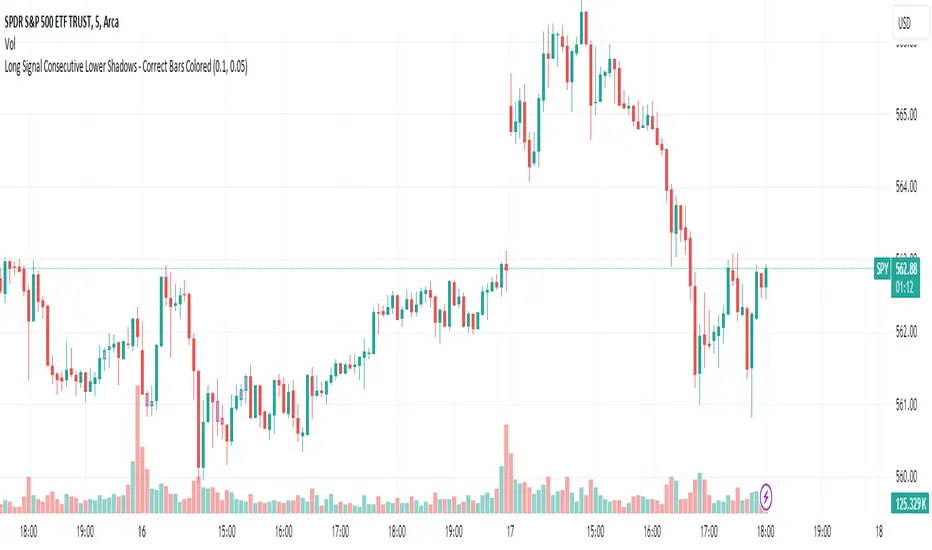
Long Signal Consecutive Lower Shadows - Correct Bars ColoredThis script identifies and highlights consecutive lower shadows on candlesticks in TradingView. A lower shadow is the portion of the candlestick between the low price and the lower of the open or close prices, often indicating price rejection at lower levels.
Key Features:
Threshold Settings: The user can customize the minimum length of the lower shadow (lowerShadowThreshold) and the maximum allowable price difference between consecutive lows (priceDifferenceThreshold).
Bar Coloring: When two consecutive bars meet the lower shadow condition, both bars are colored (default green).
Alerts: An alert is triggered when consecutive lower shadows are detected, allowing users to be notified of potential market reversals or buy opportunities.
APB candle(Average Price Bar)
APB Candle (Average Price Bar) with Heikin Ashi and Default Candle ON/OFF Control
Description (日本語解説は下記):
The APB Candle (Average Price Bar) provides a smoother and clearer visualization of market trends compared to standard candlesticks or Heikin Ashi. Unlike regular candlesticks, which display raw price data, APB candles calculate the average of open, high, low, and close prices, effectively filtering out short-term noise and minor fluctuations. This allows traders to focus on overall trends rather than being distracted by small, unpredictable price movements.
Why APB is superior:
・Better Trend Identification: APB candles smooth price data more effectively than standard candlesticks, making it easier to spot sustained trends.
・Reduced Market Noise: While Heikin Ashi also filters noise, APB provides a clearer view of actual price averages, offering a better balance between smoothing and staying close to the real price.
・Clear Entry and Exit Signals: By smoothing out minor fluctuations, APB candles can provide clearer signals for entering and exiting trades, particularly in volatile markets.
Key Features:
1.APB Candle ON/OFF: Display smoothed average price bars that filter out minor fluctuations, making trends clearer.
2.Heikin Ashi Candle ON/OFF: Remove market noise and visualize smoother trends using Heikin Ashi candles.
3.Default Candle ON/OFF: Compare APB and Heikin Ashi candles with the standard TradingView candles.
4.Customizable Colors: Personalize the colors of bullish and bearish candles, including the body, wick, and border.
5.Color Shift Threshold: Adjust the transparency of APB candles based on a user-defined threshold for smaller body sizes.
6.Countdown Timer: See how much time remains before the next candle forms, with customizable size, position, and color.
Trading Strategy:
・Trend Following with APB: Use APB candles to identify smoother trends by filtering out minor price fluctuations. This can be useful for trend-following strategies in volatile markets.
・Heikin Ashi for Reversals: Heikin Ashi candles help to smooth out trends, making it easier to spot potential reversals. When switching from red to green (or vice versa), it could signal a change in direction.
・Compare APB, Heikin Ashi, and Default Candles: For confirmation, compare APB and Heikin Ashi signals with default candlesticks to ensure reliability before entering a trade.
Benefits:
・Customizable Visualization: You can quickly switch between different candle types, depending on your strategy, without changing your chart setup.
・Clear Trend Identification: APB and Heikin Ashi candles help filter out noise, making it easier to see trends and reversals.
・Multiple Timeframes: Works well on multiple timeframes, allowing for flexible trading strategies.
Drawbacks:
・Smoothing May Hide Important Details: While APB and Heikin Ashi smooth price action, they might obscure key price points or signals on smaller timeframes.
・Potential Over-Reliance on Visuals: Relying too much on smoothed candles might cause traders to miss underlying market conditions or important price levels visible in traditional candlesticks.
APBキャンドル(平均価格バー)とヘイキンアシ、デフォルトローソク足のON/OFF制御
説明:
**APBキャンドル(平均価格バー)**は、標準のローソク足やヘイキンアシに比べ、よりスムーズで明確なトレンドの視覚化を提供します。通常のローソク足が生データをそのまま表示するのに対し、APBキャンドルはオープン、高値、安値、終値の平均を計算してノイズを除去し、小さな価格変動をフィルタリングします。これにより、短期的なノイズに惑わされることなく、全体的なトレンドに集中することが可能です。
APBが優れている理由:
・トレンドの把握が容易: APBキャンドルは標準のローソク足よりも価格データを滑らかにし、持続的なトレンドを見つけやすくします。
・市場ノイズの削減: ヘイキンアシもノイズをフィルタリングしますが、APBは実際の価格平均に基づいており、スムージングと実際の価格データのバランスが優れています。
・エントリー・エグジットの明確化: 小さな変動を滑らかにすることで、特にボラティリティの高い市場でのエントリー・エグジットシグナルが明確になります。
主な機能:
1.APBキャンドルのON/OFF: 小さな価格変動をフィルタリングし、トレンドを明確に表示します。
2.ヘイキンアシキャンドルのON/OFF: ノイズを取り除き、スムーズなトレンドを視覚化します。
3.デフォルトローソク足のON/OFF: 標準のローソク足との比較を容易にし、戦略に応じて使用可能です。
4.色のカスタマイズ: 上昇時と下降時のローソク足の色を自由に設定可能。
色変化のしきい値設定: APBキャンドルのボディサイズが小さい場合に色を薄くするしきい値を設定できます。
5.カウントダウンタイマー: 各ローソク足の下に、次のローソク足が形成されるまでの残り時間を表示します。
トレード戦略:
・APBでのトレンドフォロー: APBキャンドルを使って、スムーズなトレンドを確認し、ボラティリティの高い市場でトレンドフォロー戦略を取る。
・ヘイキンアシでの反転シグナル確認: ヘイキンアシを使い、上昇(緑)から下降(赤)への色変化を反転シグナルとして利用。
・3種類のローソク足の比較: APB、ヘイキンアシ、デフォルトローソク足を比較し、トレンドや反転の信頼性を確認してからエントリーする。
メリット:
・カスタマイズ性が高い: 戦略に応じて3種類のローソク足を自由に切り替え可能。
・トレンドの把握が容易: ノイズを除去してトレンドや反転を明確に把握できる。
・複数タイムフレームで効果的: 複数のタイムフレームで利用可能なため、柔軟な戦略が立てられる。
デメリット:
・重要な情報の隠蔽の可能性: APBやヘイキンアシのスムージングにより、小さな価格変動や重要な価格ポイントが隠れる可能性がある。
・視覚的な判断に依存しすぎるリスク: スムーズなローソク足に頼りすぎることで、標準的なローソク足で確認できる重要な情報を見逃す可能性があります。
注意書き:
1.インジケーターの突然の変更や削除の可能性: このインジケーターは今後予告なく変更や削除される場合がありますのでご注意ください。
2.損失の責任について: このインジケーターを使用したことによる損失に関して、作者は一切の責任を負いません。トレードは自己責任で行ってください。

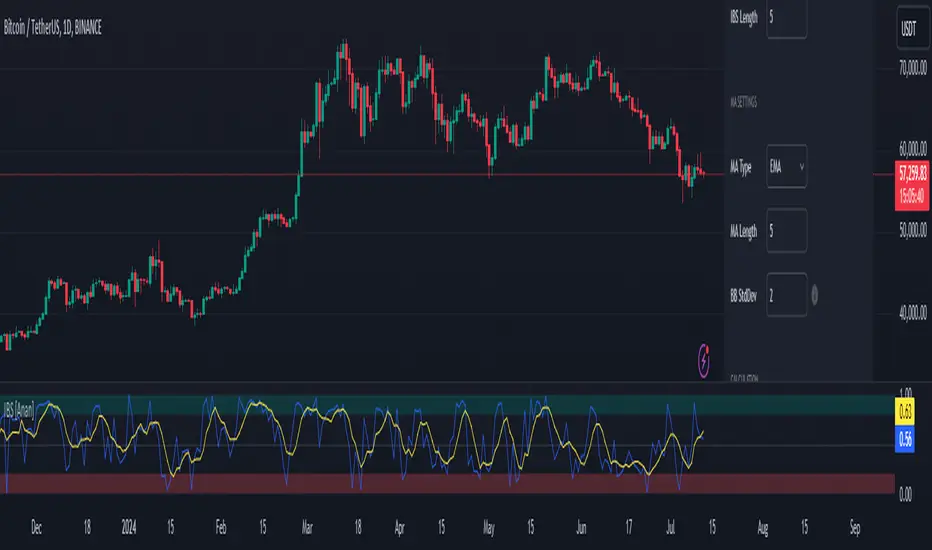
Internal Bar Strength IBS [Anan]This indicator calculates and displays the Internal Bar Strength (IBS) along with its moving average. The IBS is a measure that represents where the closing price is relative to the high-low range of a given period.
█ Main Formula
The core of this indicator is the Internal Bar Strength (IBS) calculation. The basic IBS formula is:
ibs = (close - low) / (high - low)
I enhanced the original formula by incorporating a user-defined length parameter. This modification allows for greater flexibility in analysis and interpretation. The extended version enables users to adjust the indicator's length according to their specific needs or market conditions. Notably, setting the length parameter to 1 reproduces the behavior of the original formula, maintaining backward compatibility while offering expanded functionality:
ibs = (close - ta.lowest(low, ibs_length)) / (ta.highest(high, ibs_length) - ta.lowest(low, ibs_length))
Where:
- `close` is the closing price of the current bar
- `lowest low` is the lowest low price over the specified IBS length
- `highest high` is the highest high price over the specified IBS length
█ Key Features
- Calculates IBS using a user-defined length
- Applies a moving average to the IBS values
- Offers multiple moving average types
- Includes optional Bollinger Bands or Donchian Channel overlays
- Visualizes bull and bear areas
█ Inputs
- IBS Length: The period used for IBS calculation
- MA Type: The type of moving average applied to IBS (options: SMA, EMA, SMMA, WMA, VWMA, Bollinger Bands, Donchian)
- MA Length: The period used for the moving average calculation
- BB StdDev: Standard deviation multiplier for Bollinger Bands
█ How to Use and Interpret
1. IBS Line Interpretation:
- IBS values range from 0 to 1
- Values close to 1 indicate the close was near the high, suggesting a bullish sentiment
- Values close to 0 indicate the close was near the low, suggesting a bearish sentiment
- Values around 0.5 suggest the close was near the middle of the range
2. Overbought/Oversold Conditions:
- IBS values above 0.8 (teal zone) may indicate overbought conditions
- IBS values below 0.2 (red zone) may indicate oversold conditions
- These zones can be used to identify potential reversal points
3. Trend Identification:
- Consistent IBS values above 0.5 may indicate an uptrend
- Consistent IBS values below 0.5 may indicate a downtrend
4. Using Moving Averages:
- The yellow MA line can help smooth out IBS fluctuations
- Crossovers between the IBS and its MA can signal potential trend changes
5. Bollinger Bands/Donchian Channel:
- When enabled, these can provide additional context for overbought/oversold conditions
- IBS touching or exceeding the upper band may indicate overbought conditions
- IBS touching or falling below the lower band may indicate oversold conditions
Remember that no single indicator should be used in isolation. Always combine IBS analysis with other technical indicators, price action analysis, and broader market context for more reliable trading decisions.
Svopex Pin Bar DetectorThe Pin Bar Detector is a technical analysis tool designed to identify pin bar candlestick patterns on trading charts. A pin bar is characterized by a small candle body and a long shadow, indicating a significant rejection of prices that can signal potential reversals in the market.

[LCS] Bar HeatmapThe script is an overlay aimed at making price action within a range more comprehensible, i.e. what is the “story” that the band range is telling in relation to the price. You’ll see bars become brighter as they come near the upper or lower band, and dimmer around the average/middle of the two bands. This makes it easier to spot when the price is within an oversold or overbought area or when its experiencing a strong trend movement. The color shift from one to the other can also give a sense as to whether the price action is changing character (going from bullish to bearish or vice versa).
Settings are available for customization to the user's liking.
How to use:
1. Add the indicator.
2. Add another indicator to use as the source, such as Bollinger Bands, which provides upper and lower plots for a channel range.
3. Click the gear icon to access the indicator settings.
4. Mandatory: Select the Upper Band and Lower Band settings as the upper and lower plots from your source indicator of choice to define the range.
5. Save settings. You should now see bars on your chart.
6. Access the Chart Settings (not the indicator settings) and hide the Body, Borders, and Wick for the default candle bars to avoid overlap.
You may need to perform additional configuration steps in your source indicator to appropriately size the range of the upper and lower band plots for a meaningful visualization.

S/R and Reversal BarsToday I'm proposing an idea to form S/R with a slightly different basic idea. This is a combination of CCI and candlestick study, and we will use this to mark possible reversal candles and possible S/R lines.
This is nothing complicated, I've used a basic CCI indicator with certain rules/system to mark S/R levels on the chart. (Have loaded traditional CCI indicator on bottom for comparison)
S/R levels are market as followed
Cross -
Lime = Support
Red = Resistance
Zero/Balance line - Yellow circles
The idea is to use this indicator to trade sideways market more successfully, in trending market this can be futile if you are not waiting for the break-out or breakdowns with confirmation.
Since this is based on CCI, it will give static result only when bar is closed, till then it will be susceptible for repaint. This is inherited nature from CCI readings on current bar. I could change this to only making reading on closed bar (historical bar), but that takes away from the uniqueness of this indicator in giving early indications.
This is a great tool for intraday scalping, but it does work on all timeframes, it's not bound by granularity.
This is for education purpose only.
Past success or seemingly positive results on published posts are not indication of future success.

NGL - Bar PatternsThe NGL - Bar Patterns Indicator is a user-friendly and intuitive tool designed for traders of all experience levels. It brings to the fore a unique approach to visualizing the price trends and identifying potential market zones.
This indicator paints the bars on your chart in a variety of colors, representing different price zones.
The changing colors offer an easy-to-understand visual representation of where the price is situated within a range derived from historical highs and lows.
This can help to quickly identify market conditions and potential trading opportunities.
Here's a quick rundown on how to interpret the colors:
Lime: Represents the price zones with the highest bullish momentum. A lime-colored bar indicates that the closing price is well above the historical range. It might be interpreted as a strong bullish momentum.
Green: Slightly less bullish than lime, but still signifies an upward momentum in the price.
Black: Indicates that the price is trending towards the middle of the historical range, possibly indicating a neutral market condition.
Navy: The price is below the middle but not exceedingly bearish.
Red: This color represents an area where the price is starting to show bearish momentum.
Orange: Indicates a stronger bearish momentum than red.
Purple: Represents the area where the price has strong bearish momentum.
Lime (at the bottom): This is the area with the most bearish momentum.
Please note, this indicator should not be used as a standalone decision-making tool, but in combination with other technical analysis methods or indicators. Always consider your risk tolerance and financial situation before entering trades.
Disclaimer: Past performance does not guarantee future results. The information provided by this indicator is for educational purposes only and should not be considered as financial advice. Always do your own research before making investment decisions.

Advanced Price Direction bar colorsIn the advanced price direction algorithm situations of faltering price directions (fda) are identified.
These are very interesting, because this happens at tops, flags and trend turns.
I got the idea of coloring the bars with fda in a distinguishing color, reddish gray for fda down and blueish gray for faltering up.
The remaining bars retain standard color, but now this color 'confirms' the trend.
To show that this is true, I also plot a simple moving average (sma) with the same length in the chart.
It turns out that somehow the bars react to being above or below the sma, but also react to the direction of the sma.
Very interesting.
Have fun

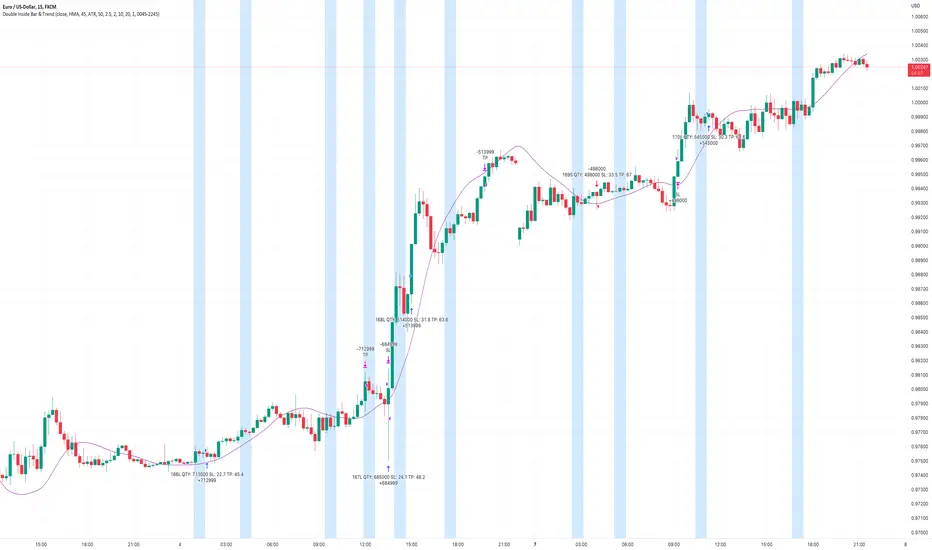
Double Inside Bar & Trend Strategy - KaspricciDouble Inside Bar & Trend Strategy - Kaspricci
This strategy combines the Double Inside Bar candlestick pattern with a trend filter. Once the second inside bar closes and price is above trend moving average, a buy stop order is placed at high of the candle. If price is below trend moving average, a sell stop order is placed at the low of the candle.
This strategy is for educational purposes only! It is not meant to be a financial advice.
Settings
Trend source, type of moving average and length for calculating trend
Stop Loss Type - default: ATR. You can switch between stop loss calculation based on Average True Range value or fixed value.
ATR Length / Factor / TP Ratio - default: 14 / 2.0 / 2.0. Used to calculate the Stop Loss as ATR * Factor and Take Profit as Stop Loss * TP Ratio.
FIX Stop Loss / Take Profit - default: 10 pips / 20 pips. In case you select Stop Loss Type = FIX, these value swill be used.
Risk in % - default: 1%, option to adjust the quantity of a trade based on a defined risk percentage. If enabled, it will overwrite the quantity parameter of the strategy settings.
On top you can filter trades by start and end date as well as time of the day.
NumberOfVisibleBarsLibrary "NumberOfVisibleBars"
This library calculates the number of visible bars on the user screen
NumberOfVisibleBars(No)
Calculates the number of visible bars on the user screen
Parameters:
No : paramters needed
Returns: The numbers of visible bars on the user screen (int)

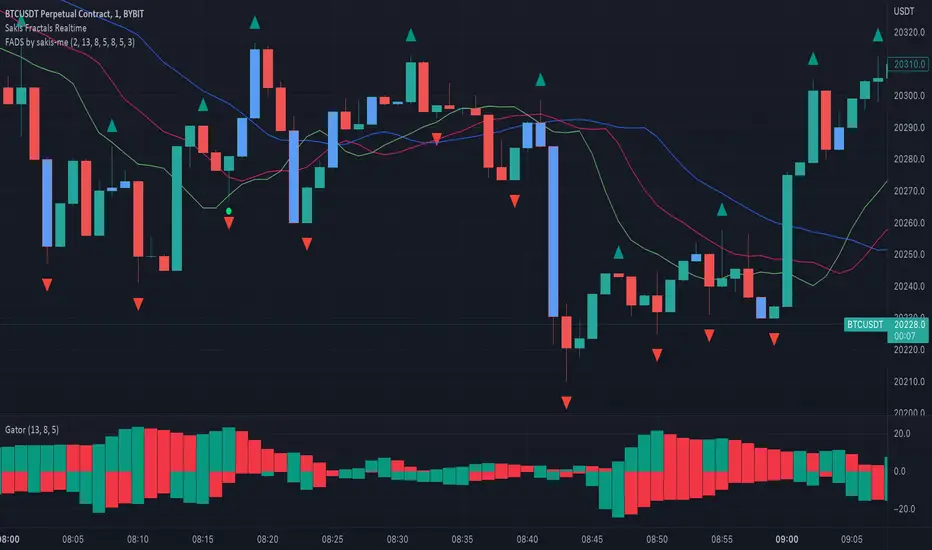
Fractals + Alligator + Divergent Bars + Squat BarsFractals + Alligator + Divergent Bars + Squat Bars Williams Indicators
All combined in one
MTF MACD BarOVERVIEW
This indicator shows MACD(Moving Average Convergence/Divergence) is up or down, represented by a bar. This indicator is compatible with MTF.
CONCEPTS
What do you want to know about market analysis?
Do you want a hard analysis? You can look for it.
All I want to know is whether the commonly known technical analysis is 'UP' or 'DOWN'.
All I want to know is whether the current market price is going up or down. Not only for the current, but also for the monthly, weekly, and daily status.
I want to make a decision in a moment. Without even thinking about it.
That is why I created a color-coded bar indicator to show the status.
No need to frown anymore.
DETAILS
You need more information about MACD, click here.
tradingview.com
MACD histogram Green ⇒ Bar is green.
MACD histogramRed ⇒ Bar is red.

[FR]Custom Candles/FVG/nSideBarCustom Candles /FVG/ nSideBar
- I used this as a learning project for understanding plot()'s Better
- My goal was to see if I could use normal plots to cleanly plot FVGs on the chart using only plots with out and boxes/lines
The problem was if multiple FVGs were on back to back bars the plot fill would fill the line to the next FVG/Bar
I solved this by using 4 plots and alternating them if consecutive FVGs form
- 2 MODES
- Slim
- Normal
//////////////////////////////////////////////////////////////////////////////////////////////////////////////////////////////////////////////////////////////////////////////
-Slim
Uses 3 plotcandle() parts and divides the candle between body/wicks/open and close
by manipulating the ohlc inputs and the colors I was able to pretty make them full customizable
all components are customizable with up/down colors
-Normal
These are your normal candles but they are full customize able from components to individual up/down colors
--------------------------------------------------------------------------------------------------------------------------------------------------------------------------------------------------------------------------------------------------------
- FVGs
There are 2 FVG settings can be used with both MODES
- Big
These are the FVGs that use plots and since there isn't a 500 object limit on plots you don't need to manage them in the code and they are there how ever far you need to look back
- Slim
These use a Line and the width of the line can be adjusted for user preferences
--------------------------------------------------------------------------------------------------------------------------------------------------------------------------------------------------------------------------------------------------------
- INSIDE-BARS
These will change the color of the body of either SLIM or NORMAL Candles
--------------------------------------------------------------------------------------------------------------------------------------------------------------------------------------------------------------------------------------------------------
Drawing Snap Features Work Just Fine!
I suggest hiding your chart candles with the eye in the top left of the screen and moving the indicator to the top of your object tree
I understand that the candles in the chart pictures are impractical I was just demonstrating the functionality of the tool
Hope You Enjoy!!
FFriZz

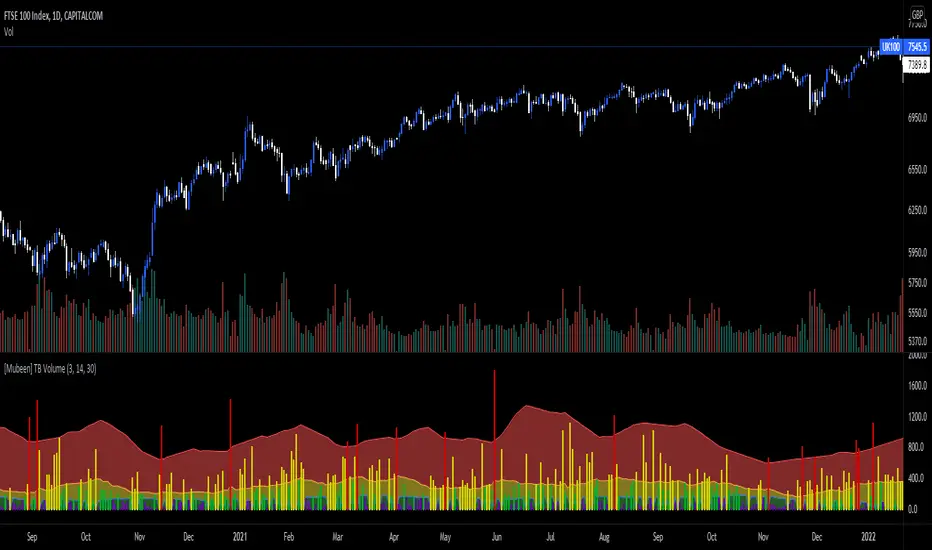
[Mubeen] True Bar VolumeTrue Bar Volume, or TB Volume, is an indicator that measures the volume against the price action that has occurred.
Volume can sometimes be miss leading as it does not necessary show whether it had an impact on the price of the underlying, as one individual (represented as one volume) who has put $100 into the underlying can impact the underlying the same as hundred individuals (represented as hundred volume) putting $1 into the underlying: but the volume will widely differ and can cause confusion for outsiders. With the True Bar indicator, it aims to show abnormal behaviour in the price change against the amount of volume that was stated. It visualises the effect of the volume on the underlying by colour coding the different levels of True Bar results, divided into Red, Yellow, Green, Purple.
Red indicates that the price has changed way out of portion compared with the volume that was seen. It is compared against the highest TB Volume values through selected periods and once the volume as broken out of the high, it is considered an anomaly.
Yellow indicates that the TB Volume values are representing the mean values so it is considered as normal trading activity. Spikes in yellow values can also be seen as rise in high interest in the underlying.
Green indicates that the TB Volume values are under performing in market activity.
Purple indicates that is it a null result as investors might be looking for a better entry into a market, or seen as interest is low in the market.
TB Volume should not be used on it's own as it only gives a reporting measurement of the volume performance, which may be meaningless without the supplementation of other indicators.
Current bar predicted volumeDrag this indicator in the same panel with the volume in the object tree, then right click on the scale bar and set "merge all scale into one" for a correct visualization.
This indicator multiply the current traded volume of a candle with the total time of that candle. This offer a prediction of where, in case the volumes would keep trading at a comparable magnitude, the volume bar would close when the candle will close.
The predicted volume is indicated with a blue short line above the current volume bar, and updates in real time.
I find this indicator extremely useful to offer at a glance an idea of an ascending or descending volume pattern, that can serve as confirmation for a reversal or breakout for example.
Very suitable for short time frames, where decisions have to be taken fast.
Enjoy,
Luca.

Delta Bar Stats SpaceManBTCDelta Bar Stats SpaceManBTC
This is a supplementary tool to DeltaPrint Candles SpaceManBTC, Hence why its inclusion in the chart above. Orderflow traders have access to the bar statistics in a seperate,
container to the candles themselves. This aims to tackle that disparity by providing a solution to tradingview.
Using a calculation that is found in the DeltaPrint Candles SpaceManBTC the data reflected as you can see is the same in the TVOL and DVOL
parameters matching the Total Volume and Delta Volume parameters.
The tool Delta Bar Stats SpaceManBTC also provides access to extra information, Delta Price, Buy Volume, Sell volume.
The Delta price highlighting the DVPOC (delta volume point of control) and the 2 following
refrencing the total buy volume and sell volume in the candle respectively.
Additionally you can see on load 2 settings:
Dynamic Coloring Delta Volume,
changes color based on whether the Total Delta for the candle was positive or negative.
Dynamic Coloring Delta Price,
changes color based on whether price closed above or below the DeltaVPOC
Ticksize is used to determine the amount of data generated, the lower the more information will be provided on the current candle. Using AutoTickSize will do this automatically accounting for recent volatility .
Therefore when using and new, use auto, to switch between charts with ease. On charts that you always keep open it is recommended to manually tune ticksize to your choosing.

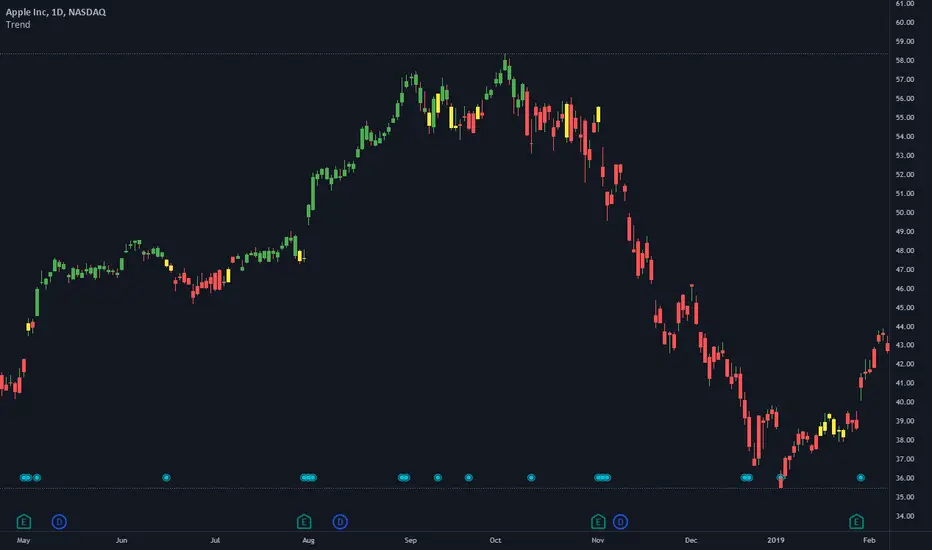
TrendStrength Turbo Bars - Directional TrendsMy interpretation of Danielle Shay's popular SimplerTrading TrendStrength Turbo indicator.
The TrendStrength indicator is based on a Fibonacci-based stacked EMA arrangement using the 5, 8, 13, 21 and 34 EMAs:
-> Green bars indicate an uptrend i.e. when the EMAs are positively stacked - there is more upward pressure than downward pressure in the price;
-> Red bars indicate a downtrend i.e. i.e. when the EMAs are negatively stacked - there is more downward pressure on the price; and
-> Yellow bars indicate no strong directional trend and potential for a reversal.
Volume spikes 50% above average volume are then flagged as dots at the bottom of the chart further confirming price momentum.
This indicator should compliment other popular indicators, as confirmation whether to stay in a position or not.
TWP Next Bar Close Countdown█ OVERVIEW
This script displays the time remaining for your charts current timeframe.period or a higher timeframe with the ability to create alerts that ping on the opening of the new bar that you have selected. It can be very easy to get bogged down in the charts when day trading on smaller timeframes and forgetting that it is the wave of longer timeframe traders that are setting the tone. This script was born out of this pitfall that I was noticing in my own trading.
█ CONCEPTS
The script uses a series of functions to get produce the time remaining and texts for the top and bottom rows within the table display.
█ FEATURES
1 — Resolution
• Auto / Manual selection
• There is tooltip explains how the automatic time selection operates (see below)
AUTO_TIMEFRAME_TOOLTIP = "When the Auto option is selected, the timeframe of the indicator is chosen automatically based on the chart timeframe. The Timeframe dropdown is ignored. The automated timeframes are: \n
'10 minutes' for any chart timeframes below '1 minute' \n
'1 hour' for any chart timeframes starting from '1 minute' up to '5 minutes'
'4 hours' for any chart timeframes starting from '5 minutes' up to '60 minutes' \n
'1 day' for any chart timeframes starting from '1 hour' up to '4 hours' \n
'1 week' for any chart timeframes starting from '4 hours' up to '1 day' \n
'1 month' for any timeframes starting from '1 day' up to '1 week' \n
'3 months' for any timeframes starting from '1 week' up to '1 month' \n
'12 months' for any timeframes above '1 month'"
2 — Text
• Size selection
• Color selection
3 — Display
• Frame color selection
• Display position selection
4 — Alerts
• Market session selection
█ HOW TO USE
• Add it to your chart, select your timeframe, change up your colors, and enjoy yourself
█ NOTES
• We have no control over when realtime updates occur. A realtime bar can open, and then no realtime updates can occur until the open of the next realtime bar. The time between updates can vary considerably. For more please check out Pine's execution model and bar states.
• As a reminder, I did make this script for myself so if you find that you are using a 2-hour alert or countdown the formatting for the words may not be succinct as they should be. We will write that loss off to my growing pine skills
█ LIMITATIONS
• You will not be able to retrieve the time from a timeframe smaller than what is currently selected for the chart.
