Combo Backtest 123 Reversal & Ease of Movement (EOM) This is combo strategies for get a cumulative signal.
First strategy
This System was created from the Book "How I Tripled My Money In The
Futures Market" by Ulf Jensen, Page 183. This is reverse type of strategies.
The strategy buys at market, if close price is higher than the previous close
during 2 days and the meaning of 9-days Stochastic Slow Oscillator is lower than 50.
The strategy sells at market, if close price is lower than the previous close price
during 2 days and the meaning of 9-days Stochastic Fast Oscillator is higher than 50.
Second strategy
This indicator gauges the magnitude of price and volume movement.
The indicator returns both positive and negative values where a
positive value means the market has moved up from yesterday's value
and a negative value means the market has moved down. A large positive
or large negative value indicates a large move in price and/or lighter
volume. A small positive or small negative value indicates a small move
in price and/or heavier volume.
A positive or negative numeric value. A positive value means the market
has moved up from yesterday's value, whereas, a negative value means the
market has moved down.
WARNING:
- For purpose educate only
- This script to change bars colors.
Wyszukaj w skryptach "backtest"

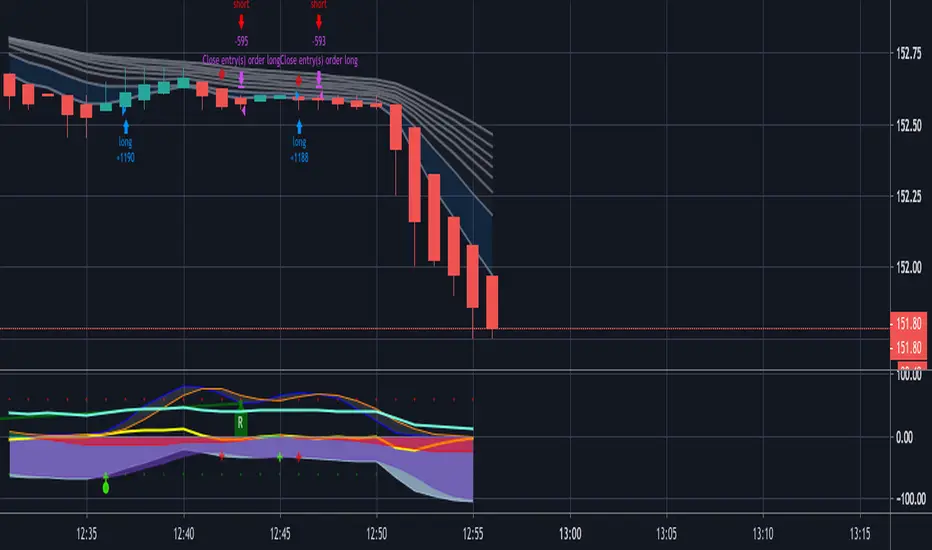
Profit Sniper 2.0 | BACKTESTProfit Sniper 2.0 Backtest now offering up huge improvements, including multiple position triggers, derived from Bollinger Bands and Chande Momentum as well as our own bespoke stochastic ribbons that provide trend pivots .
Profit Sniper now works with regular Japanese candles, however, still provides the flexibility of Heiken Ashi settings for certain elements of the indicator, this allows the accuracy of Japanese candlestick prices, and the smooth trends of HA.
Profit Sniper 2.0 has been specifically re-written for use with automation, including our own in-house trading robot known as C.A.T (Crypto Algo Trader) and as such we have chosen to remove several noisy elements of the now defunct Profit Sniper that were underused, such as the PPO and RSI variants.
Another big decision was to remove the MACD from the indicator package, as invariably users preferred using the built in MACD .
So how does it work?
HUNT
In true Sniper fashion, when our stochastic HA ribbons pivot between short and long trends, the indicator will offer up a colour coded flag the says “1. HUNT” green for long, red for short.
SIGHT
At this stage, the indicator is now looking for a second condition, this is displayed as “2. Sight” at this point the indicator as noticed a drop in the previous momentum, to pre-empt a flip between long and short. Red is for short, green is for Long
FIRE
The final condition to be met, is based on the positioning of the Bollinger Bands , which is show as the “3. Fire Flag” again, as with hunt and sight, red is for short and green is for long.
User parameters allow traders to add trailing stop, toggle between percentage and USD value, as well as edit all the indicator settings in both HA and JPY Candles providing higher accuracy in the forecast rate.
** Please note, that trade execution occurs at the open of the candle after the FIRE condition is met, this means that it is likely that the back test may throw up slightly worse results than in real time trading with using CAT as CAT will execute on Bollinger moving average line in real time.

Combo Backtest 123 Reversal & DSS Bressert This is combo strategies for get a cumulative signal.
First strategy
This System was created from the Book "How I Tripled My Money In The
Futures Market" by Ulf Jensen, Page 183. This is reverse type of strategies.
The strategy buys at market, if close price is higher than the previous close
during 2 days and the meaning of 9-days Stochastic Slow Oscillator is lower than 50.
The strategy sells at market, if close price is lower than the previous close price
during 2 days and the meaning of 9-days Stochastic Fast Oscillator is higher than 50.
Second strategy
Double Smoothed Stochastics (DSS) is designed by William Blaw.
It attempts to combine moving average methods with oscillator principles.
WARNING:
- For purpose educate only
- This script to change bars colors.

Combo Backtest 123 Reversal & Donchian Channel Width This is combo strategies for get a cumulative signal.
First strategy
This System was created from the Book "How I Tripled My Money In The
Futures Market" by Ulf Jensen, Page 183. This is reverse type of strategies.
The strategy buys at market, if close price is higher than the previous close
during 2 days and the meaning of 9-days Stochastic Slow Oscillator is lower than 50.
The strategy sells at market, if close price is lower than the previous close price
during 2 days and the meaning of 9-days Stochastic Fast Oscillator is higher than 50.
Second strategy
The Donchian Channel was developed by Richard Donchian and it could be compared
to the Bollinger Bands. When it comes to volatility analysis, the Donchian Channel
Width was created in the same way as the Bollinger Bandwidth technical indicator was.
As was mentioned above the Donchian Channel Width is used in technical analysis to measure
volatility. Volatility is one of the most important parameters in technical analysis.
A price trend is not just about a price change. It is also about volume traded during this
price change and volatility of a this price change. When a technical analyst focuses his/her
attention solely on price analysis by ignoring volume and volatility, he/she only sees a part
of a complete picture only. This could lead to a situation when a trader may miss something and
lose money. Lets take a look at a simple example how volatility may help a trader:
Most of the price based technical indicators are lagging indicators.
When price moves on low volatility, it takes time for a price trend to change its direction and
it could be ok to have some lag in an indicator.
When price moves on high volatility, a price trend changes its direction faster and stronger.
An indicator's lag acceptable under low volatility could be financially suicidal now - Buy/Sell signals could be generated when it is already too late.
Another use of volatility - very popular one - it is to adapt a stop loss strategy to it:
Smaller stop-loss recommended in low volatility periods. If it is not done, a stop-loss could
be generated when it is too late.
Bigger stop-loss recommended in high volatility periods. If it is not done, a stop-loss could
be triggered too often and you may miss good trades.
WARNING:
- For purpose educate only
- This script to change bars colors.

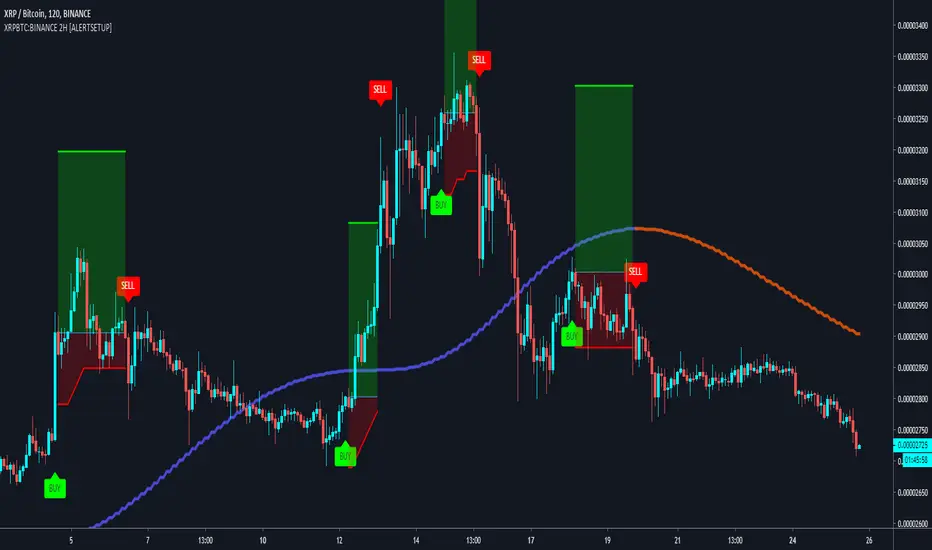
Buy & Sell XRPBTC:BINANCE 2H Trading BotBuy & Sell Alert system for BINANCE:TRXBTC
Goal is to Beat Buy & Hold on the 2H (see backtest below)
Built upon the Supertrend, ADX and Tilson T3 indicators.
A trailing Stop loss in integrated to the script, as well as a Take profit system.
To get the indicator, please use the link below, thanks!
BEST ABCD Pattern StrategyHello traders
This is the strategy version of this script
I - Concept
I present to you, ladies and gentlemen, the first screener for harmonic patterns.
Starting with an ACBD pattern screener this time!!
I used the calculations from Ricardo Santo's script
In short, he's using fractals (regular or Bill Williams ) for the pattern calculations. A masterpiece !!!
II - Definitions
The ABCD pattern ( AB=CD ) is one of the classic chart patterns which is repeated over and over again.
The ABCD pattern shows perfect harmony between price and time.
The Williams Fractal is an indicator, developed by Bill Williams, that aims to detect reversal points (highs and lows) and marks them with arrows.
Up fractals and down fractals have specific shapes. The Williams Fractal indicator helps users determine in which direction price will develop
💎Strategy filters💎
I included some cool backtest filters:
- flexible take profit in USD value (plotted in blue)
- flexible stop loss in USD value (plotted in red)
The take profit and stop loss should work with Forex/FX pairs as well
All the BEST
Dave

Combo Backtest 123 Reversal & CMOaDisparity Index This is combo strategies for get a cumulative signal.
First strategy
This System was created from the Book "How I Tripled My Money In The
Futures Market" by Ulf Jensen, Page 183. This is reverse type of strategies.
The strategy buys at market, if close price is higher than the previous close
during 2 days and the meaning of 9-days Stochastic Slow Oscillator is lower than 50.
The strategy sells at market, if close price is lower than the previous close price
during 2 days and the meaning of 9-days Stochastic Fast Oscillator is higher than 50.
Second strategy
The related CMOaDisparity Index article is copyrighted material from Stocks & Commodities Dec 2009
My strategy modification.
WARNING:
- For purpose educate only
- This script to change bars colors.

Combo Backtest 123 Reversal & Directional Trend Index (DTI) This is combo strategies for get a cumulative signal.
First strategy
This System was created from the Book "How I Tripled My Money In The
Futures Market" by Ulf Jensen, Page 183. This is reverse type of strategies.
The strategy buys at market, if close price is higher than the previous close
during 2 days and the meaning of 9-days Stochastic Slow Oscillator is lower than 50.
The strategy sells at market, if close price is lower than the previous close price
during 2 days and the meaning of 9-days Stochastic Fast Oscillator is higher than 50.
Second strategy
This technique was described by William Blau in his book "Momentum,
Direction and Divergence" (1995). His book focuses on three key aspects
of trading: momentum, direction and divergence. Blau, who was an electrical
engineer before becoming a trader, thoroughly examines the relationship between
price and momentum in step-by-step examples. From this grounding, he then looks
at the deficiencies in other oscillators and introduces some innovative techniques,
including a fresh twist on Stochastics. On directional issues, he analyzes the
intricacies of ADX and offers a unique approach to help define trending and
non-trending periods.
Directional Trend Index is an indicator similar to DM+ developed by Welles Wilder.
The DM+ (a part of Directional Movement System which includes both DM+ and
DM- indicators) indicator helps determine if a security is "trending." William
Blau added to it a zeroline, relative to which the indicator is deemed positive or
negative. A stable uptrend is a period when the DTI value is positive and rising, a
downtrend when it is negative and falling.
WARNING:
- For purpose educate only
- This script to change bars colors.

Combo Backtest 123 Reversal & DiNapoli Detrended Oscillator This is combo strategies for get a cumulative signal.
First strategy
This System was created from the Book "How I Tripled My Money In The
Futures Market" by Ulf Jensen, Page 183. This is reverse type of strategies.
The strategy buys at market, if close price is higher than the previous close
during 2 days and the meaning of 9-days Stochastic Slow Oscillator is lower than 50.
The strategy sells at market, if close price is lower than the previous close price
during 2 days and the meaning of 9-days Stochastic Fast Oscillator is higher than 50.
Second strategy
DiNapoli Detrended Oscillator Strategy
WARNING:
- For purpose educate only
- This script to change bars colors.

BEST Engulfing + Breakout StrategyHello traders
This is a simple algorithm for a Tradingview strategy tracking a convergence of 2 unrelated indicators.
Convergence is the solution to my trading problems.
It's a puzzle with infinite possibilities and only a few working combinations.
Here's one that I like
- Engulfing pattern
- Price vs Moving average for detecting a breakout
Definition
Take out the notebooks :) and some coffee (good for focus). I'm bullish in coffee
The engulfing pattern is a two-candle reversal pattern.
The second candle completely ‘engulfs’ the real body of the first one, without regard to the length of the tail shadows.
The bullish Engulfing pattern appears in a downtrend and is a combination of one red candle followed by a larger green candle
The bearish Engulfing pattern appears in a downtrend and is a combination of one green candle followed by a larger red candle
Example: imgur.com
We're bored sir... what's the point of all this?
In summary, an engulfing is a pattern to track reversals. (the whole TradingView audience stands up now giving a standing ovation)
Adding the Price vs Moving average filters allows to track reversals with momentums (half of the audience collapsed because this is too awesome)
Ok sir... you picked up my interest
I included some cool backtest filters:
- date range filtering
- flexible take profit in USD value (plotted in blue)
- flexible stop loss in USD value (plotted in red)
All the best
Dave


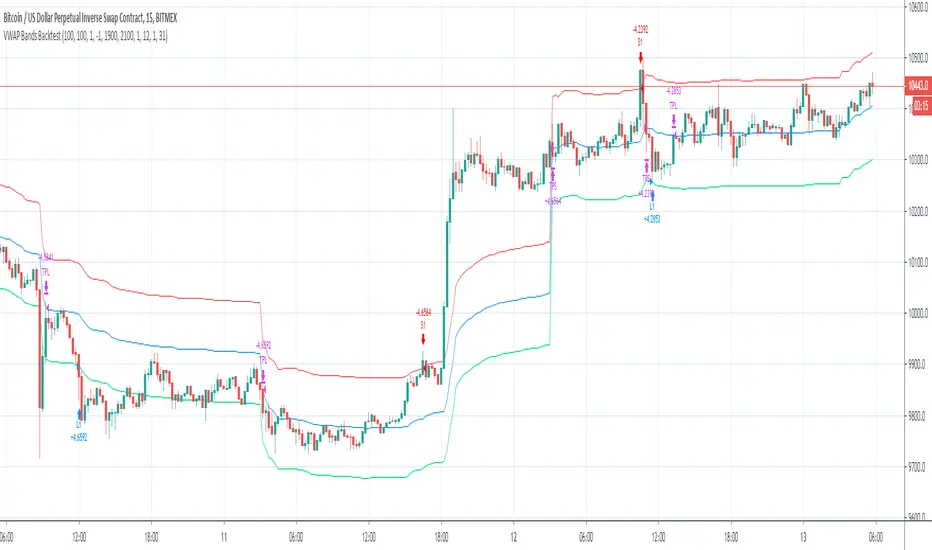
VWAP Bands BacktestThis is a backtest for evaluating the profitability of a vwap offsets strategy over time.
I took part of the code to create the script from Noro
So there is a link for its code
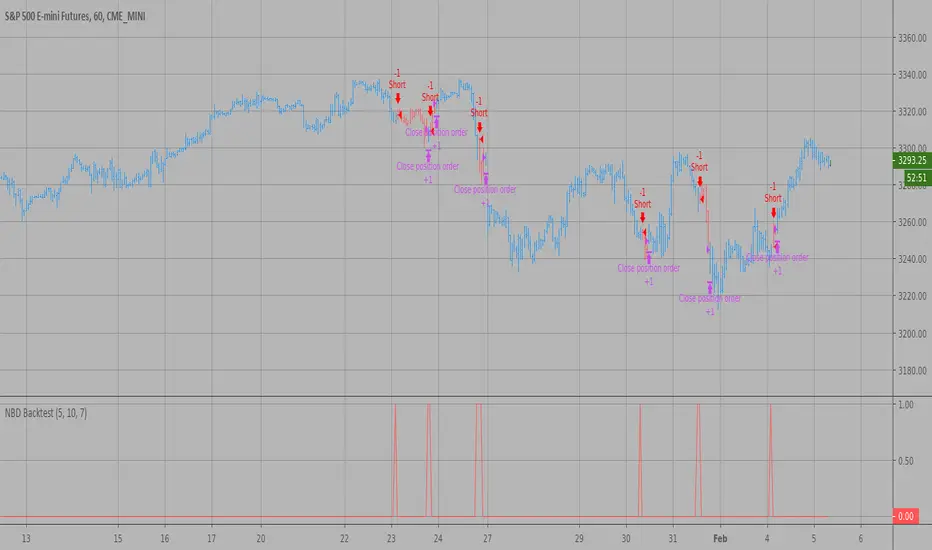
N Bars Down Backtest Evaluates for n number of consecutive lower closes. Returns a value
of 1 when the condition is true or 0 when false.
WARNING:
- For purpose educate only
- This script to change bars colors.
Key Reversal Up Backtest
A key reversal is a one-day trading pattern that may signal the reversal of a trend.
Other frequently-used names for key reversal include "one-day reversal" and "reversal day."
How Does a Key Reversal Work?
Depending on which way the stock is trending, a key reversal day occurs when:
In an uptrend -- prices hit a new high and then close near the previous day's lows.
In a downtrend -- prices hit a new low, but close near the previous day's highs
WARNING:
- For purpose educate only
- This script to change bars colors.

Key Reversal Down Backtest A key reversal is a one-day trading pattern that may signal the reversal of a trend.
Other frequently-used names for key reversal include "one-day reversal" and "reversal day."
How Does a Key Reversal Work?
Depending on which way the stock is trending, a key reversal day occurs when:
In an uptrend -- prices hit a new high and then close near the previous day's lows.
In a downtrend -- prices hit a new low, but close near the previous day's highs
WARNING:
- For purpose educate only
- This script to change bars colors.

Super cloud [Backtest]This is a valid strategy for Bitcoin.
Judge up and down trends.
In addition, the cloud can form a short-term trend can be judged.
In addition to the basic longs and shorts, you can test intermediate clearing, reentry points, and additional entry points using the cloud.
However, basic long and short are considered the most effective.
You can set the variables F, duration, and leverage that determine the backtest duration and cloud cover width.
* * *
비트코인에 유효한 전략입니다.
상승과 하락 추세를 판단합니다.
추가적으로 구름대를 형성하여 단기적인 추세 또한 판단해볼 수 있습니다.
기본적인 롱, 숏 외에 구름대를 활용한 중간 청산, 재진입 지점, 추가 진입 지점을 테스트해볼 수 있습니다.
단, 기본적인 롱, 숏이 가장 효과적인 것으로 판단됩니다.
백테스트 기간과 구름대의 폭을 결정하는 변수 F, 기간, 레버리지를 설정해볼 수 있습니다.

Volatility Breakout Daily [Backtest]If it breaks the volatility (green line) of the day, it is a strategy to buy and settle the market price(yellow line) the next day.
Valid on Bitcoin Daily Chart.
You can change the backtest period and the volatility coefficient K, leverage.
당일 변동성(녹색선)을 돌파하면 매수하고, 다음날 시가(노란선)에 청산하는 전략입니다.
비트코인 일간 차트에서 유효합니다.
백테스트 기간과 변동성 계수 K, 레버리지를 설정할 수 있습니다.

💲SuPeR-RePaNoCHa💲 [Backtest]Script for automatic trading (Backtest). This is the second part of the previous RePanoCHa script but with Take Profit.
It Use 6 indicators + volume:
-JURIK MOVING AVERAGE
-RANGE FILTER (from Donovan Wall)
-ADX (ORIGINAL VERSION)
-PARABOLIC SAR
-RSI + VOLUME WEIGHTED
-MACD
-VOLUME
To close the position you can choose between Take Profit only, Trailing Stop only or both at the same time.

MarketCipher B Backtest (FOR TESTING ONLY, NOT SAFE TO TRADE)A script to backtest the strategy outlined. This is not a final version of the script and is therefore not safe to trade. If you choose to ignore this warning, trade at your own risk.
Money Management BacktestThis non-repaint script is to backtest some different money management strategies:
- Whether to enter immediately after a signal (shaved bar) fires or wait for pullback (market vs limit order)
- Move Stoploss to breakeven (with fee calculated in) right after position starts to have UnPnL
- Take Partial Profit
SL Cap is calculated from current price to decide where to put SL
SL Padding is to add some space above High for Short position or below Low for Long position

Combo Backtest 123 Reversal & D_DSP (Detrended Synthetic Price) This is combo strategies for get a cumulative signal.
First strategy
This System was created from the Book "How I Tripled My Money In The
Futures Market" by Ulf Jensen, Page 183. This is reverse type of strategies.
The strategy buys at market, if close price is higher than the previous close
during 2 days and the meaning of 9-days Stochastic Slow Oscillator is lower than 50.
The strategy sells at market, if close price is lower than the previous close price
during 2 days and the meaning of 9-days Stochastic Fast Oscillator is higher than 50.
Second strategy
Detrended Synthetic Price is a function that is in phase with the
dominant cycle of real price data. This DSP is computed by subtracting
a half-cycle exponential moving average (EMA) from the quarter cycle
exponential moving average.
See "MESA and Trading Market Cycles" by John Ehlers pages 64 - 70.
WARNING:
- For purpose educate only
- This script to change bars colors.

DPO Strategy BacktestOriginal backtest version taken from HPotter and modified it a bit. Follows nice long trends if combined with other indicators.

🐮 🆚 🐻 [Backtest]It's a remake of the previous script but for use in reverse positions at the same time.
In this script the reality could be even better than the Backtest, because, only close the position with profit, so profitability should be 100%, and Longs and Shorts don't mix because they are independent.
In real trade, you need an exchange that allows you to go in reverse positions at the same time or where you can have two independent sub-accounts: one for long and one for short and with margin trading. Although, if TP is small and does not mix with other inverse positions, it's not necessary. (With this script, you can go long and short at the same time and with independent configurations)
Settings for ETH at 5 minutes. (If you find good settings please comment)
Enjoy!
