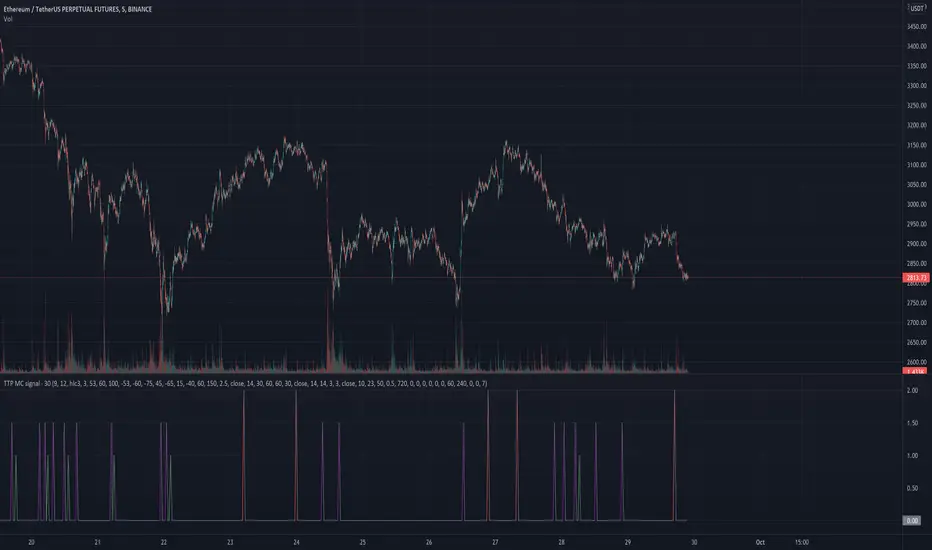
TTP MC signalThis signal is based on Market Cipher.
It triggers a 1 for a buy the divergence signal which is less frequent and more conservative.
It triggers a 1.5 for the normal signal which is more frequent and more risky.
It triggers a 2 for a sell signal which is also using a divergence.
You can use this values to backtest.
It contains alerts for each of the separated signals.
Wyszukaj w skryptach "backtest"
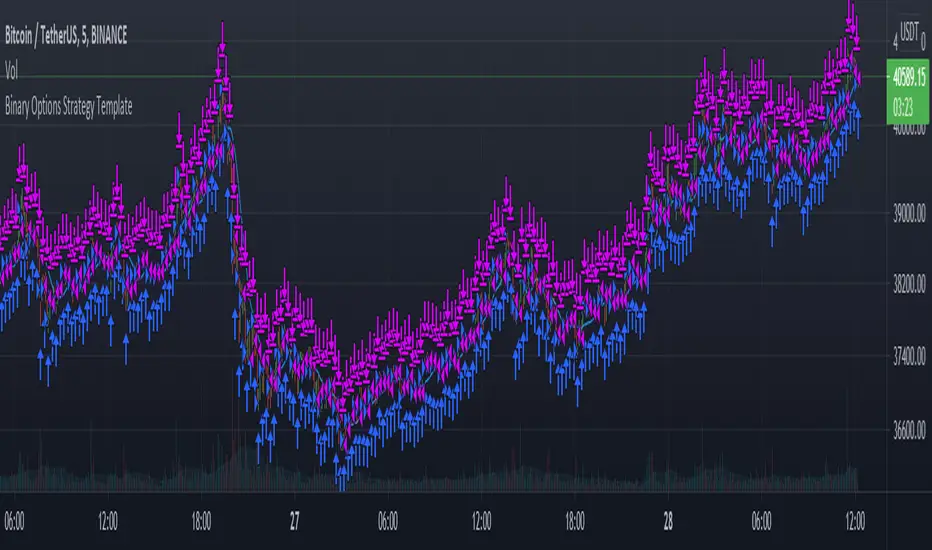
Binary Options Strategy TemplateWith the hype around Binary Options trading (more like gambling instead of trading) it is good to be able to backtest a strategy before using it in the live markets.
In a Binary Options trade the trade get's closed after a specific amount of time and the only thing that matters is if the market has increased in price or decreased after that amount of time.
Because of this a strategy backtest should close all positions after a specific amount of time. In this super small script the number of bars since the trade was opened is used as a way to close the position. So for example if you use this strategy on the 1 minute charts with number of bars set to 5 it will close the position 5 minutes after opening it. Purpose of this script is using it as a strategy on already existing scripts to check viability for options trading.
With the limited pine knowledge that I have I do not know if it is possible to create a more realistic binary options strategy which also calculated the profit. If someone knows a more advanced version of this please let me know.
Flawless Victory Strategy - 15min BTC Machine Learning StrategyHello everyone, I am a heavy Python programmer bringing machine learning to TradingView. This 15 minute Bitcoin Long strategy was created using a machine learning library and 1 year of historical data in Python. Every parameter is hyper optimized to bring you the most profitable buy and sell signals for Bitcoin on the 15min chart. The historical Bitcoin data was gathered from Binance API, in case you want to know the best exchange to use this long strategy. It is a simple Bollinger Band and RSI strategy with two versions included in the tradingview settings. The first version has a Sharpe Ratio of 7.5 which is amazing, and the second version includes the best stop loss and take profit positions with a Sharpe Ratio of 2.5 . Let me talk a little bit more about how the strategy works. The buy signal is triggered when close price is less than lower Bollinger Band at Std Dev 1, and the RSI is greater than a certain value. The sell signal is triggered when close price is greater than upper Bollinger Band at Std Dev 1, and the RSI is greater than a certain value. What makes this strategy interesting is the parameters the Machine Learning library found when backtesting for the best Sharpe Ratio. I left my computer on for about 28 hours to fully backtest 5000 EPOCHS and get the results. I was able to create a great strategy that might be one of TradingView's best strategies out on the website today. I will continue to apply machine learning to all my strategies from here on forward. Please Let me know if you have any questions or certain strategies you would like me to hyper optimize for you. I'm always willing to create profitable strategies!
P.S. You can always pyramid this strategy for more gains! I just don't add pyramiding when creating my strategies because I want to show you the true win/loss ratio based buying one time and one selling one time. I feel like when creating a strategy that includes pyramiding right off the bat falsifies the win rate. This is my way of being transparent with you all. Have fun trading!

RSI-VWAP Indicator %█ OVERALL
Simple and effective script that, as you already know, uses vwap as source of the rsi, and with good results as long as the market has no long-term downtrend.
RsiVwap = rsi (vwap (close), Length)
The default settings are for BTC in a 30 minute time frame. For other pairs and time frames you just have to play with the settings.
█ FEATURES
• The option to start trading from a certain date has been added.
• To make the profit more progressive, a percentage of your equity is used for entries and a percentage of your position is used for closings.
• The option to trade in Spot mode has been added, since, for the TradingView backtest, the money is infinite and if you do not limit it somehow,
it would offer you much better profits than the live trading.
QuantityOnLong = Spot ? (EquityPercent / 100) * ((strategy.equity / close) - strategy.position_size) : (EquityPercent / 100) * (strategy.equity / close)
• The option to stop the system when the drawdown exceeds the fixed limit has been added.
Drawdown, as you already know, is a very important measure of risk in trading systems.
The maximum drawdown will tell us what the maximum loss of a trading system has been during a period. This maximum loss is determined by:
strategy.risk.max_drawdown(Risk, strategy.percent_of_equity)
• Leverage plotted on labels added.
█ ALERTS
To enjoy the benefits of automatic trading, TradingView alerts can be used as direct buy-sell orders on spot, or long-close orders with leverage.
Currently there are Chrome extensions that act as a bridge between TradingView and your Exchange or Broker.
This is an example of syntax for this type of extensions. Copy and paste a message like this into the alert window:
{{strategy.order.action}} @ {{strategy.order.price}} | e = {{exchange}} a = account s = {{ticker}} b = {{strategy.order.action}} {{strategy.order.alert_message}}
█ NOTE
Certain Risks of Live Algorithmic Trading You Should Know:
• Backtesting cannot assure actual results.
• The relevant market might fail or behave unexpectedly.
• Your broker may experience failures in its infrastructure, fail to execute your orders in a correct or timely fashion or reject your orders.
• The system you use for generating trading orders, communicating those orders to your broker, and receiving queries and trading results from your broker may fail.
• Time lag at various point in live trading might cause unexpected behavior.
• The systems of third parties in addition to those of the provider from which we obtain various services, your broker, and the applicable securities market may fail or malfunction.
█ THANKS
Thanks to TradingView, its Pine code, its community and especially those Pine wizards who post their ideas that helps us to learn.
If the world is heading toward a equitable new world economic order, let's get rich first ...
Happy trading!

SmoothOps v1 - StrategyThe purpose of this script was to fine tune an indicator on BTCUSDT. I think the results speak for themselves.
This is a script that uses the MACD to predict future price movement. The original MACD signal lags too much for my taste so I went searching for something that could give signals sooner. I decided a smooth macd would help filter out noise and grabbing the highest values and lowest values over the past number of bars. I spent several days backtesting different settings and combinations of signals to arrive at what you see now. This strategy has been fine tuned for BTC/USDT on Binance, so I suggest you only use it for that. Any other coin/pair and exchange will need a new backtest since the data will be different. This is not a generalized indicator like everything else. It's specifically good at one thing: prediction BTCUSDT on Binance.
Use this in combination with the Study version so you can visually see what is happening when you change settings.
How to use:
Use only on BTCUSDT Binance
Set the preset to the timeframe you want. I HIGHLY suggest only using the 1h timeframe. It gives the best profit over time
Set the preset to custom if you want to try using your own settings.
You can change the source input if you want. ohlc4 usually works best for 1h
Change the date range if you want to do a specific timeframe.
Change the stop loss % if you want, but I didn't find much of a difference when using it on 1h

Custom Triple Moving Average Strategy | Auto BacktestingCreate your own MA Strategy set of up to three moving averages!
Auto Backtesting.
Cloud between MA1 and MA2.
Many different MA types to choose from.
Totally Custom!
Happy Trading, and algorithm analysis!
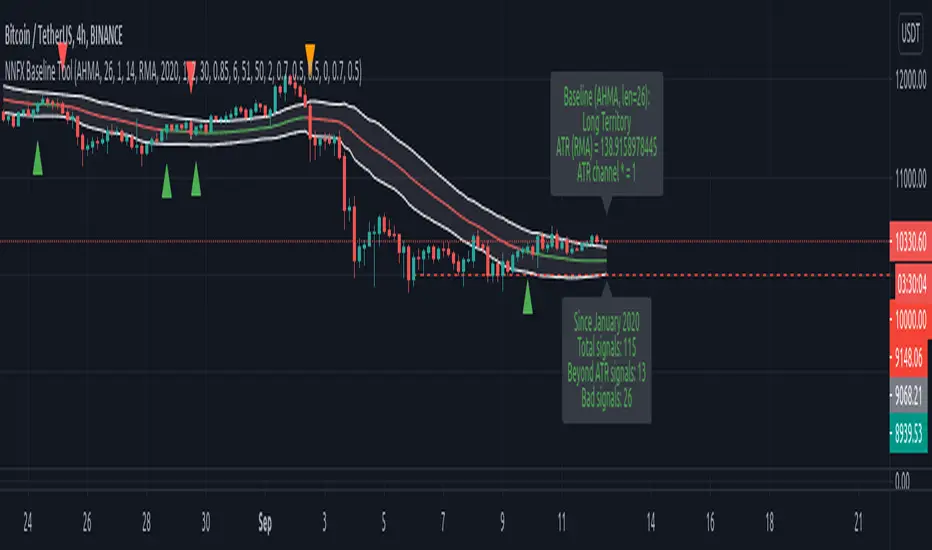
NNFX Baseline ToolNNFX All-in-One Baseline display / test tool.
This is usefull (hopefully) for the NNFX way of trading only. It's not intended to be used as a standalone tool.
Basically, this script displays and tests many types of Moving Averages as baselines.
It displays baseline signals, based on the NNFX ATR-related rule for baseline entries.
It can be used as a backtest tool, or plugged into the whole nnfx algo.
If signal display option is enabled, signals are displayed on chart : green for long, red for short, orange for crossovers beyond the ATR channel :
Many baselines available : SMA , EMA , WMA , VWMA , ALMA , AMA, SMMA , DEMA , FRAMA , HULL, KAMA , KIJUN, JURIK, LAGUERRE, MCGINLEY , TMA1, TMA2, VIDYA , MODULAR FILTER, VAMA , ZLEMA , T3, LSMA, etc.
Additional options :
- multiplying the ATR channel (and subsequent rule) by a factor (default = 1)
- plot the ATR channel (def = yes)
- fill it (def = yes)
- display signals (def = yes)
- option for add color to the baseline, for long/short territory (2 different options : baseline is colored, background is colored)
- darkmode / lightmode color option. (def = dark)
We also display panels, with general information and some test results. Tests are done within the test period.
I tried to test all the different MAs included in the script but some bugs might still be present, so use it at ur own risk.
If you'd like a new MA option added, please let me know in comments.
I included a "bad" signal detection, it can help for tweaking the settings. Signals are defined as "bad" when they are immediately followed by another signal.
When there is 2 or more bad signals next to another, you spotted a chopiness zone (a chopiness zone is defined as a zone where BL get eaten alive).
Example :
to do :
- plug it with the c1/c2 backtest tool (it's the whole point)
- add alerts,
- add more ma types
- stop to use the operator, it's not convenient at all
- add wr% calculation as a standalone feature (with TP / SL)
- add a way to measure chopiness in the test (dont know how yet)
- detect & display chopiness zones
I asked other users when I used their ideas (for some particular types of MAs). They all agreed.
Scaling The Bull (STB) - StrategyThis is one of my powerful strategy which I might probably have ever came up. After a lot of backtesting over multiple timeframes and testing different values of the indicator on those multiple timeframes I finally came to a point where this indicator reaches its ultimate goal " Higher Reward Than Risk ". The final result is fantastic as you all can see it's trading performance report where the Net Profit floating around 100%+ also within a month! Yes, you heard it right it's a strategy which has been created solely based on 1 minute main timeframe and has done backtest over nearly 1-month historical data where we can see the drawdown % is only 20% while the net profit is 100%+ of the total initial capital which I kept fix around $1,000 (for the purpose of realistic result). Let me aware you all this that I have made this strategy using fixed contract size or we can say unit size which is 50,000 units (or in forex world 5 mini lots) so, every trade executes constantly with 5 mini lots size but you can change this from the strategy setting. I'm doing this all in the sense of leverage trading in the forex market and please don't forget it I made this strategy in first place for forex trading only for now so, I had made the strategy in the sense of leverage trading of '1:100' in the forex market which is why I kept fix contract size or we say unit size . Every trade is executed on 5 mini lots and I also set up a broker commission just to make it nearly like a real trading account report. This strategy has been made by using a famous oscillator indicator Relative Strength Index (RSI) in conjunction with my own tactics. This strategy was build in an AUD denominated account so you can see the calculation are all done in the Aussie currency but everything is changeable from the setting of the strategy which I mentioned above already. This strategy has only been made for AUDUSD on a 1minute main timeframe and it won't work in different pairs or with different timeframes or different strategy settings but you can test if you are lucky you may find for sure. The strategy usage a powerful tactic which is Scaling in the bullish trend. It usages Relative Strength Index (RSI) in conjunction with my own tactic in the calculation to enter or add only a long (buy) position. It doesn't care about the short (sell) position and totally ignores it. It has been created in such a way just to eliminate unnecessary bogus signals and to avoid making multiple directional trades as it might not make more profit but it will also not end up with huge trade reports with many potential losses. Trading in one direction and also scaling in on that certain long direction (in our case long side) is a great feature of this strategy.

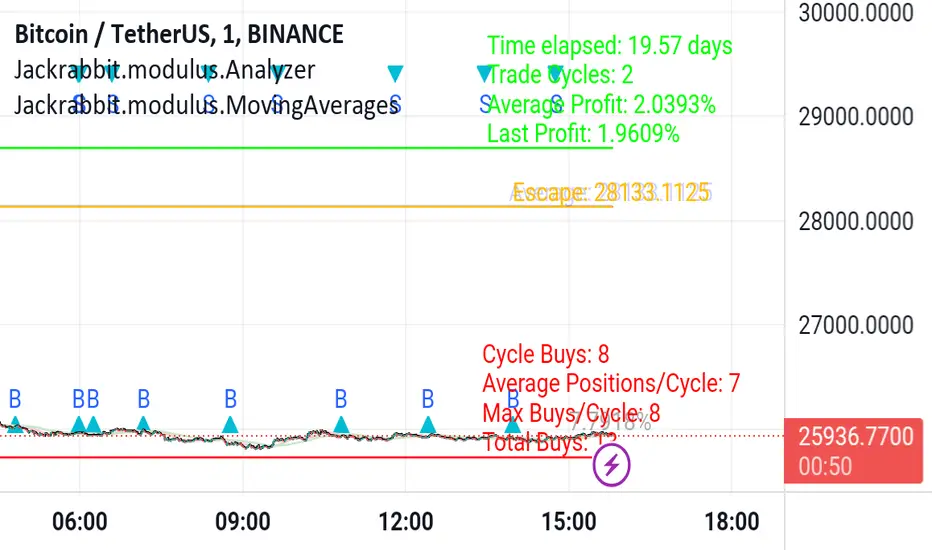
Jackrabbit.modulus.AnalyzerThis is the module Analyzer for the Jackrabbit suite and modulus framework.
As the modulus framework has grown both in size and complexity, it has become ever increasingly difficult to evaluate the profitability a very complex multi-layered modules combined.
The Jackrabbit Analyzer module allows you to do just that. Connect this module to the end of your IoI chain and it will tell you the profitability of your current combination, using TradingView's strategy backtesting capabilities.
With this module connected to your IoI chain, you can literally watch in real time as the analyzer evaluates your current settings and updates each time you make a change in those settings, giving you a better and more realistic approach to what is possible with your current strategy.
While this module is not a substitute for paper trading, it significantly increases the construction and analysis of a multi-layered trading paradigm that can then be taken to a paper trader with a high level of confidence of success.
Only the signal line is displayed.
The Jackrabbit modulus framework is a plug in play paradigm built to operate through TradingView's indicator on indicatior (IoI) functionality. As such, this script receives a signal line from the previous script in the IoI chain, and evaluates the buy/sell signals appropriate to the current analysis.
This script is by invitation only. To learn more about accessing this script, please see my signature or send me a PM. Thank you.
HFT Momentum BacktesterDefault Settings are meant to be used in XBT/USD chart on 1 hour time frame. If you want to use for another asset on another time frame YOU MUST CHANGE THE SETTINGS
This is momentum-based strategy designed by HFT Research in order to take advantage of volatile, trending markets.
Use ADX
ADX stands for average directional index . It is an indicator that measures volatility in the market. Unfortunately, the worst market condition for this strategy is sideways market. ADX becomes a useful tool since it can detect trend. If the volatility is low and there is no real price movement, ADX will pick that up and will not let you get in trades during a sideways market. It will allow you to enter trades only when the market is trending.
Use MA CrossOver
This strategy’s main driver is the moving average cross over however, unlike many other indicators, this strategy has ALL the moving averages that are on trading view. Total of 13 different moving averages all calculated in a different fashion available in a drop-down menu. You are able to choose two different moving averages to cross for your entry as well as being able to adjust the length of each individual moving average.
Use MA Spread % Filter
As an extra protection, we introduced MA spread % filter. We all know that momentum strategy works when there is actually a trend that has momentum. When there is no trend and market side choppy, we get a lot of noisy signals. In order to battle that we have introduced MA spread % filter. Using this piece of setting, you will be able to chose how strong the cross over actually is. If price is moving sideways, the moving averages will cross each other barely. If the price has actually any steam and momentum, MA 1 will cross over MA 2 aggressively because it will be trending market.
First you chose what the minimum % difference there should be between your 2 moving averages. If you keep this too tight, it won’t be as useful and if you keep this too large then the script will not generate any signals. Trust us, there is a fine balance in between! Then you proceed to chose your moving averages that the bot should keep track of.
Check our website for more information.
Backtest assumes the following;
You have 1000$ to trade
You use 1% of your capital on cross margin with 1% Stop Loss. Therefore, every trade has 100% equity effect on your balance and 1% stop loss has 1% loss effect
0.06% commission taking Binance as base. Please change commission if you are using another exchange.

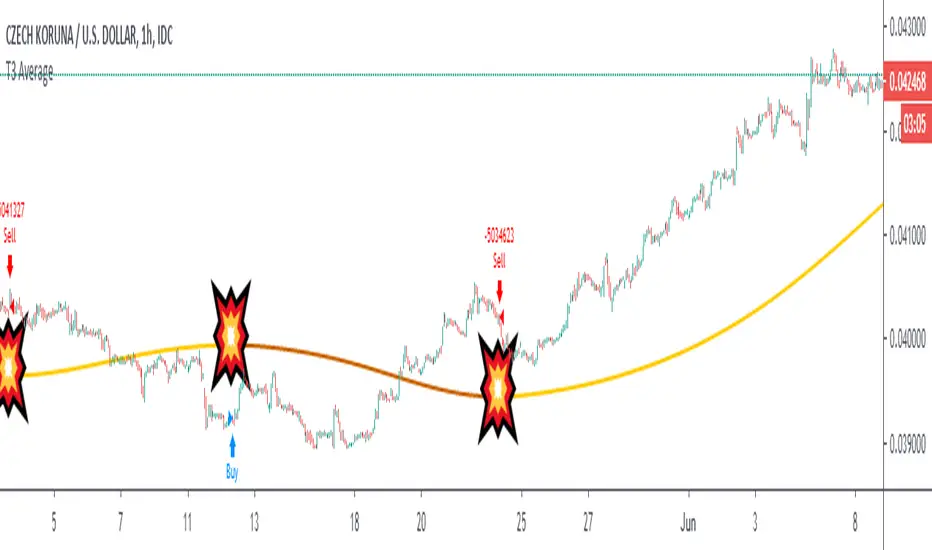
T3 Explosive Moving Average BacktestA simple backtesting algorithm for my joke indicator T Explosive Moving Average
• Buys when it starts to ascend
• Sells when it starts to descend
• Switch the wires to reverse this logic
Some currencies show good results with 75 on daily, 65 (reverse wires) on 4h and 210 (reverse wires) on 1h
To be clear, this strategy has no stop-loss which leads to large drawdowns and unreliability of the backtesting data. It shows some performance but it is still a joke. And unless you like T3 moving average calculation, don't use it, perhaps.
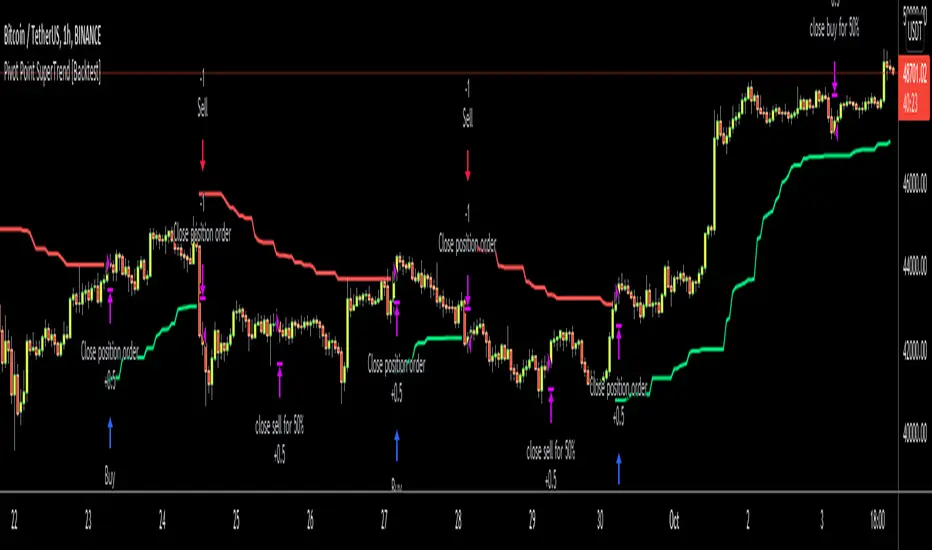
Pivot Point SuperTrend [Backtest]Hello All,
This is backtesting result of following indicator/strategy. I didn't work on adding other indicators. maybe in the future I can try to combine this with other indicators.
You can visit following link to see "Pivot Point SuperTrend" . by using this backtesting tool, you can test&find better options
There is option "Use Center Line to Close Entry for 50%" . by default it's not enabled. if you enable this option, pivot point center line may push you to close your entry for 50% (can be used as early stoploss/take profit line if you think it's risky)
Enjoy!

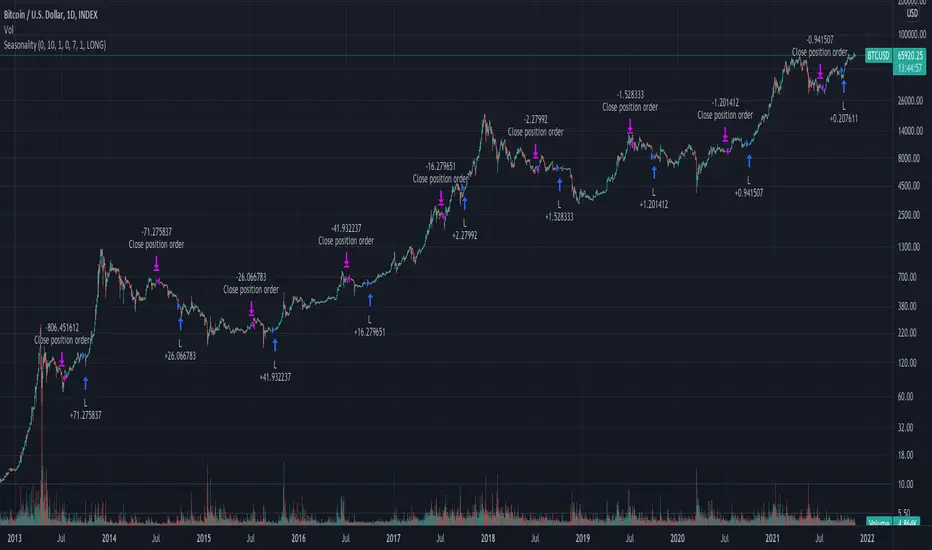
How To Set Trade Dates
Example how to backtest specific date(s) which can be useful for testing seasonality strategy ideas such as "Sell in May", etc.
If using Daily period with wild card dates it will not trade on 1st day of month. If market is closed will trade on next open day.
Works only with Daily or lower timeframes. When using on Daily timeframe set dates 1 day earlier to execute on desired dates.
Entering 0 in any of the date fields acts a wild card. Example -> Entry Year: 0 is "Every Year", Exit Month: 0 is "Every Month", etc.
NOTICE: This is an example script and not meant to be used as an actual strategy. By using this script or any portion thereof, you acknowledge that you have read and understood that this is for research purposes only and I am not responsible for any financial losses you may incur by using this script!
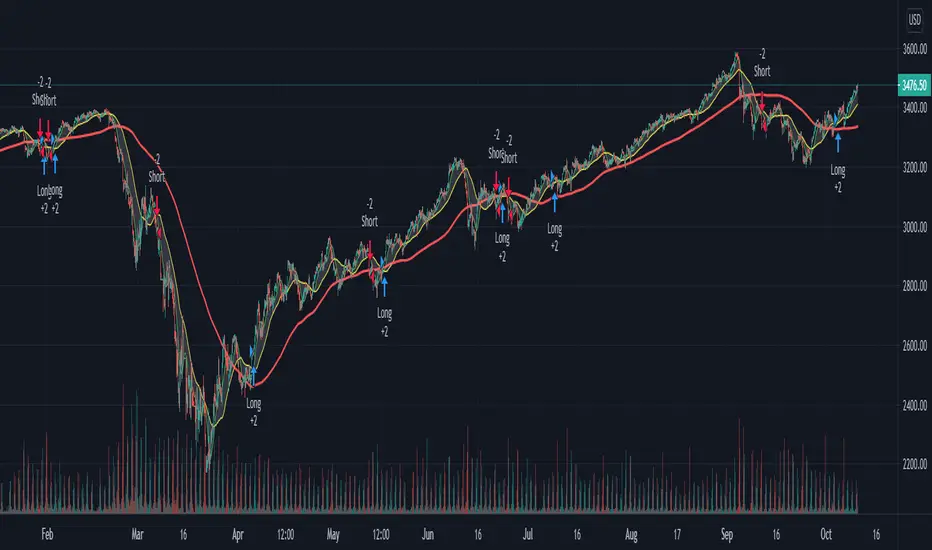
kiska clouds backtest editionkiska clouds: crypto twitter's next cloud meme
Crypto is a fast-paced, highly-volatile asset, therefore, many traditional strategies are thrown out of the window when applied to cryptocurrency markets. In trading, there are only two things known for sure: price and volume . Price and volume data is then manipulated using various math equations in an effort to discover patterns and/or make predictions. kiska clouds are no different.
The kiska clouds are a simple crossover strategy. The clouds are different because of the unique averages being used and the embedded momentum indicator .
To use the clouds is simple:
When the green line crosses above the pink line, you buy/long.
When the green line crosses below the pink line, you sell/short.
The clouds are indicative of the trend's momentum. Using the power of math, the larger the cloud indicates a higher amount of buying/selling pressure. As the cloud thins, momentum is slowing, and the trend may be reversing.
At the time of testing, the strategy had a profitability of 54.55% accuracy with 1133.41% net profit. While I think this could be automated into a bot, adding a human element with stop losses and further analysis will significantly improve the accuracy/profitability.
This indicator is the backtest version of the kiska clouds (). For a trial or to purchase this indicator, send me a message on Twitter @moonkiska or here on TradingView. You will be granted a 2-3 day trial period to the backtesting strategy.

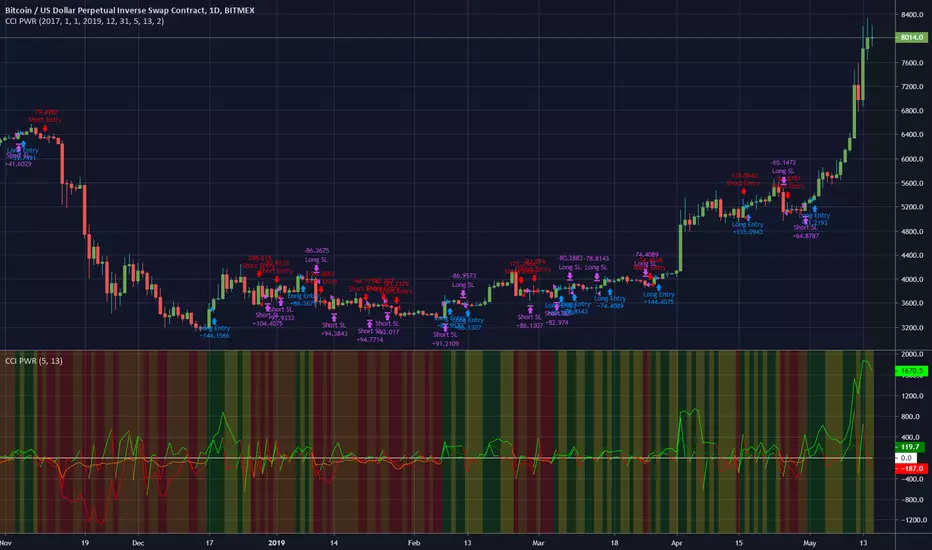
CCI PWRThis is a backtest for my CCI PWR indicator here . It works very well on a daily chart but may be useful for lower timeframes.
You can change the backtest settings to test different periods of time.
I have included a stop-loss function that will exit a trade if the price goes against the signals. The parameter is an integer that represents a %age of the current price, so for example, a value of 2 would mean a stoploss is set 2% below a long entry or 2% above a short entry.
Here is an image of ETH/BTC with the same settings.
Let me know if you find it useful!
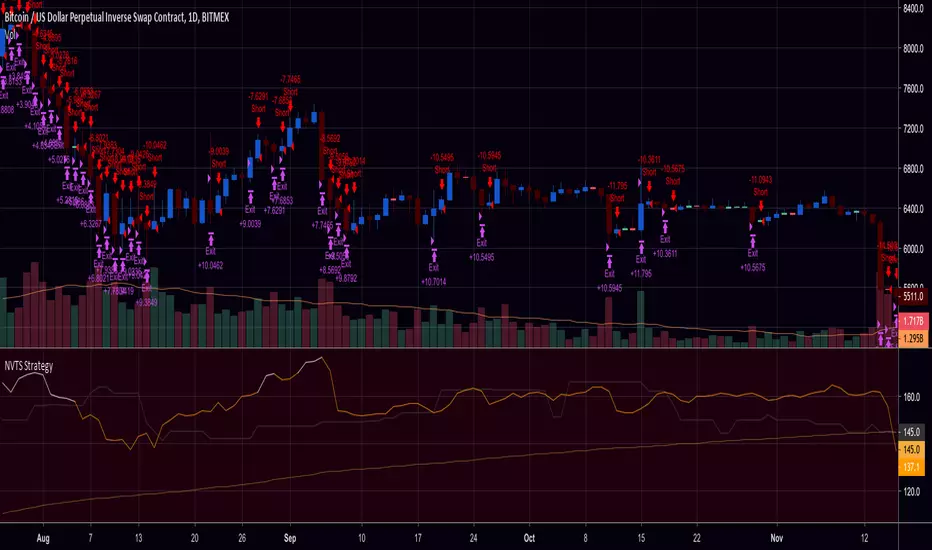
NVT Signal with RMA and Thresholds (Strategy / Backtest)This is the strategy w/ backtester and trailing-stop / stop-loss for kishin's NVT alerts
Ergotic MACD Strategy [forked from HPotter]Ergotic MACD Strategy forked from HPotter
In addition to this fine script you will find some additional features:
- Backtester
- Alerts
- Filters: RSI, MFI, Price trend
- Trailing Stop Loss
- Other minor adjustments

Strategy Backtester TemplateA template for building a strategy tester:
- date range selector
- stop loss
- take profit
- long and short strategy type selector

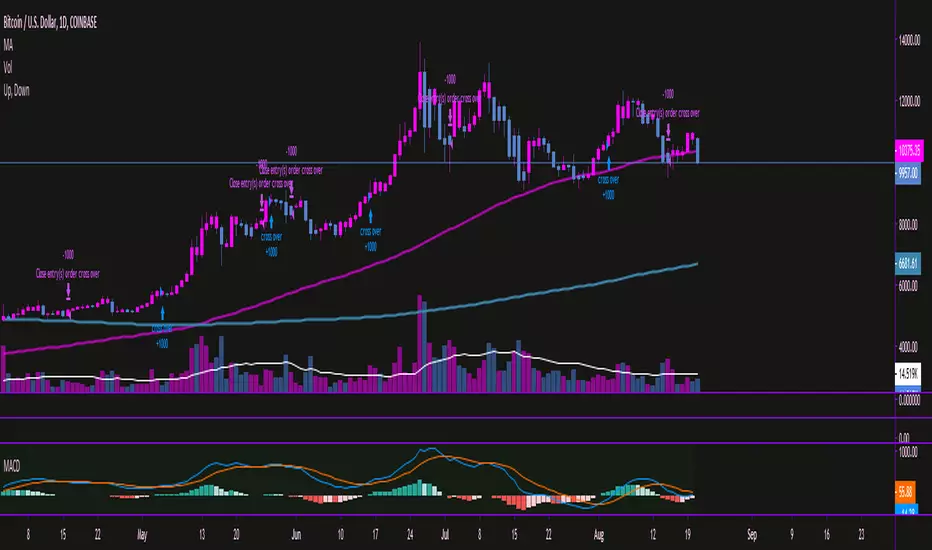
Moving Average Convergence/Divergence MaCD BackestingMade this to backtest simple macd trading strategy, had to set it to open long and short positions because i'm not sure how you get it to calculate otherwise.
08-18 EMA Watson [BACKTEST][STRATEGY] BTC/USDTHello, it has been a while since I published something, I have been working on webdev in the last months but Here I Am again with a brand new strategy, I called it EMA Watson lol (no I'm not a fan)!
Recently Bitcoin has been outperforming almost all altcoins so I made a script for trading Bitcoin against USDT. This script should be used on a pair that is in an uptrend, just like BTC/USDT today. The script is coded in such a way that it won't make any trade if the trend goes bearish.
This is a simple buy and sell strategy, that can be used for manual trading or for a trading bot. The strategy is based upon the Exponential Moving Average trading rules, and I added my personnal touch of course.
I give access for free, just leave a comment.
More info about the script, such as inputs description, how to configure the script, strategy explanation, alert configuration can be found here : blockchainfiesta.com
The Alert Setup (indicator) script should be uploaded soon on my profile.
--------------------------------------------------------------------------------------------------------------
Commission Work: TradingView development, Reverse Engineering, Pine Script. contact@blockchainfiesta.com. You can also send me a message in TradingView or Discord
If you have too much crypto and want to help me out:
BTC address: 19sVQvCDmVfEACq7BiMnWSMqFPZ8qfSQ2K
ETH address: 0xc8a5d3a63a05db0c2363ea1c08b37a01cce9ebfb
[STRATEGY]Kagi Emulator OCC & SLTP V3It is a Kagi candle emulator without resolution multiplier.
Also with take profit and stop loss.
Modify the value of "reversal" according to current symbol.
It's the backtest, coming soon, same script but with no-repainting alerts
Enjoy!

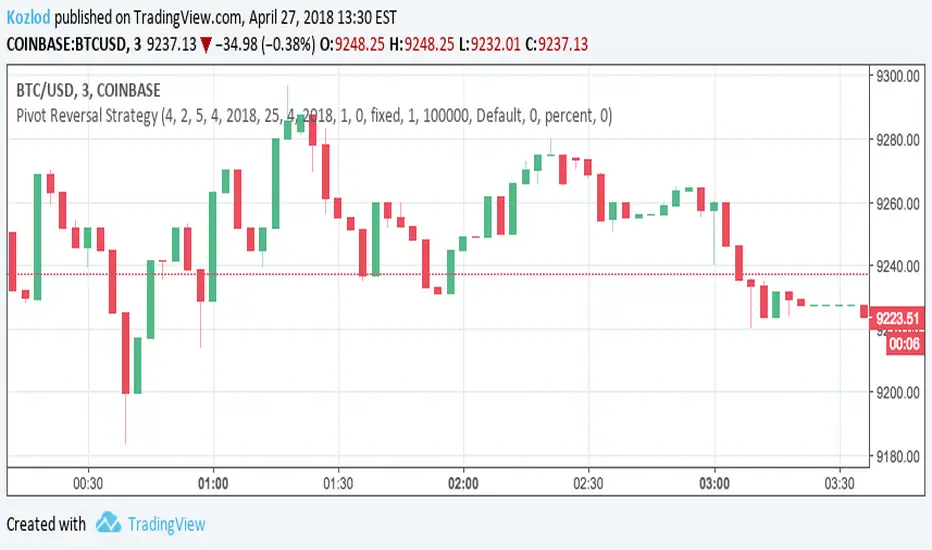
Pivot Reversal Strategy with backtest date rangeThis is standard Pivot Reversal Strategy with backtest date range added.
In parameters you can select from/to date for backtesting range.