CB Signals - Holla-724 BITMEX ETH/USD Long/Short (PAID ALGO)This algo uses a number of strategies developed from 7 yrs of trading this concept in the FX markets. I have modified it for Leverage trading on BITMEX exchange.
You may view detail summary of live performance of this Algo dating from Jan 1st 2018 - Jan 17th 2019 (In one of Crypto's worst bear markets) below by clicking the "Performance Summary" Tab:
To signup for this algo please visit the link below:
www.cryptoblood.io
Wyszukaj w skryptach "algo"

CryptoMedics Algorithmic Trading BandsCryptoMedics are happy to announce the release of our new Algorithmic trading bands!
The Bands can be used as dynamic support and resistance levels. Anything from scalping on the 1m chart to swing trading on the daily. The opportunities are endless.
Developed using tried and tested methods that hedge funds from wallstreet to smart individual traders have used for years now. Now all available to you.
Here is an example of scalping with it on the 3m chart on BCHZ18. If you would've used 10x leverage you would've made a total of 760%!
Examples:
Another example on XBTUSD using the bands to catch a swing trade
These results are undeniably good and I bet you can't find similar ones with any other indicator!

CryptoMedics Algorithmic Trading Bands CryptoMedics are happy to announce the release of our new Algorithmic trading bands!
The Bands are used as dynamic moving support and resistance levels and can be used for anything from scalping on low timeframes to swing trading larger moves.
An example of this would be if a coin pumped 20% and you're expecting it to go up more you wait for it to return to either the upper middle or one of the core bands and long it there.
The amount of usecases for this indicator is endless.
Developed using tried and proven methods that everyone from private individuals to wallstreet hedge funds have used. Now available to CryptoMedics subscribers.
The indicator works across any assets since it isn't based on any pair-specific data but rather more broad data that exists on all trading pairs.

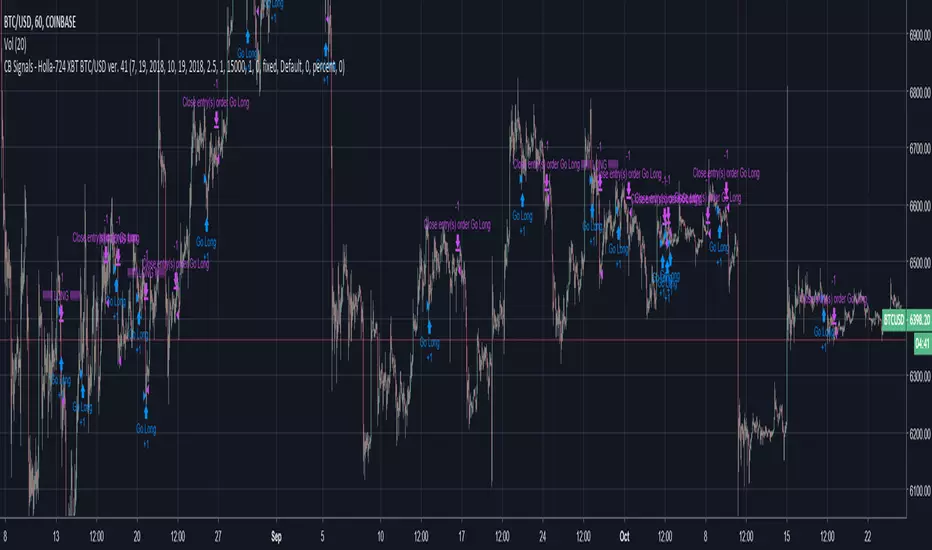
CB Signals - Holla-724 BITMEX BTC/USD Long/Short (Paid Algo)This algo uses a number of strategies developed from 7 yrs of trading this concept in the FX markets. I have modified it for Leverage trading on BITMEX exchange.
You may view detail summary of live performance of this Algo dating from Jan 1st 2018 - Nov 9th 2018 (In one of Bitcoin's worst bear markets) below by clicking the "Performance Summary" Tab :
To signup for this algo please visit the link below:
www.cryptoblood.io

FT-Algos SuperFT-Algos: Unified Alpha Suite
FT-Algos is an all-in-one Pine Script indicator designed to support traders across scalping and swing trading styles with unique multi-strategy logic and clear signals.
Key Features:
Three Trading Modes:
Quick Scalps — Fast momentum-based entries optimized for ultra-short timeframes.
Precision Scalps — Combines MACD flips, Kalman smoothing, Gaussian filters, ZLEMA, and Heikin Ashi SuperTrend to generate high-confidence scalping signals.
Swing Trades — Uses trend stacking with Kalman, ZLEMA, and MACD crossovers confirmed by higher timeframe SuperTrend direction.
Non-Repainting Signals: All entries rely on confirmed candle closes to avoid repainting and false signals.
Visual Entry Markers: Compact BUY and SELL triangle labels placed directly above/below candles for clear signal visualization.
Dynamic Take Profit and Stop Loss Levels: Calculated using Average True Range (ATR) to adjust for current market volatility.
User Configurable Settings: Easily toggle signal visibility, TP/SL display, and short entry signals.
Alert Conditions: Built-in alerts for buy and sell signals enable integration with TradingView’s alert system.
How FT-Algos works:
FT-Algos uniquely blends several filtering methods including Kalman and Gaussian smoothing, momentum evaluation, and multi-timeframe trend validation to minimize noise and improve entry precision. Each mode serves different trading styles—from rapid scalping to higher timeframe swing trading—allowing traders to adapt to their preferred strategy seamlessly.
Disclaimer:
This script is provided as-is for educational and informational purposes only. It does not constitute financial advice. Please test thoroughly and trade responsibly.
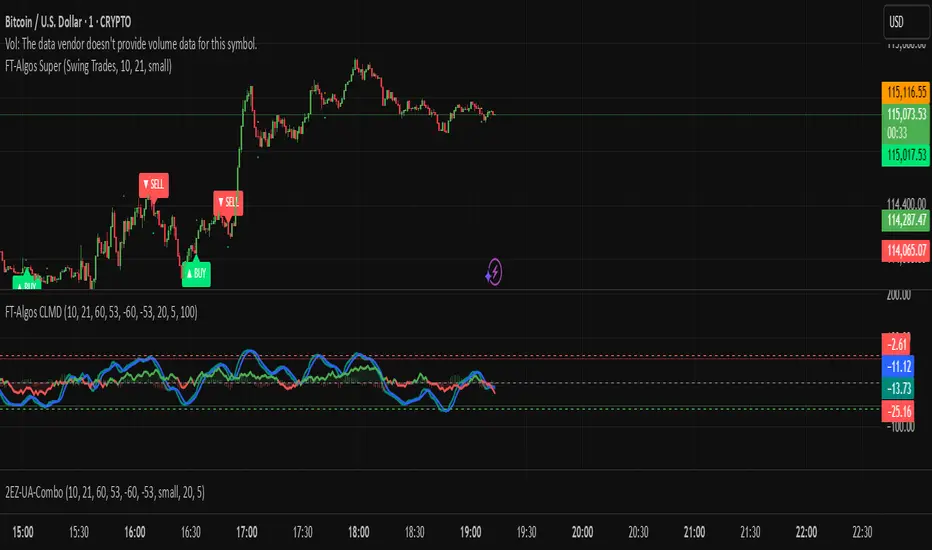
FT-Algos CLMDFT‑Algos CLMD — Hybrid Momentum & Money Flow Detector
FT‑Algos CLMD is a precision‑built trading tool that blends advanced momentum tracking with dynamic money flow analysis. It provides traders with a clear, dual‑layered view of market strength and potential turning points.
Key Features
Momentum oscillator with overbought/oversold zone markers.
Integrated money flow overlay, scaled for direct visual comparison.
Optional histogram view of momentum differentials.
Adjustable smoothing and scaling controls for full customization.
Automatic positive/negative zone shading for quick sentiment reading.
How It Works
This tool analyzes both momentum shifts and capital flow pressure to highlight moments of potential market imbalance. When both layers align, the probability of a strong move can increase — making it a powerful addition to any trading system.
Notes
Designed for chart analysis; does not execute trades automatically.
Past performance is not indicative of future results.
Always combine with disciplined risk management and other forms of analysis.

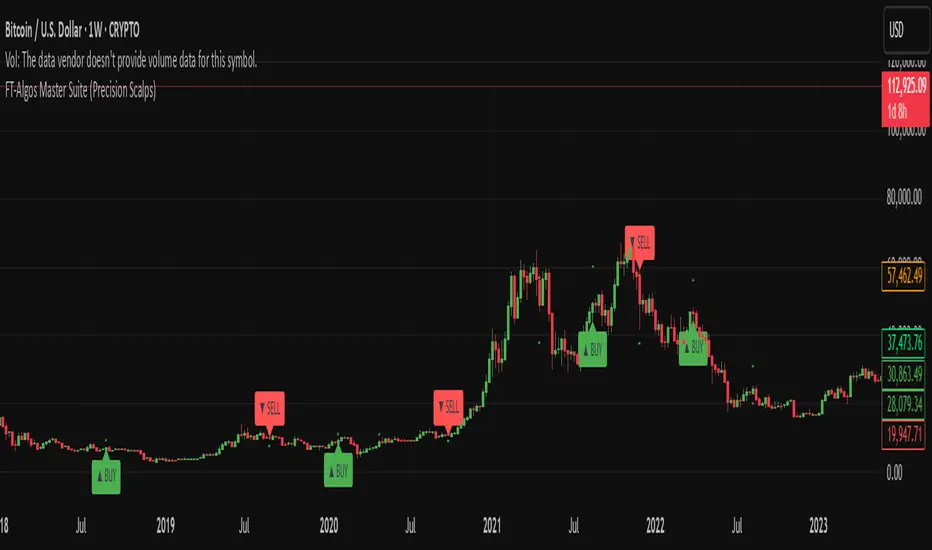
FT-Algos Master SuiteFT-Algos: Unified Alpha Suite
FT-Algos is an all-in-one Pine Script indicator designed to support traders across scalping and swing trading styles with unique multi-strategy logic and clear signals.
Key Features:
Three Trading Modes:
Quick Scalps — Fast momentum-based entries optimized for ultra-short timeframes.
Precision Scalps — Combines MACD flips, Kalman smoothing, Gaussian filters, ZLEMA, and Heikin Ashi SuperTrend to generate high-confidence scalping signals.
Swing Trades — Uses trend stacking with Kalman, ZLEMA, and MACD crossovers confirmed by higher timeframe SuperTrend direction.
Non-Repainting Signals: All entries rely on confirmed candle closes to avoid repainting and false signals.
Visual Entry Markers: Compact BUY and SELL triangle labels placed directly above/below candles for clear signal visualization.
Dynamic Take Profit and Stop Loss Levels: Calculated using Average True Range (ATR) to adjust for current market volatility.
User Configurable Settings: Easily toggle signal visibility, TP/SL display, and short entry signals.
Alert Conditions: Built-in alerts for buy and sell signals enable integration with TradingView’s alert system.
How FT-Algos works:
FT-Algos uniquely blends several filtering methods including Kalman and Gaussian smoothing, momentum evaluation, and multi-timeframe trend validation to minimize noise and improve entry precision. Each mode serves different trading styles—from rapid scalping to higher timeframe swing trading—allowing traders to adapt to their preferred strategy seamlessly.
Disclaimer:
This script is provided as-is for educational and informational purposes only. It does not constitute financial advice. Please test thoroughly and trade responsibly.
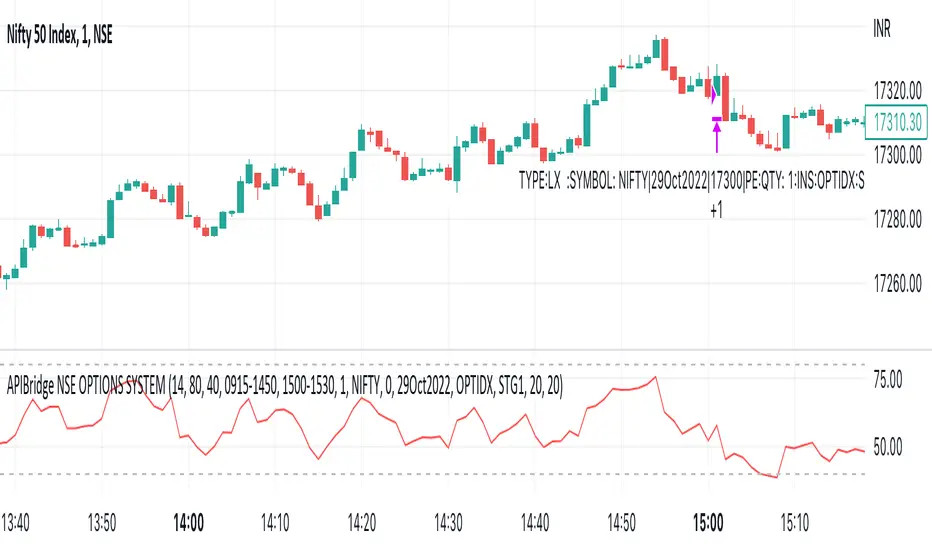
APIBridge Nifty Options Algo StrategyUsing Pinescript, we will use charts of Cash/Future to trade in Options. Note this strategy works well with even the free version of TradingView.
The Relative Strength Index ( RSI ). Is a momentum oscillator that measures the speed and change of price movements. The RSI oscillates between zero and 100. Increasing RSI shows increasing bullish momentum. Decreasing RSI shows increasing bearish momentum. We take RSI upper bound as 80 to indicate bullish momentum and RSI lower bound as 20 to indicate bearish momentum.
We use the above premise to create options buy-only strategy which trades in ATM strikes by default. This strategy requires very less margin (Minimum Rs . 15000).
Since this strategy uses underlying data (cash/future) to place trades in Options, please ignore the backtest of this strategy given by TradingView. TradingView does not provide options data but this strategy bypasses it.
Strategy Premise
The Relative Strength Index (RSI) is a momentum oscillator that measures the speed and change of price movements. The RSI oscillates between zero and 100. Increasing RSI shows increasing bullish momentum. Decreasing RSI shows increasing bearish momentum. We take RSI upper bound as 80 to indicate bullish momentum and RSI lower bound as 20 to indicate bearish momentum.
We use the above premise to create options buy-only strategy which trades in ATM strikes by default. This strategy requires very less margin (Rs. 15000 should be sufficient).
NSE Options Algo Strategy Logic
Long Entry: When RSI goes above 80, send LE in an auto-calculated option strike Call. When RSI goes below 20, send LE in auto-calculated option strike Put.
Long Exit: When we hit Stop loss or Target. In case SL/TGT does not hit and reverse RSI goes above 80 send Long Exit in auto-calculated option. Put as per last trade; RSI goes below 20, send LX in auto-calculated option call as per last trade.
For Long and Short entry the order is fired in the option buying side with auto strike price selection.
Option Strategy Parameters for TraingView Charts
RSI Length(Mandatory): Number of bars used to calculated RSI.
Upper Band(Mandatory): To specify upper band of RSI.
Lower Band(Mandatory): For specifying lower band of RSI.
Use reversal from Upper Band (Optional): This will enable short entry when RSI is falling below 80 from upper band. Recommended to keep unchecked initially.
Use reversal from Lower Band (Optional): This will enable long entry when RSI is raising above 20 from lower band. Recommended to keep unchecked initially.
Quantity: We use this specify the trade quantity (for Nifty min 75)
Custom Stop Loss in Points: Movement in chart price against the momentum which will trigger exit in options positions
Custom Target in Points: Movement in chart price against the momentum which will trigger exit in options positions
Base symbol: This is the base instrument symbol like NIFTY or BANK NIFTY.
Strike distance from ATM: Our default strike selection is considered as first ATM option (with nearest distance, only 100s are considered ). This strike distance allows to calculate ATM options which are at fixed distance.
Expiry: Expiry of option. Weekly and monthly both expiry are allowed.
Instrument: For index instrument will be OPTIDX, for stock instrument will be OPTSTK
Strategy Tag: The Strategy of Nifty options configured in Api bridge.
Setting Up Alert
Before setting up the alert make sure that you have selected desired script, time frame, strategy settings, and APIbridge configuration. Click in settings add alert and paste {{strategy.order.comment}} in message box.
Important: Do not change any settings during live trading. It may break the sequence of exit for the correct call/put.
Market Rhythm Trading Algo with Super SignalsThe Market Rhythm trading algo is designed using many different confluence data points that gives you a virtually unlimited combination of settings to manage risk on any given underlying asset. Designed with flexibility in mind, Market Rhythm can be used on futures, stocks, options, and even crypto.
The current settings are what give you the most buy and sell signals. Be sure to change the 'Rate of Change' source to something like hl2 instead of close where it's set to get even more signals.
How to Use:
Regular vs Super - Market Rhythm includes a set of regular signals, which are given on many price bars. Super signals are a combination of regular signals based on a length of bars you set. This is an effective way to clean up the chart and give more reliable buy and sell signals.
The idea behind so many points of confluence is to give you many different ways to filter out the signals you don't want to trade, or just don't like trading. With built in filters using rate of change, rsi, and chop index, you can customize the feel of your signals based on your risk. You can even use the Settings1 and Settings2 and ADX to separate your risk management into 2 different market conditions. For lower ADX settings you can manage risk much tighter for choppier, less trending markets. For higher ADX settings you will be able to set your risk management based on stronger trends.
The Adaptive Average included also changes based on Settings1/2 to give you a better idea of changing market conditions.
The Moving Average Ribbon can be used to temper your decisions for entering or exiting a trade. For instance, if you receive a red (sell signal) during a strong up trend, and the Adaptive Average is green, and the MA Ribbon is all green, then you have a pretty good idea of whether or not its safe to stay in the trade or go ahead and take profit.
Depending on your favorite time frame, Market Rhythm can be used for intraday scalping, as well as, daily swing trading. Not sure if your favorite discord pump stock is ready to go up? Check it against Market Rhythm and you'll have a much better idea of whether it's still going up or if you've missed the move. Trade safer and happier with Market Rhythm.
The small green triangles are 'regular buy signals' and the larger green triangles are 'super buy signals'.
The small red triangles are 'regular sell signals' and the larger red triangles are 'super sell signals'.
Use this indicator against your levels or main strategy for maximum effectiveness.
Limitations:
This script does not mark reversals. It will only identify safe trade zones during periods of strong momentum.
Disclaimer:
The information contained in my scripts/indicators/ideas does not constitute financial advice or a solicitation to buy or sell any securities of any type. I will not accept liability for any loss or damage, including without limitation any loss of profit, which may arise directly or indirectly from the use of or reliance on such information.
All investments involve risk, and the past performance of a security, industry, sector, market, financial product, trading strategy, or individual’s trading does not guarantee future results or returns. Investors are fully responsible for any investment decisions they make. Such decisions should be based solely on an evaluation of their financial circumstances, investment objectives, risk tolerance, and liquidity needs.
My scripts/indicators/strategies/ideas are only for educational purposes!

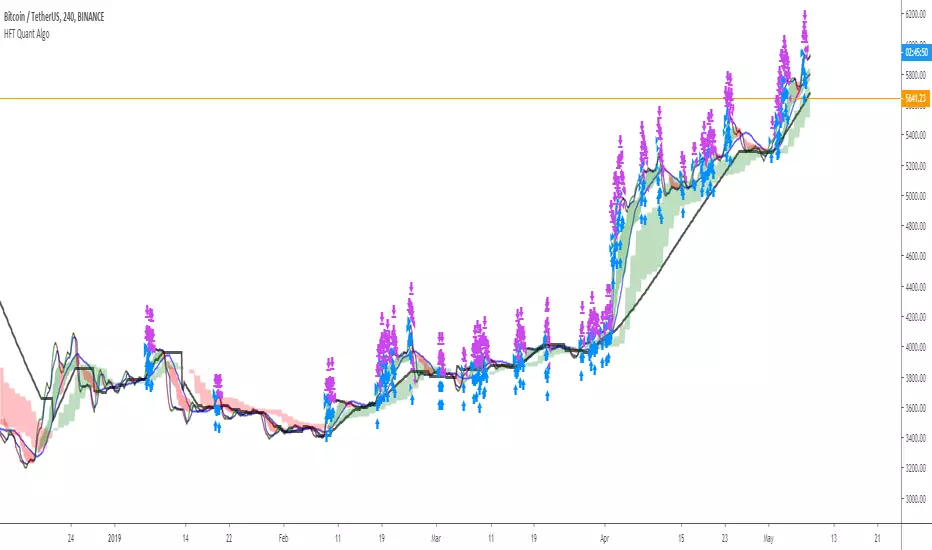
HFT Quant AlgoPrivate Fund Algo - HFT/Quant Approach Beta I
2019 Performance
1/Jan/2019 ~ 8/May/2019
Included:
Commission 0.1%
Slippage 100 ticks
CB Signals - Holla-724 SPOT BTC/USD LONG ONLY (Paid Algo)This is the updated script with results for the last 3 months of the trading room July 19 - Oct 19th. This algo returned (1.86%) vs. Buy and Hold returns of (-12%)
See details on performance in this period below by clicking the "Performance Summary" Tab
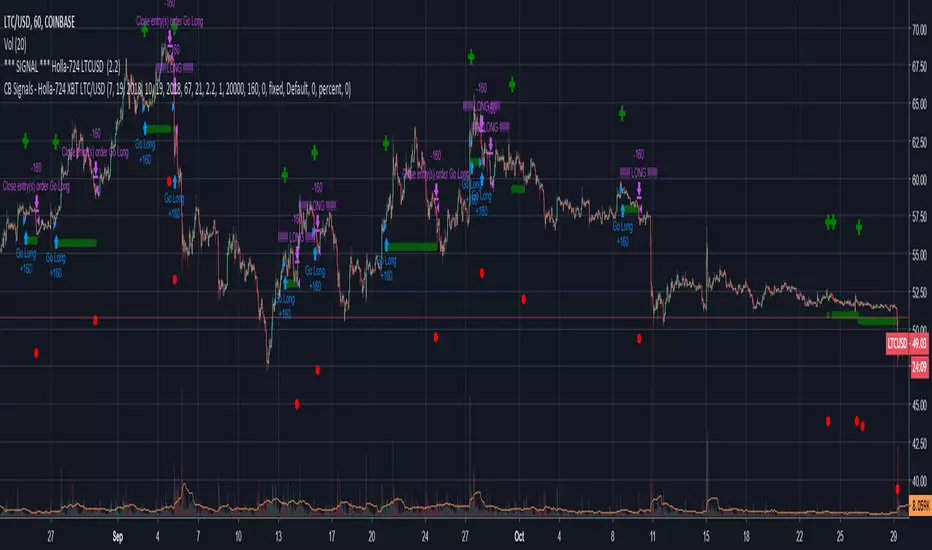
CB Signals - Holla-724 SPOT LTC/USD LONG ONLY (Paid Algo)This is the updated script with results for the last 3 months of the trading room July 19 - Oct 19th. This algo returned (-7.25%) vs. Buy and Hold returns of (-40.95%)
See details on performance in this period below by clicking the "Performance Summary" Tab
GRID SPOT TRADING ALGORITHM - GRID BOT TRADING STRATEGYGRID SPOT TRADING ALGORITHM : LONG ONLY STRATEGY OPEN SOURCE
This is a long only strategy for spot assets.
HOW IT WORKS
Grid trading is a trading strategy where an investor creates a so-called "price grid". The basic idea of the strategy is to repeatedly buy at the pre-specified price and then wait for the price to rise above that level and then sell the position (and vice versa with shorting or hedging).
FEATURES
Grids: This algorithm has a total of 10 grids.
Take profit: The trader can increase or decrease the distance between the grids from the User Interface panel, the distance between one grid and another represents the take profit.
Management: The algorithm buys 10% of the capital every time the price breaks down a grid and sells during a rise to the next higher grid. The initial capital is invested in 10 sizes which represent 10% of the capital per trade.
Stop Loss: The algorithm knows no stop loss as long as it is not activated from the User Interface panel. By activating the stop loss from the User Interface panel the algorithm will insert a close condition on all trades which will be calculated from the last lower grid.
Trades: Trades are opened only if the price is within the grid. If the market leaves the grid the algorithm will not buy new positions or sell new positions.
Optimal market conditions: The favorable market for this algorithm is the sideways market.
LIMITATIONS OF THE MODEL
The trader must take into account that this is a static model. It only works perfectly well if the market is in a sideways phase and incurs heavy losses if the market takes a downward trend. The model is unusable for an uptrend. The trader must therefore carefully analyze the market where he intends to use this strategy, making sure that the price is in a sideways phase.
USES
Indispensable research and backtesting tool for those using bots for their investments. The algorithm produces a backtesting of the strategy for past history. It is used by professional traders to understand if this strategy has been profitable on a market and what parameters to use for bots using this strategy (Kucoin, Binance etc.).
If you would like to develop your own algorithm with customized conditions based on a grid strategy, please contact us.
If you need help in using this tool, please contact us without hesitation.

QaSH DCA AlgorithmQaSH DCA Algorithm implements a DCA strategy that takes advantage of price volatility by buying dips to average down, and adjusting price targets as the break-even price gets lower.
How does the DCA strategy work?
When the specified entry condition has occurred, the indicator will set up several limit orders below the current price. If price goes up a specified amount, then the layers will be overwritten at the higher prices. If price goes down and fills the first layer (limit order), then the Take Profit price is plotted and will be sent in an alert. If more layers are filled, then the TP price will move down accordingly as it’s based on the average entry price (alerts on each TP update). This action of lowering the average entry and TP price mitigates your risk, and increases the likelihood of a Take Profit event happening. More entry conditions will be added as time goes on, although complex entry conditions are not necessary for the strategy to work. All the meat of the DCA strategy is in the layer placement, order volume , and TP %.
How does this differ from other DCA bots?
1) The layer placements, order volume , and “take profit %” for each layer or “safety order” is much more customizable than what you get from other services. For example, I can choose to have my TP% change, depending on how big the price dip was. Maybe on safety order 1 I want 10% TP, but on safety order 7 might want a 2% TP.
2) Settings optimization. You can take advantage of the replay feature and see how trades would have played out, and how much PnL you would have made (strategy version is coming soon)
3) You can use this indicator on more than just crypto. You can easily set up alerts for manual trades on stocks, or you can integrate it with your stock broker API of choice and automate your trades.
4) When combining this with an automation service, you will get unmatched execution speed by running it on your dedicated machine.
5) I can offer a lifetime subscription to the indicator upon request.
What kind of market is it best used on?
QaSH DCA Algorithm is best used on cryptocurrencies and stocks, and it is best used on assets that are volatile. That means large swings up and down. Also I recommend running this on many uncorrelated assets at the same time.
What settings should I use?
The default settings are decent for most markets, and provide a good balance between profit potential and downside protection, although you can use a wide variety of settings. In a strong bull market its best to either bring up your layers to catch smaller dips, or you can go big on the first few layers (maybe 4 layers, 25% on each layer for example). In a sideways or brearish market you'll want more downside protection, so you'll want the larger orders to be at lower prices.
What should I do if price goes below my last layer?
The best solution is to keep a cash reserve on the side at all times. If price looks like it has reached a low point below your lowest layer, then manually buy more to average down further. This action will help it along and get you in the green sooner.
Disclaimer: In order to get a large position in an asset, you need to have most of your layers fill. That means you have to be comfortable with buying more as the price goes down, patiently waiting for the bounce that occurs afterward. This is the working principle of Dollar Cost Averaging, and it's a proven method for most markets.

Dual Thrust Trading Algorithm (ps4)This is an PS4 update to the popular Dual Thrust trading algorithm posted by me some time ago (). It has been commonly used in futures, Forex and equity markets. The idea of Dual Thrust is similar to a typical breakout system, however dual thrust uses the historical price to construct update the look back period - theoretically making it more stable in any given period.
See: www.quantconnect.com

Forex Master v4.0 (EUR/USD Mean-Reversion Algorithm)DESCRIPTION
Forex Master v4.0 is a mean-reversion algorithm currently optimized for trading the EUR/USD pair on the 5M chart interval. All indicator inputs use the period's closing price and all trades are executed at the open of the period following the period where the trade signal was generated.
There are 3 main components that make up Forex Master v4.0:
I. Trend Filter
The algorithm uses a version of the ADX indicator as a trend filter to trade only in certain time periods where price is more likely to be range-bound (i.e., mean-reverting). This indicator is composed of a Fast ADX and a Slow ADX, both using the same look-back period of 50. However, the Fast ADX is smoothed with a 6-period EMA and the Slow ADX is smoothed with a 12-period EMA. When the Fast ADX is above the Slow ADX, the algorithm does not trade because this indicates that price is likelier to trend, which is bad for a mean-reversion system. Conversely, when the Fast ADX is below the Slow ADX, price is likelier to be ranging so this is the only time when the algorithm is allowed to trade.
II. Bollinger Bands
When allowed to trade by the Trend Filter, the algorithm uses the Bollinger Bands indicator to enter long and short positions. The Bolliger Bands indicator has a look-back period of 20 and a standard deviation of 1.5 for both upper and lower bands. When price crosses over the lower band, a Long Signal is generated and a long position is entered. When price crosses under the upper band, a Short Signal is generated and a short position is entered.
III. Money Management
Rule 1 - Each trade will use a limit order for a fixed quantity of 50,000 contracts (0.50 lot). The only exception is Rule
Rule 2 - Order pyramiding is enabled and up to 10 consecutive orders of the same signal can be executed (for example: 14 consecutive Long Signals are generated over 8 hours and the algorithm sends in 10 different buy orders at various prices for a total of 350,000 contracts).
Rule 3 - Every order will include a bracket with both TP and SL set at 50 pips (note: the algorithm only closes the current open position and does not enter the opposite trade once a TP or SL has been hit).
Rule 4 - When a new opposite trade signal is generated, the algorithm sends in a larger order to close the current open position as well as open a new one (for example: 14 consecutive Long Signals are generated over 8 hours and the algorithm sends in 10 different buy orders at various prices for a total of 350,000 contracts. A Short Signal is generated shortly after the 14th Long Signal. The algorithm then sends in a sell order for 400,000 contracts to close the 350,000 contracts long position and open a new short position of 50,000 contracts).

Algo BOT 3.0Algo BOT 3.0 is a sophisticated, rule-based intraday trading strategy designed for index option traders who seek high-probability entries based on market structure, institutional zones, and controlled risk management. This strategy intelligently identifies BUY and SELL trade opportunities using price action, Fibonacci retracements, and pivot confluences, layered with dynamic trade management through trailing stop loss (TSL) and predefined profit/loss thresholds.
🔍 Strategic Foundation
Algo BOT 3.0 combines multiple proven intraday trading concepts into a single unified system:
Candle Behavior Analysis:
Detects strong green (bullish) and red (bearish) candles based on configurable range filters, wick/body ratios, and volume-backed movement.
Ensures only impactful candles are considered for signal generation, filtering out noise.
Dynamic Candle Range Filtering:
Filters out low-momentum candles by comparing their range against a dynamically calculated threshold (based on recent 30-minute close).
Prevents premature or weak entries by focusing on high-volatility structures.
Fibonacci Entry Zones:
Automatically calculates 0.382 and 0.618 Fibonacci levels between the most recent key candles (highest green & lowest red).
These fib levels are used to define entry zones for BUY (above red fib 0.382) and SELL (below green fib 0.382).
Optional fib zones can be visually shown on the chart with real-time drawing.
📈 Signal Generation Logic
The core BUY/SELL signals are triggered based on a combination of:
Green/Red Candle Identification:
A green candle qualifies if:
Open is near the bottom 38.2% of its range.
Close is above the top 61.8% of the range.
High is above a pivot or institutional level.
A red candle qualifies if:
Open is near the top 38.2% of its range.
Close is below the bottom 61.8% of the range.
Low is below a pivot or institutional level.
Support/Resistance Touch Confirmation:
Signals are only considered valid if the qualifying candle touches:
CPR Top/Bottom
Daily Pivot Points (PP, R1–R4, S1–S4)
VWAP or MVWAP
CE Entry (BOT BUY):
Occurs when the price crosses above red fib 0.382 after red candle touch at support.
PE Entry (BOT SELL):
Occurs when the price crosses below green fib 0.382 after green candle touch at resistance.
Signal Controls:
Only one active signal per type (BUY/SELL) at a time.
Real-time tracking of active trade with condition-based resets.
🎯 Exit Management
Built-in risk and profit control with dynamic logic:
Trailing Stop Loss (TSL):
TSL is dynamically adjusted based on peak price after entry.
Trail distance is customizable via input (% below peak).
Visual alerts notify when TSL is hit.
Profit Target:
Trade exits automatically when desired % profit is achieved from entry.
Loss Limit:
Trade exits immediately if unrealized loss exceeds a set % threshold.
Helps prevent large drawdowns during volatile market moves.
🧠 Technical Indicator Integration
To enhance trade accuracy, the strategy includes several optional filters:
RSI: Momentum confirmation or divergence filtering.
SMA/EMA: Trend direction confirmation.
MVWAP: Modified VWAP for smoother institutional bias tracking.
🖼️ Visuals & Alerts
BOT BUY and BOT SELL Signal Labels appear directly on the chart with trade type and candle reference.
TSL, Target, and SL Exits shown as label markers with optional background highlight.
Live Alerts:
BOT BUY (CE Entry)
BOT SELL (PE Entry)
Trailing Stop Loss Triggered
Profit Target Hit
Stop Loss Triggered
⚙️ Customizable Settings
Users can fine-tune the strategy using the following input options:
MVWAP Length
RSI / SMA / EMA Lengths
Candle Range Sensitivity
TSL Distance (%)
Profit Target (%)
Loss Limit (%)
Enable/Disable Background Highlights & Labels
Display Fib Zones
⏱️ Best Use Case & Timeframes

Position and Risk Calculator (for Indices) [dR-Algo]Position and Risk Calculator : Your Ultimate Risk Management Tool for Indices
The difference between a novice and a seasoned trader often comes down to one essential element: risk management. While trading indices, the challenges are even more intense due to market volatility and leverage. The Position and Risk Calculator steps in here to bridge the gap, providing you with an efficient tool designed exclusively for indices trading.
Key Features:
User-Friendly Interface: Designed to integrate effortlessly with your TradingView chart, this tool's interface is intuitive and clutter-free.
Dynamic Price Level Adjustment: Move your Entry, Stop Loss, and Take Profit levels directly on the chart for an interactive experience.
Account Balance Input: Customize the tool to understand your unique financial situation by inputting your current account balance.
Trade Risk Customization: Define how much you're willing to risk per trade, and the tool will do the rest.
Automated Calculations: The indicator calculates the maximum monetary risk and translates it into the maximum lot size you can afford. It delivers a full-integer lot size to make your trading decisions easier.
Comprehensive Risk Evaluation: Beyond lot sizes, it provides you with the Cost-to-Reward Ratio (CRV) of your trade, the actual monetary risk according to the calculated lot size, and the potential profit.
How To Use:
Once you add the Position and Risk Calculator to your TradingView chart, a new interactive panel appears. Here’s how it works:
Set Price Levels: Using draggable lines on the chart, set your Entry Price, Stop Loss, and Take Profit levels.
Account Details: Go to settings and enter your Account Balance and your desired risk percentage per trade.
Automatic Calculations: As soon as the above details are set, the indicator goes to work. It first calculates your maximum risk in monetary terms and then translates that into the maximum lot size you can take for the trade.
Review and Trade: The indicator shows you all the vital statistics - CRV of the trade, the money at risk according to the calculated lot size, and the possible profit.
Why Choose This Tool?
Informed Decisions: Your trading decisions will be based on concrete numbers, removing guesswork.
Time-saving: No need for manual calculations or using separate tools; everything is in one place.
Focus on Trading: By automating the risk management aspect, this tool allows you to focus more on your trading strategy and market analysis.
Tailor-Made for Indices: Unlike many other tools that try to serve all markets, the Position and Risk Calculator is designed specifically for indices trading.
Remember, effective risk management is what separates successful traders from those who burn out. The Position and Risk Calculator not only helps you define your risk but also helps you understand it, empowering you to trade with confidence.
So why not give yourself the best chance of success? Add the Position and Risk Calculator to your TradingView setup and experience the difference it can make.

RSI Algo (Pinescript v5 + Alerts)Found this the other day and thought it might be useful to have an updated version with alerts:
Credit to the original author.
Cluster Algo (Skoda Version)This Indicator operates similarly to the Cluster Algo marketed elsewhere. The key difference is the integration of Bollinger Bands, giving us clear indications.
Buy - When the signal line goes above the Bollinger basis line and is GREEN
Sell - When the signal line goes below the Bollinger basis line and is RED
Consider closing the trade when the signal line changes colour.
When the signal line goes outside the Bollinger band, this a strong indication price will rally.
If you require any further information or script modifications, please message me.
PLEASE CHECK OUT MY OTHER SCRIPTS

Relativity BEARS FOREX 50X 4H AlgorithmHello, this script is the correction of my old script related to Forex. (Bear market)
Old script :
4H was chosen as the time frame.
Thus, larger pips are at our disposal and we benefit more from the hedge effect of the leverage.
Commissions per trade have been removed to get more realistic commissions.
Because every wrong trade deletes all the 1% position size.
(with leverage effect)
Use the links below to obtain access to this indicator :

Relativity BULLS FOREX 50X 4H Algorithm
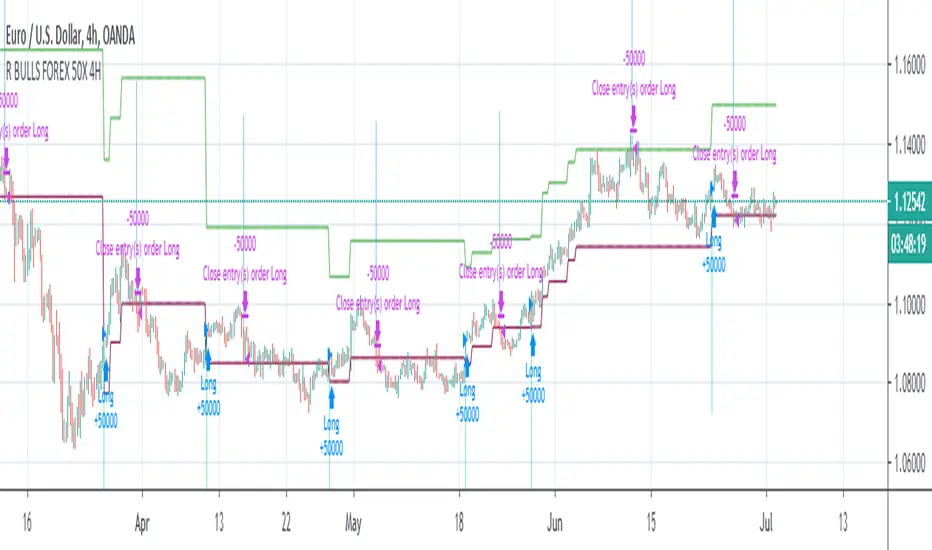
Hello, this script is the correction of my bull script related to Forex. (Bull market)
Old script :
4H was chosen as the time frame.
Thus, larger pips are at our disposal and we benefit more from the hedge effect of the leverage.
Commissions per trade have been removed to get more realistic commissions.
Because every wrong trade deletes all the 1% position size.
(with leverage effect)
Use the link below to obtain access to this indicator :