Smart Momentum Relative StrengthSmart Momentum Relative Strength
Creator Journey
The Smart Momentum Relative Strength indicator is
created by Vishal R. Janjire , inspired by BharatTrader sir, and parameters guided by mentor stockedge founder Vivek Bajaj sir.
Reason? ...Why choose Smart Momentum Relative Strength.
1.Simple to Trade: This indicator simplifies trading decisions. You just need to follow the background color displayed on the chart. When the background is green, it signals a bullish trend, and when it turns red, it signals a bearish trend. For an even cleaner experience, you can untick the Relative Strength (RS) toggle in the indicator settings and focus purely on trading based on these background colors, making the process straightforward and efficient.
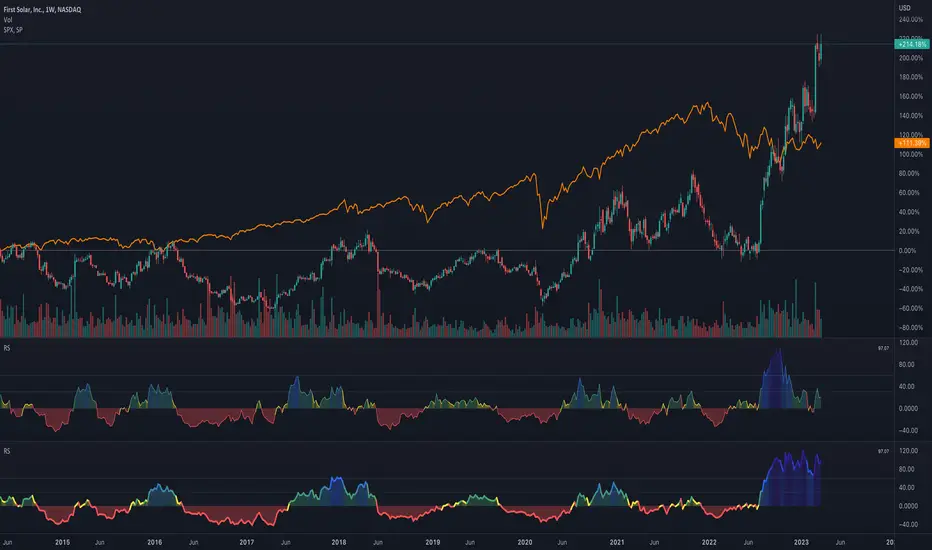
2.Unlock the power to compare any stock, share, commodity, forex or cryptocurrency against major indices like Nasdaq Composite, NYSE Composite, Bitcoin, NG, Gold, Silver, Crude oil, Nasdaq-100, Nifty 50, Hang Seng Index, FTSE 100, and many more! With the Comparative Relative Strength (RS) indicator,
You can easily change the default Nifty 50 comparative symbol to any index or asset of your choice, such as Gold, Silver, Crude Oil, or global benchmarks like the Dow Jones Industrial Average, DAX, Euronext 100, and SSE Composite.
This versatile tool allows traders to measure how well a base symbol (e.g., stock or crypto) performs relative to a chosen benchmark over a specified period. Whether you're analyzing the relative strength of Bitcoin against the Nasdaq-100 or comparing stocks to the S&P 500, this indicator provides valuable insights into market trends and outperforming assets.
The Smart Momentum Relative Strength combines several advanced technical analysis tools into one comprehensive Pine Script indicator designed to provide a nuanced view of market strength and trends. This script integrates Relative Strength (RS), Commodity Channel Index (CCI), and additional trend confirmation mechanisms to deliver actionable insights for traders.
Below are key points to understand before using this indicator:
Important Parameters:
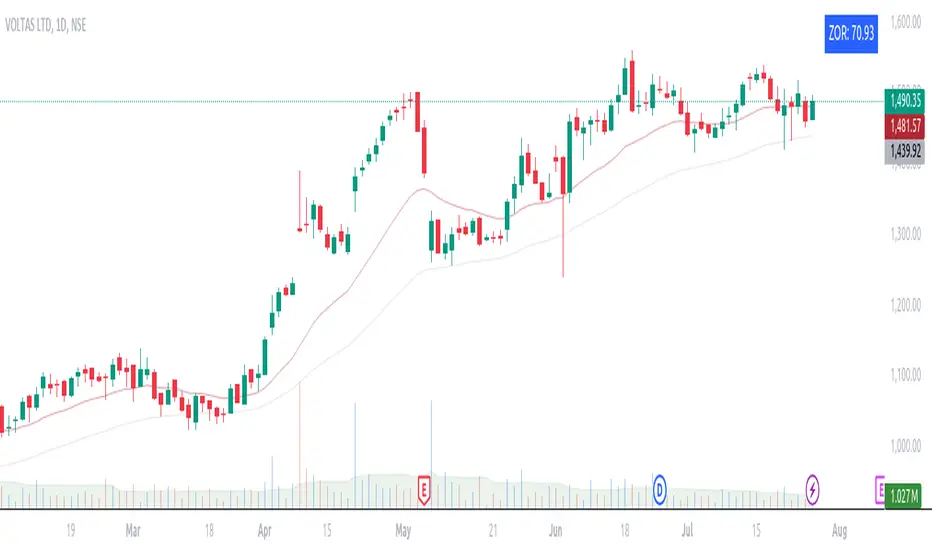
1. Green Line: Represents stocks outperforming the comparative index, which is Nifty 50. However, do not apply this result directly to Nifty 50 itself, as it will not work exclusively on the Nifty 50 index.
2. Red Line: Indicates that the stock is underperforming relative to the Nifty 50 index.
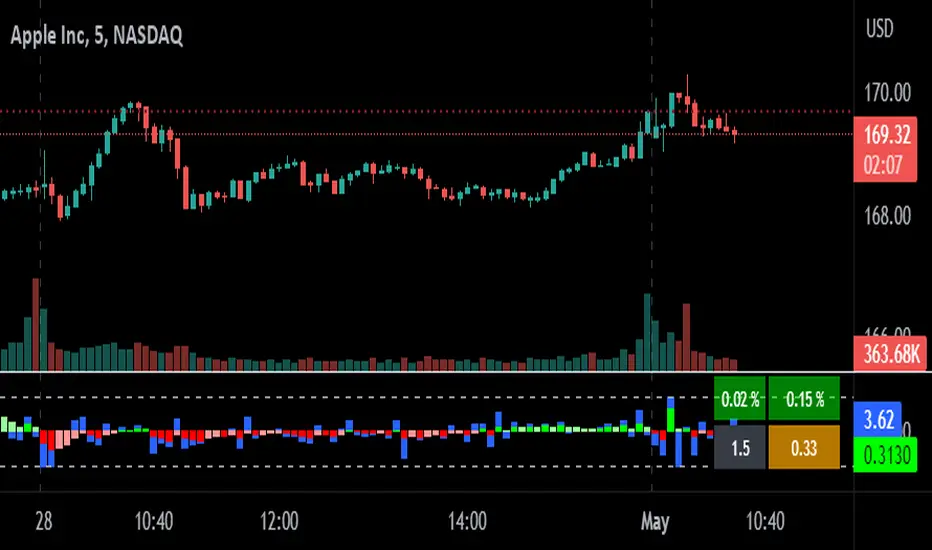
3. Green Background: Signifies that both the current time momentum and higher time momentum are aligned, indicating an upward trend.
4. Red Background: Signifies that both the current time momentum and higher time momentum are aligned, indicating a downward trend.
5. Blank Space: This occurs when the two timeframes are not aligned, indicating market uncertainty and signaling a potential change in market direction, it means short time frame or current time frame changed its direction to opposite side.
Multi-Time Frame (MTF) Settings:
This indicator incorporates a default multi-time frame setup, as follows:
1 and 2 Minute chart = 5 Minute higher time frame
3 Minute chart = 15 Minute higher time frame
5 Minute chart = 15 Minute higher time frame
10 Minute chart = 60 Minute higher time frame
15 Minute chart = 60 Minute higher time frame
20 and 30 Minute chart = 120 Minute higher time frame
1 Hour chart = 4 Hour higher time frame
2 Hour chart = 4 Hour higher time frame
4 Hour chart = 1 Day higher time frame
1 Day chart = 1 Week higher time frame
1 Week chart = 1 Month higher time frame
1 Month chart = 12 Month higher time frame
For any other chart time frame = Day time is default time frame
1. Relative Strength (RS) Analysis:
Calculation: Measures the performance of the base symbol relative to a comparative symbol over a specified period.
Visualization: The RS value is plotted with color-coded lines to indicate bullish (green) or bearish (red) conditions based on crossovers. Users can customize the color based on value or trend direction.
Trend Analysis: A simple moving average (SMA) of RS is displayed to visualize trend strength and direction, with color changes to reflect rising or falling trends.
2. Commodity Channel Index (CCI):
- Current Timeframe CCI: Calculates the CCI for the current timeframe to assess price momentum.
- Higher Timeframe CCI: Computes the CCI for a higher timeframe to provide a broader market perspective.
- Background Color: Highlights the chart background in green or red based on whether both current and higher timeframe CCIs are above or below zero, respectively.
-Blank Space: This occurs when the two timeframes are not aligned, indicating market uncertainty and signaling a potential change in market direction, it means short time frame or current time frame changed its direction to opposite side.
Wskaźnik Pine Script®