[iQ]PRO Quadratic Spectral Regression Channel and Heatmap+✨ PRO Quadratic Spectral Regression Channel and Heatmap+ : Next-Generation Market Analysis
The PRO QSRCH+ indicator is an advanced, proprietary analytical tool designed for the discerning trader, combining sophisticated statistical models with high-frequency momentum detection. This unique fusion provides a multi-dimensional view of market structure, separating the persistent, underlying trend from the volatile, short-term cycle.
📊 Precision Channeling with Weighted Regression
At its core, PRO QSRCH+ utilizes a dynamically weighted regression channel to establish the primary market trajectory and define statistically significant deviation boundaries.
Adaptive Trend Definition: The center line of the channel serves as a highly responsive mean value, calculated over a user-defined lookback length. This weighting prioritizes recent price action, ensuring the trend definition remains relevant to current market conditions.
Volatile Boundaries: The upper and lower bands are precisely calibrated using a standard deviation factor to measure volatility and establish zones of statistical overextension.
Trend Coloring: The channel's appearance changes based on the calculated slope, providing an instantaneous visual confirmation of the macro trend direction (Bullish or Bearish).
Exhaustion Signals: Subtle markers are placed when price touches these boundaries, signaling potential short-term market exhaustion and a high probability of mean reversion.
🔬 High-Resolution Spectral Momentum
Integrated with the regression channel is a specialized Spectral Momentum Heatmap Histogram. This proprietary oscillator is engineered to isolate the cyclical (micro) component of price movement.
Residual Analysis: The indicator first extracts the residual price movement—the high-frequency fluctuations that exist outside the established regression trend—effectively acting as an intelligent high-pass filter.
Cycle Detection: This residual data is then processed through a proprietary spectral filter and smoothing mechanism. This process isolates the dominant market cycle, revealing hidden bursts of momentum and the precise timing of cyclical turns.
Heatmap Visualization: The Spectral Momentum is visualized in a separate pane as a vibrant histogram, dynamically colored and weighted based on its magnitude to provide an intuitive visual gauge of market energy.
🧩 The Multi-Factor State Engine
PRO QSRCH+ uniquely combines these two components into a comprehensive market state engine, visible directly on the price bars and via clear trading signals:
Candle Coloring: Price bars are painted with a four-state system, distinguishing between:
Strong Trend: Macro Trend (Channel Slope) and Micro Cycle (Spectral Momentum) are aligned.
Pullback/Rally: Macro Trend is maintained, but the Micro Cycle is currently counter-trend, signaling temporary consolidation or retracement.
Validated Signals: High-probability BUY/SELL signals are generated only when the fast Spectral Momentum cycle crosses zero in alignment with the macro trend defined by the Regression Slope. This validation filter is key to minimizing false signals and maximizing the probability of sustained directional moves.
PRO QSRCH+ provides a superior framework for market structure analysis, allowing traders to distinguish between low-risk trend continuation and high-risk cyclical exhaustion.
Quadratic

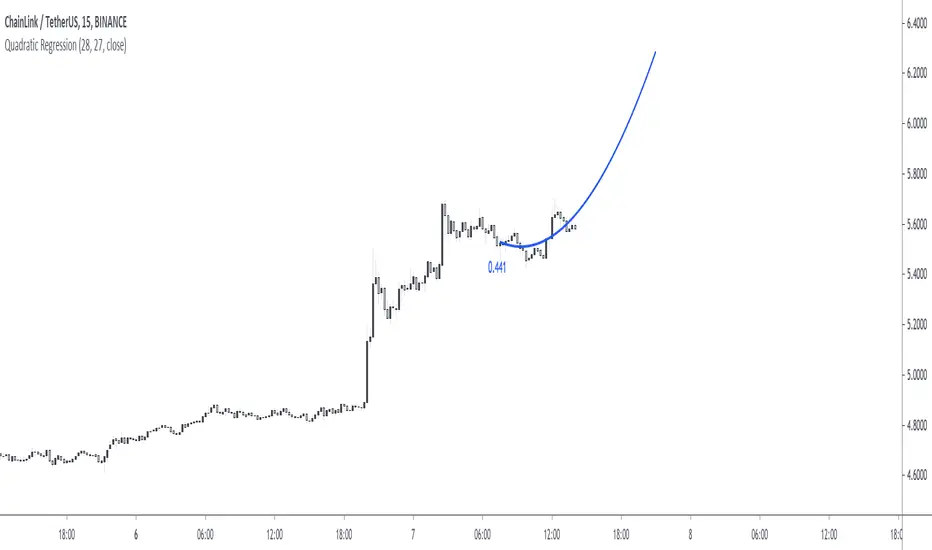
Forecasting Quadratic Regression [UPDATED V6] Forecasting Quadratic Regression applies a second-degree polynomial regression model to price data, offering a non-linear alternative to traditional linear regression. By fitting a quadratic curve of the form:
y=a+bx+cx2
the indicator captures both directional trend and curvature, allowing traders to detect momentum shifts earlier than with straight-line models.
🔹 Core Features
Fits a quadratic regression curve to user-defined lookback periods
Extends the fitted curve forward to generate forecast projections
Calculates slope curvature to highlight trend acceleration or deceleration
Adapts dynamically as new bars are added
🔹 Trading Applications
Identify potential reversal zones when the curve inflects (2nd derivative sign change)
Forecast near-term mean reversion targets or extended trend continuations
Filter trades by measuring momentum curvature rather than linear slope
Visualize higher-order structure in price beyond standard regression lines
⚠️ Note: This model is statistical and assumes past curvature informs short-term future price paths. It should be combined with confirmation signals (volume, oscillators, support/resistance) to reduce false inflection points.

Adaptive Quadratic Kernel EnvelopeThis study draws a fair-value curve from a quadratic-weighted (Nadaraya-Watson) regression. Alpha sets how sharply weights decay inside the look-back window, so you trade lag against smoothness with one slider. Band half-width is ATRslow times a bounded fast/slow ATR ratio, giving an instant response to regime shifts without overshooting on spikes. Work in log space when an instrument grows exponentially, equal percentage moves then map to equal vertical steps. NearBase and FarBase define a progression of adaptive thresholds, useful for sizing exits or calibrating mean-reversion logic. Non-repaint mode keeps one-bar delay for clean back-tests, predictive mode shows the zero-lag curve for live decisions.
Key points
- Quadratic weights cut phase error versus Gaussian or SMA-based envelopes.
- Dual-ATR scaling updates width on the next bar, no residual lag.
- Log option preserves envelope symmetry across multi-decade data.
- Alpha provides direct control of curvature versus noise.
- Built-in alerts trigger on the first adaptive threshold, ready for automation.
Typical uses
Trend bias from the slope of the curve.
Entry timing when price pierces an inner threshold and momentum stalls.
Breakout confirmation when closes hold beyond outer thresholds while volatility expands.
Stops and targets anchored to chosen thresholds, automatically matching current noise.

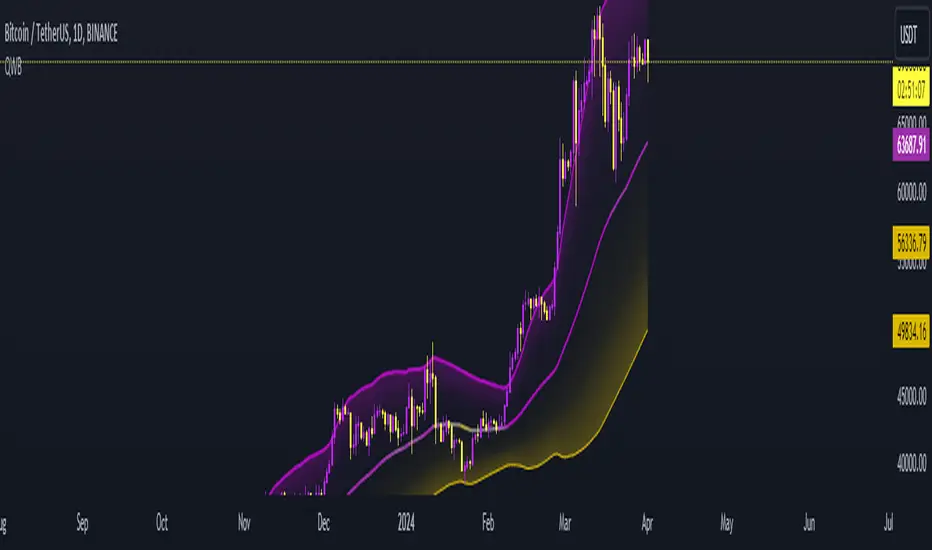
Quadratic Weighted Bands"Quadratic Weighted Bands" (QWB) is designed to identify and visualize market trends and volatility using quadratic weighted filtering techniques. It works by applying quadratic weighting to a selected data source over a specified length, enhancing the sensitivity and responsiveness of the indicator to recent market movements. A major advantage of this indicator is the ability to have a longer lookback period without having too much lag. This results in a smoother output that is still very responsive. Its about twice as fast as a normal average so adjust accordingly.
The indicator is customizable, allowing users to select between the normal Quadratic Weighting (QWF) and Volume Quadratic Weighting (VQWF), choose their data source, adjust the lookback period, and modify the deviation multiplier to fit their analysis needs. Additionally, users can customize the colors of the bands and center line.
The color of the central line changes based on the direction of the trend, as well as having a neutral (ranging) color. This visual aspect makes it easier for traders to quickly see the strength and direction of the market.
Style Select: Choose between "Normal Quadratic Weighting" or "Volume Quadratic Weighting" to adapt the indicator based on volume data or standard price data.
Source: This allows for the selection of the input source for the indicator, such as HL2, ensuring the analysis is aligned with specific trading preferences.
Length: Define the lookback period for the average, with the system automatically utilizing the maximum available length if the specified range exceeds available data, ensuring it always works.
Deviation Length: Optionally adjust the lookback period for calculating deviation, enhancing the indicator's sensitivity and accuracy in identifying market volatility.
Multiplier: Fine tune the deviation multiplier to control the width of the bands, allowing traders to adjust for market volatility and personal risk tolerance.
Top Color: Customize the color of the top band, which also affects the center line's appearance. Adjusting the brightness provides visual clarity and personalization.
Bottom Color: Similarly, select the color for the bottom band, which also influences the center line. The option to adjust brightness ensures the indicator's readability and aesthetic preference.
Neutral Color: Designate a color for indicating a ranging market.
Enjoy
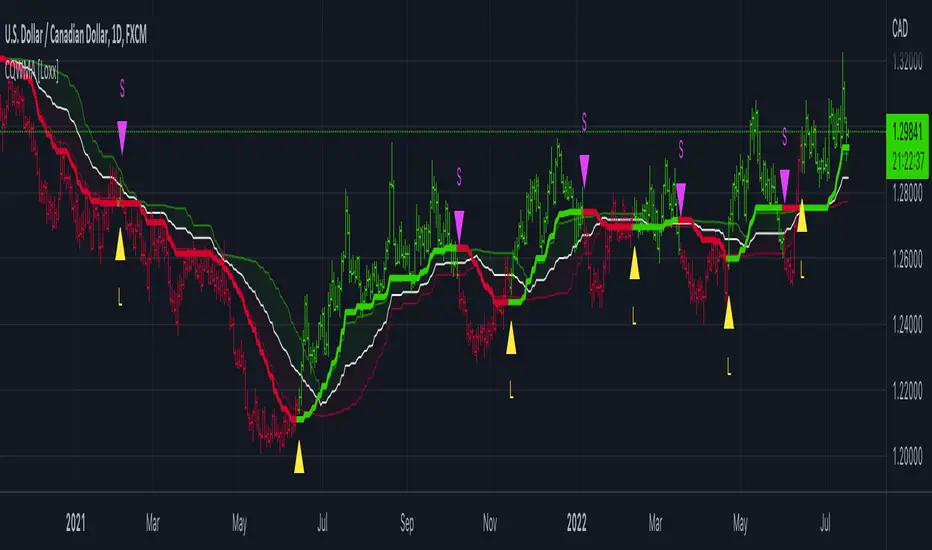
Kernel Regression RibbonKernel Regression Ribbon is a flexible, visually pleasing trend identification tool. Plotting 8 different kernel regressions of different types and parameters allows the user to see where levels of support and resistance are being tested, retested and broken.
What’s Kernel Regression?
A statistical method for estimating the best fitting curve for a dataset, in this case, a time/price chart.
How’s Kernel Regression different from a Moving Average?
A Moving Average is basically a simple form of Kernel Regression, in that it uses a fixed (Retangular) Kernel function. In an MA, all data points are weighted equally over its length. However, a Kernel function reacts more to data points that are closer to the current point. This means it will adapt more quickly to changes in data than an MA. Due to this adaptability, Kernel functions often form part of Machine Learning.
Using this indicator:
Explore the default Regular mode first to get a feel for the inputs, which are more numerous than for MAs. Try out different settings, filters and intervals to get the best out of each kernel. Not all parameters are available for each KR. There are info tips to explain this in the menu, but I’ve also included handy, optional labels on the chart for each KR as a more accessible guide.
Once you know your way round the Regular mode, check out the Presets and start changing the parameters of each kernel to your liking in the “User KR1, KR2, … “ mode. Each kernel type has its strong and weak points. Blending different kernels is where this indicator comes into its own. Give your charts a funky shine!
This indicator does NOT repaint.
This script acknowledges, and hopefully showcases, the great work of @veryfid Kernel Regression Toolkit.

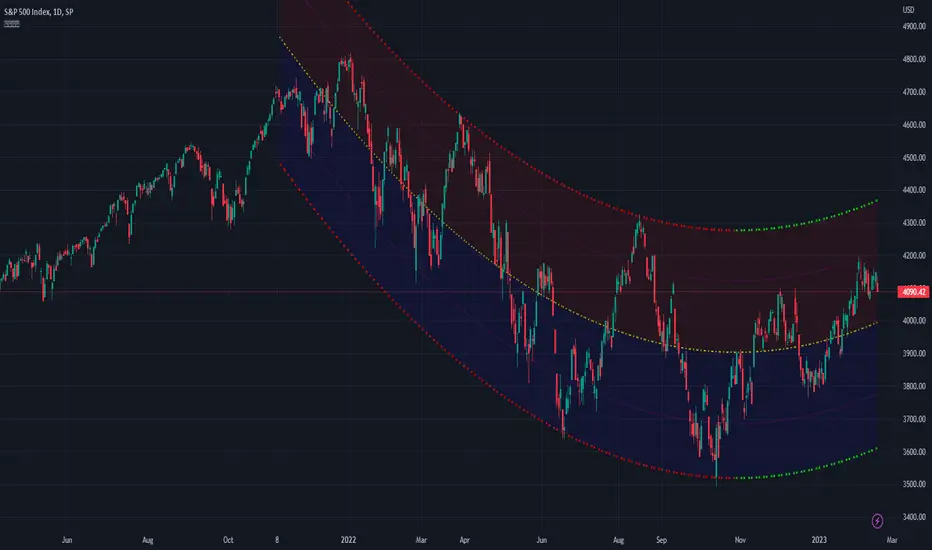
Relational Quadratic Kernel Channel [Vin]The Relational Quadratic Kernel Channel (RQK-Channel-V) is designed to provide more valuable potential price extremes or continuation points in the price trend.
Example:
Usage:
Lookback Window: Adjust the "Lookback Window" parameter to control the number of previous bars considered when calculating the Rational Quadratic Estimate. Longer windows capture longer-term trends, while shorter windows respond more quickly to price changes.
Relative Weight: The "Relative Weight" parameter allows you to control the importance of each data point in the calculation. Higher values emphasize recent data, while lower values give more weight to historical data.
Source: Choose the data source (e.g., close price) that you want to use for the kernel estimate.
ATR Length: Set the length of the Average True Range (ATR) used for channel width calculation. A longer ATR length results in wider channels, while a shorter length leads to narrower channels.
Channel Multipliers: Adjust the "Channel Multiplier" parameters to control the width of the channels. Higher multipliers result in wider channels, while lower multipliers produce narrower channels. The indicator provides three sets of channels, each with its own multiplier for flexibility.
Details:
Rational Quadratic Kernel Function:
The Rational Quadratic Kernel Function is a type of smoothing function used to estimate a continuous curve or line from discrete data points. It is often used in time series analysis to reduce noise and emphasize trends or patterns in the data.
The formula for the Rational Quadratic Kernel Function is generally defined as:
K(x) = (1 + (x^2) / (2 * α * β))^(-α)
Where:
x represents the distance or difference between data points.
α and β are parameters that control the shape of the kernel. These parameters can be adjusted to control the smoothness or flexibility of the kernel function.
In the context of this indicator, the Rational Quadratic Kernel Function is applied to a specified source (e.g., close prices) over a defined lookback window. It calculates a smoothed estimate of the source data, which is then used to determine the central value of the channels. The kernel function allows the indicator to adapt to different market conditions and reduce noise in the data.
The specific parameters (length and relativeWeight) in your indicator allows to fine-tune how the Rational Quadratic Kernel Function is applied, providing flexibility in capturing both short-term and long-term trends in the data.
To know more about unsupervised ML implementations, I highly recommend to follow the users, @jdehorty and @LuxAlgo
Optimizing the parameters:
Lookback Window (length): The lookback window determines how many previous bars are considered when calculating the kernel estimate.
For shorter-term trading strategies, you may want to use a shorter lookback window (e.g., 5-10).
For longer-term trading or investing, consider a longer lookback window (e.g., 20-50).
Relative Weight (relativeWeight): This parameter controls the importance of each data point in the calculation.
A higher relative weight (e.g., 2 or 3) emphasizes recent data, which can be suitable for trend-following strategies.
A lower relative weight (e.g., 1) gives more equal importance to historical and recent data, which may be useful for strategies that aim to capture both short-term and long-term trends.
ATR Length (atrLength): The length of the Average True Range (ATR) affects the width of the channels.
Longer ATR lengths result in wider channels, which may be suitable for capturing broader price movements.
Shorter ATR lengths result in narrower channels, which can be helpful for identifying smaller price swings.
Channel Multipliers (channelMultiplier1, channelMultiplier2, channelMultiplier3): These parameters determine the width of the channels relative to the ATR.
Adjust these multipliers based on your risk tolerance and desired channel width.
Higher multipliers result in wider channels, which may lead to fewer signals but potentially larger price movements.
Lower multipliers create narrower channels, which can result in more frequent signals but potentially smaller price movements.

Corrected QWMA (Quadratic Weighted Moving Average) [Loxx]Corrected QWMA (Quadratic Weighted Moving Average) is the "corrected" version of QWMA. There are other attempts on TradingView to create the QWMA, this is the correct version with weighting applied to the lookback period.
"Correcting" is a process where the value of the average is checked for the significance (how big is it) of change. For that, a standard deviation of a change is used and if the change is "not significant enough", then the change is ignored. Because of this, the average starts to have that "step like" value, but in any case, it should not be mixed with the step average type. The corrected average is different.
The correction period can be used to have different types of calculations:
If the "correction" period is set to < 0, then there is no correction made (in that case the value is exactly the same as original qwma)
If the "correction" period is set to 0, then the "correction" period is the same as qma period
If it is set to any other value, that period is used
Color combinations:
Middle: color (and alerts) on slope change
Levels: (and alerts) on outer levels cross
QWMA: (and alerts) on middle level cross
Included:
Bar coloring
Signals
Alerts
Quadratic Regression Trend ChannelIt's been a while since I have published anything meaningful for all members, but here is my next step in evolution of trend channel technology, my attempt at "Quadratic Regression Trend Channel" custom tailored for regression enthusiasts. I'm actually doing a lot more than my profile shall ever reveal. Many members may have heard of "polynomial regression channel"(PRC), but I wouldn't accurately label this as having the "poly-" capability in it with differing amounts of nth degrees/orders.
This indicator is derived from my "HLC Banded Quadratic Regression" indicator, the 3rd indicator I had ever published in my earliest days of tinkering around with Pine Script. It always had a destiny, and TV has graciously delivered on upgrading Pine with many new capabilities to run this algorithm with ease and in the manner that I wished to write it. Any subscribing TradingViewer has the freedom to use this indicator and as many as they shall desire.
Blessed is the "Immense Power of Pine" in 2021, as I utilized a multitude of new Pine features including extensive use of arrays for the quadratic regression formula, arrays of line.new(), input(group=), and input(inline=). I spent an incredible amount of time creating this, and it was no easy task to condense this amount of sophistication within less than 150 lines of code at the time of this original debut release. I have striven to achieve the indicator's computational efficiency potential to be as fast as possible with highly optimized code to handle the large amount of sampling it utilizes and is capable of. I hope you find it analytically favorable and beyond your expectations.
First of all, it has different sampling methods I haven't seen in any other PRC available, providing tightly snug and fit curvatures dependent on my optional choices not found in comparable indicators. This yields the best quality of fit I can provide by employing quadratic regression in order to provide a superb "visual analysis" of your price action in high noise environments. I also included my novel time warp feature to rewind the indicator regression into a previous state of time. If you're trading on really fast timeframes, I included an option to only calculate once per bar at it's closure. This will aid with computational efficiency of the TV servers, and it's intended to not to slow down your charting experience amongst a wide assortment of other indicators in your overlay chart.
I allowed a couple of variability methods for the confidence bands. A variety of coloring options, line thickness, and other perks are there to accommodate your distinct visual acuity. There is also a nifty option to color the regression by the slope of the curvatures. This is enabled by default, and I anticipate that you may find that color option uniquely useful. The amount of chords in the curvature are automatically calculated depending on the regression period selected to achieve a nice fluid arch for any setting.
Anyhow, I believe that sums up most of it's important characteristics in a brief explanation. It's potential is best personally discovered by simply using it with the myriad of control settings available. I published it with protected code, because I simply wanted to confine this monstrosity to my TradingView laboratory. I would rather not have this thing uncaged, rabidly running around the planet frothing out of the mouth on a Frankenstein AI later, unless it's mine on a short leash. Besides, I'm still trying to figure out the math behind "cubic regression". :)
Sorry in advance about not providing the source code, I hope you'll understand... We ALL know what devastation happens when things are "unleashed" from a BSL-4 lab to run amok. Countless billions have yet to learn a horrific lesson about the mania of evil at a future Geneva convention. If you don't know the mythical story about Pandora's box(a jar actually), look it up!
Features List Includes:
Calculation Throttling
Regression Period
Time Warp
Multiple Sampling Methods
Confidence Bands Variability Controls
Indicator Customization Options
When available time provides itself, I will consider your inquiries, thoughts, and concepts presented below in the comments section, should you have any questions or comments regarding this indicator. When my indicators achieve more prevalent use by TV members , I may implement more ideas when they present themselves as worthy additions. Have a profitable future everyone!
Quadratic RegressionFit a quadratic polynomial (parabola) to the last length data points by minimizing the sum of squares between the data and the fitted results. The script can extrapolate the results in the future and can also display the R-squared of the model. Note that this script is subject to some limitations (more in the "Notes" section).
Settings
Length : Number of data points to use as input.
Offset : Determine the number of past fitted values to be displayed, if 0 only the extrapolated values are displayed, if 55 only the past fitted values are displayed.
Src : Input data of the indicator
Show R2 : Determine if the value of the R-squared must be displayed, by default true.
Usage
When the underlying trend in the price is not linear, we might use more advanced models to estimate it, this is where using a higher-degree regression model might be required, as such a quadratic model (second-degree) is appropriate when the underlying trend is parabolic.
Here we can see that the quadratic regression (in blue) offer a better fit than a linear one.
Another advantage of the quadratic regression is that a linear one will always have the same direction, that's not the case with the quadratic regression and as such, it is possible to forecast reversals.
Above a linear regression (in red) and two quadratic regression (in blue) with both length = 54. Note that for the sake of clarity, the above image uses a quadratic regression to show all the past fitted values and another one to show all the forecasted values.
The R-Squared is also extremely useful when it comes to measuring the accuracy of the model, with values closer to 1 indicating that the model is appropriate, and thus suggesting that the underlying trend in the price is parabolic. The R-squared can also measure the strength of the trend.
Notes
The script uses the function line.new , as such only a maximum of 54 observations are displayed, getting more observations can be done by using an additional quadratic regression like we did in the previous section. Another thing is that line.new use xloc.bar_time , as such it is possible to observe some errors with the displayed results of the indicator, such as:
This will happen when applying the indicator to symbols with session breaks, I apologize for this inconvenience and I'll try to find solutions. Note however that the indicator will work perfectly on cryptos.
Summary
That's an indicator I really wanted to make, even if it is important to note that such models are rarely useful in stock markets, however it is more than possible to create a quadratic regression (with severe limitations) with pinescript.
Today I turn 21, while I should be celebrating I still wanted to share something with the community, it's also some kind of present to myself that tells me that I am a bit better at using pinescript than last year, and I am glad I could progress (instead of regress, regression , got it?). Thx a lot for reading!
Quadratic Least Squares Moving Average - Smoothing + Forecast Introduction
Technical analysis make often uses of classical statistical procedures, one of them being regression analysis, and since fitting polynomial functions that minimize the sum of squares can be achieved with the use of the mean, variance, covariance...etc, technical analyst only needed to replace the mean in all those calculations with a moving average, we then end up with a low lag filter called least squares moving average (lsma) .
The least squares moving average could be classified as a rolling linear regression, altho this sound really bad it is useful to understand the relationship of both methods, both have the same form, that is ax + b , where a and b are coefficients of the model. However in a simple linear regression a and b are constant, while the lsma use variables instead.
In a simple lsma we model the relationship of the closing price (dependent variable) with a linear sequence (independent variable), therefore x = 1,2,3,4..etc. However we can use polynomial of higher degrees to model such relationship, this is required if we want more reactivity. Therefore we can use a quadratic form, that is ax^2 + bx + c , where a,b and c are variables.
This is the quadratic least squares moving average (qlsma), a not so official term, but we'll stick with it because it still represent the aim of the filter quite well. In this indicator i make the calculations of the qlsma less troublesome, therefore one might understand how it would work, note that in general the coefficients of a polynomial regression model are found using matrix calculus.
The Indicator
A qlsma, unlike the classic lsma, will fit better to the price and will be more reactive, this is the advantage of using an higher degrees for its calculation, we can model more complex relationship.
lsma in green, qlsma in red, with both length = 200
However the over/under shoots are greater, i'll explain why in the next sections, but this is one of the drawbacks of using higher degrees.
The indicator allow to forecast future values, the ahead period of the forecast is determined by the forecast setting. The value for this setting should be lower than length, else the forecasts can easily over/under shoot which heavily damage the forecast. In order to get a view on how well the forecast is performing you can check the option "Show past predicted values".
Of course understanding the logic behind the forecast is important, in short regressions models best fit a certain curve to the data, this curve can be a line (linear regression), a parabola (quadratic regression) and so on, the type of curve is determined by the degree of the polynomial used, here 2, which is a parabola. Lets use a linear regression model as example :
ax + b where x is a linear sequence 1,2,3...and a/b are constants. Our goal is to find the values for a and b that minimize the sum of squares of the line with the dependent variable y, here the closing price, so our hypothesis is that :
closing price = ax + b + ε
where ε is white noise, a component that the model couldn't forecast. The forecast of the closing price 14 step ahead would be equal to :
closing price 14 step aheads = a(x+14) + b
Since x is a linear sequence we only need to sum it with the forecasting horizon period, the same is done here with :
a*(n+forecast)^2 + b*(n + forecast) + c
Note that the forecast proposed in the indicator is more for teaching purpose that anything else, this indicator can't possibly forecast future values, even on a meh rate.
Low lag filters have been used to provide noise free crosses with slow moving average, a bad practice in my opinion due to the ability low lag filters have to overshoot/undershoot, more interesting use cases might be to use the qlsma as input for other indicators.
On The Code
Some of you might know that i posted a "quadratic regression" indicator long ago, the original calculations was coming from a forum, but because the calculation was ugly as hell as well as extra inefficient (dogfood level) i had to do something about it, the name was also terribly misleading.
We can see in the code that we make heavy use of the variance and covariance, both estimated with :
VAR(x) = SMA(x^2) - SMA(x)^2
COV(x,y) = SMA(xy) - SMA(x)SMA(y)
Those elements are then combined, we can easily recognize the intercept element c , who don't change much from the classical lsma.
As Digital Filter
The frequency response of the qlsma is similar to the one of the lsma, those filters amplify certain frequencies in the passband, and have ripples in the stop band. There is something interesting about those filters, first using higher degrees allow to greater boost of the frequencies in the passband, which result in greater over/under shoots. Another funny thing is that the peak/valley of the ripples is equal the peak or valley in the ripples of another lsma of different degree.
The transient response of those filters, that is impulse response, step response...etc is related to the degree of the polynomial used, therefore lets denote a lsma of degree p : lsma(p) , the impulse response of lsma(p) is a polynomial of degree p, and the step response is simple a polynomial of order p+1.
This is why it was more interesting to estimate the qlsma using convolution, however we can no longer forecast future values.
Conclusion
I proposed a more usable quadratic least squares moving average, with more options, as well as a cleaner and more efficient code. The process of shrinking the original code is made easier when you know about the estimations of both variance and covariance.
I hope the proposed indicator/calculation is useful.
Thx for reading !

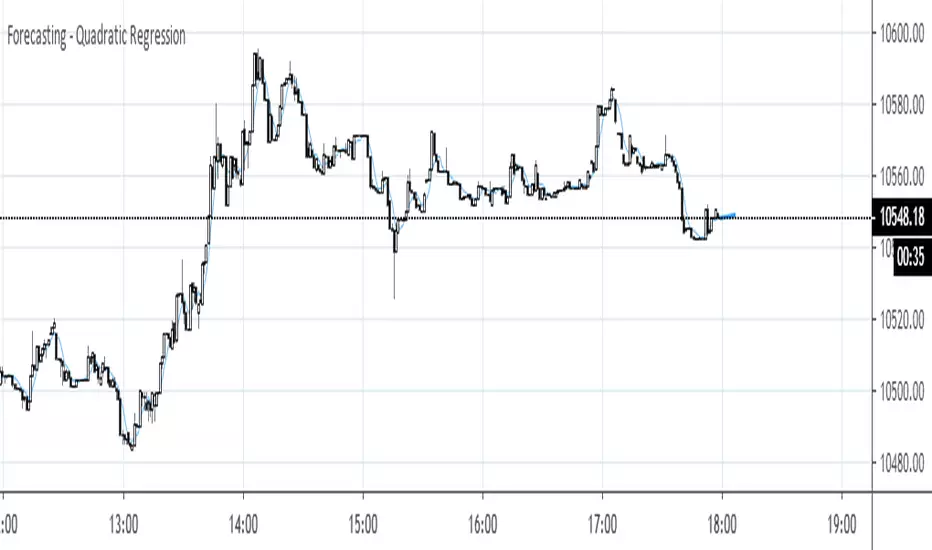
Forecasting - Quadratic RegressionThis script is written totally thanks to Alex Grover (). Here it is implemented in conjunction with the seasonal forecast I showed in one of my previous posts. It takes the calculated QReg curve and extends its last section (Season) into the future (Forecasted periods).
QMA/SMA DifferenceIntroduction
The quadratic moving average (QMA) or quadratic weighted moving average (QWMA) is a type of moving average who is closer to the price when price is up trending. This moving average is defined as the square root of the moving average of the squared price. The QMA-SMA difference use this moving average to provide a new volatility indicator who aim to be reactive and filter noisy volatility in order to only provide essential information.
QMA - SMA
This indicator is defined as the difference between a quadratic moving average and a simple moving average of same period. Since the QMA emphasize up movements and tend to be away from down movements she is always greater than the simple moving average, so a simple difference between those moving average provide our volatility indicator. Below is a comparison with a standard deviation and the indicator of both period 100.
Since its a difference between two moving average it can be interesting to use a simple moving as source for the standard deviation to provide another comparison
The standard deviation is smoother but still contain more information as well as having less reactivity.
Conclusion
I have a presented a new volatility indicator based on the quadratic moving average and compared it with a classic standard deviation. It is possible to change the power order of the QMA in order to provide different results, in order to do so you must also change the root, this is done in pine with : pow(sma(pow(close,w),length),1/w) where w is the power order, notice that an high power order can provide non attributed values.

Linear Quadratic Convergence Divergence OscillatorIntroduction
I inspired myself from the MACD to present a different oscillator aiming to show more reactive/predictive information. The MACD originally show the relationship between two moving averages by subtracting one of fast period and another one of slow period. In my indicator i will use a similar concept, i will subtract a quadratic least squares moving average with a linear least squares moving average of same period, since the quadratic least squares moving average is faster than the linear one and both methods have low-lag this will result in a reactive oscillator.
LQCD In Details
A quadratic least squares moving average try to fit a quadratic function (parabola) to the price by using the method of least squares, the linear least squares moving average try to fit a line. Non-linear fit tend to minimize the sum of squares in non-linear data, this is why a quadratic method is more reactive. The difference of both filters give us an oscillator, then we apply a simple moving average to this oscillator to provide the signal line, subtracting the oscillator and its signal line give us the histogram, those two last steps are the same used in the MACD.
Length control the period of the quadratic/linear moving average. While the MACD use a signal line for plotting the histogram i also added the option to plot the momentum of the quadratic moving average instead, the result is smoother and reduce irregularities, in order to do so just check the differential option in the parameter box.
The period of the signal line and the momentum are both controlled by the signal parameter.
A predictive approach can be made by subtracting the histogram with the signal line, this process make the histogram way more predictive, in order to do so just check the predictive histogram option in the parameter box.
Predictive histogram with simple histogram option. The differential mode can also be used with the predictive parameter, this result in a smoother but less reactive prediction.
Information Interpretation
The amount of information the MACD can give us is high. We can use the histogram as signal generator, or the if the oscillator is over/under 0, combine the oscillator/signal line with histogram, combinations can provide various systems. Some traders use the histogram as signal generator and use the cross between the histogram and the signal line as a stop signal, this method can avoid some whipsaw trades. The study of divergences with the price is also another method.
Conclusion
This oscillator aim to show the same amount of information as the MACD with a similar calculation method but using different kind of filters as well as eliminating the need to use two separates periods for the moving averages calculation, its still possible to use different periods for the quadratic/linear moving average but the results can be less accurate. This indicator can be used like the MACD.

GuppyAdded over 20 ma types to experiment with ,while avoiding the traditional list and keeping compiling time adequate.
Its purely experimental ,published spontaneously for friend use and not as trading indicator.

HLC Banded Quadratic RegressionHigh/Low/Close Banded Quadratic Regression is now available through this implementation, free for all to use. It's simple purpose is to plot multiple independent parabolic curvatures using a matrix equation that best fits the non-linear data sets of high, low, and close. Features include an available dark background disabled by default for the overlay chart, adjustable regression period, and a banding lines width adjustment. If you have any comments regarding this indicator, I will consider your thoughts and ideas presented below.

Quadratic Regression Slope [DW]This is a study geared toward identifying price trends using Quadratic regression.
Quadratic regression is the process of finding the equation of a parabola that best fits the set of data being analyzed.
In this study, first a quadratic regression curve is calculated, then the slope of the curve is calculated and plotted.
Custom bar colors are included. The color scheme is based on whether the slope is positive or negative, and whether it is increasing or decreasing.

Quadratic RegressionA quadratic regression is the process of finding the equation that best fits a set of data.This form of regression is mainly used for smoothing data shaped like a parabola.
Because we can use short/midterm/longterm periods we can say that we use a Quadratic Least Squares Moving Average or a Moving Quadratic Regression.
Like the Linear Regression (LSMA) a Quadratic regression attempt to minimize the sum of squares (sum of the squared difference between a set of data and an estimator), this is why
those kinds of filters have low lag .
Here the difference between a Least Squared Moving Average ( green ) and a Quadratic Regression ( red ) of both period 500
Here it look like the Quadratic Regression have a best fit than the LSMA
