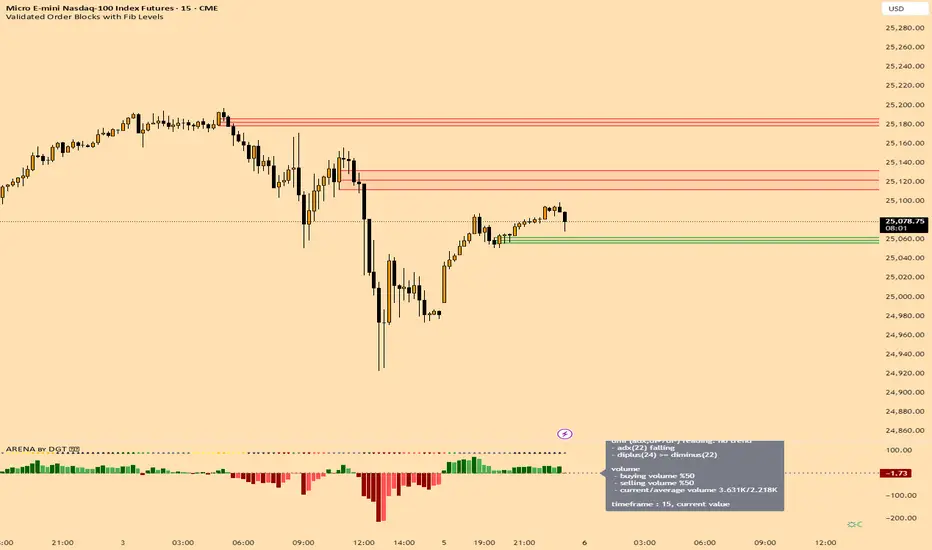
Dynamic Volume Trace Profile [ChartPrime]⯁ OVERVIEW
Dynamic Volume Trace Profile is a reimagined take on volume profile analysis. Instead of plotting a static horizontal histogram on the side of your chart, this indicator projects dynamic volume trace lines directly onto the price action. Each bin is color-graded according to its relative strength, creating a living “volume skeleton” of the market. The orange trace highlights the current Point of Control (POC)—the price level with maximum historical traded volume within the lookback window. On the right side, the tool builds a mini profile, showing absolute volume per bin alongside its percentage share, where the POC always represents 100% strength .
⯁ KEY FEATURES
Dynamic On-Chart Bins:
The range between highest high and lowest low is split into 25 bins. Each bin is drawn as a horizontal trace line across the lookback chart period.
Gradient Color Encoding:
Trace lines fade from transparent to teal depending on relative volume size. The more intense the teal, the stronger the historical traded activity at that level.
Automatic POC Highlight:
The bin with the highest aggregated volume is flagged with an orange line . This POC adapts bar-by-bar as volume distribution shifts.
Right-Side Volume Profile:
At the chart’s right edge, the script prints a box-style profile. Each bin shows:
• Total volume (absolute units).
• Percentage of max volume, in parentheses (POC bin = 100%).
This gives both raw and normalized context at a glance.
Adjustable Lookback Window:
The lookback defines how many bars feed the profile. Increase for stable HTF zones or decrease for responsive intraday distributions.
POC Toggle & Styling:
Optionally toggle POC highlighting on/off, adjust colors, and set line thickness for better integration with your chart theme.
⯁ HOW IT WORKS (UNDER THE HOOD)
Step Sizing:
over last 100 bars is divided by to calculate bin height.
Volume Aggregation:
For each bar in the , the script checks which bin the close falls into, then adds that bar’s volume to the bin’s counter.
Gradient Mapping:
Bin volume is normalized against the max volume across all bins. That value is mapped onto a gradient from transparent → teal.
POC Logic:
The bin with highest volume is colored orange both on the dynamic trace and in the right-side profile.
Right-Hand Profile:
Boxes are drawn for each bin proportional to volume / maxVolume × 50 units, with text labels showing both absolute volume and normalized %.
⯁ USAGE
Use the orange trace as the dominant “magnet” level—price often gravitates to the POC.
Watch for clusters of strong teal traces as areas of high acceptance; thin or faint zones mark low-liquidity gaps prone to fast moves.
On intraday charts, tighten lookback to reveal session-based distributions . For swing or position trading, expand lookback to surface more durable volume shelves.
Compare the right-side profile % to judge how “top-heavy” or “bottom-heavy” the current distribution is.
Use bright, intense color traces as context for confluence with structure, OBs, or liquidity hunts.
⯁ CONCLUSION
Dynamic Volume Trace Profile takes the traditional volume profile and fuses it into the body of price itself. Instead of a fixed sidebar, you see gradient traces layered directly on the chart, giving real-time context of where volume concentrated and where price may be drawn. With built-in POC highlighting, normalized % readouts, and an adaptive right-side profile, it offers both precision levels and market structure awareness in a cleaner, more intuitive form.
Wskaźniki i strategie

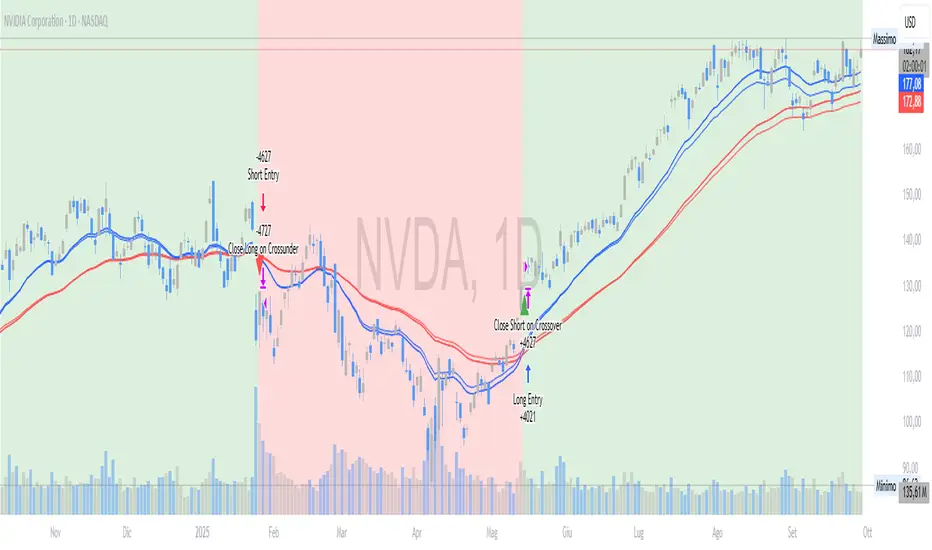
Pivot Trend Flow [BigBeluga]🔵 OVERVIEW
Pivot Trend Flow turns raw swing points into a clean, adaptive trend band. It averages recent pivot highs and lows to form two dynamic reference levels; when price crosses above the averaged highs, trend flips bullish and a green band is drawn; when it crosses below the averaged lows, trend flips bearish and a red band is drawn. During an uptrend the script highlights breakouts of previous pivot highs with ▲ labels, and during a downtrend it flags breakdowns of previous pivot lows with ▼ labels—making structure shifts and continuation signals obvious.
🔵 CONCEPTS
Pivot-Based Averages : Recent pivot highs/lows are collected and averaged to create smoothed upper/lower reference levels.
if not na(ph)
phArray.push(ph)
if not na(pl)
plArray.push(pl)
if phArray.size() > avgWindow
upper := phArray.avg()
phArray.shift()
if plArray.size() > avgWindow
lower := plArray.avg()
plArray.shift()
Trend State via Crosses : Close above the averaged-highs ⇒ bullish trend; close below the averaged-lows ⇒ bearish trend.
Trend Band : A colored band (green/red) is plotted and optionally filled to visualize the active regime around price.
Structure Triggers :
In bull mode the tool watches for prior pivot-high breakouts (▲).
In bear mode it watches for prior pivot-low breakdowns (▼).
🔵 FEATURES
Adaptive Trend Detection from averaged pivot highs/lows.
Clear Visuals : Green band in uptrends, red band in downtrends; optional fill for quick read.
Breakout/Breakdown Labels :
▲ marks breaks of previous pivot highs in uptrends
▼ marks breaks of previous pivot lows in downtrends
Minimal Clutter : Uses compact lines and labels that extend only on confirmation.
Customizable Colors & Fill for trend states and band styling.
🔵 HOW TO USE
Pivot Length : Sets how swing points are detected. Smaller = more reactive; larger = smoother.
Avg Window (pivots) : How many recent pivot highs/lows are averaged. Increase to stabilize the band; decrease for agility.
Read the Band :
Green band active ⇒ prioritize longs, pullback buys toward the band.
Red band active ⇒ prioritize shorts, pullback sells toward the band.
Trade the Triggers :
In bull mode, ▲ on a prior pivot-high break can confirm continuation.
In bear mode, ▼ on a prior pivot-low break can confirm continuation.
Combine with Context : Use HTF trend, S/R, or volume for confluence and to filter signals.
Fill Color Toggle : Enable/disable band fill to match your chart style.
🔵 CONCLUSION
Pivot Trend Flow converts swing structure into an actionable, low-lag trend framework. By blending averaged pivots with clean breakout/breakdown labels, it clarifies trend direction, timing, and continuation spots—ideal as a core bias tool or a confirmation layer in any trading system.

Volume Percentile Supertrend [BackQuant]Volume Percentile Supertrend
A volatility and participation aware Supertrend that automatically widens or tightens its bands based on where current volume sits inside its recent distribution. The goal is simple: fewer whipsaws when activity surges, faster reaction when the tape is quiet.
What it does
Calculates a standard Supertrend framework from an ATR on a volume weighted price source.
Measures current volume against its recent percentile and converts that context into a dynamic ATR multiplier.
Widens bands when volume is unusually high to reduce chop. Tightens bands when volume is unusually low to catch turns earlier.
Paints candles, draws the active Supertrend line and optional bands, and prints clear Long and Short signal markers.
Why volume percentile
Fixed ATR multipliers assume all bars are equal. They are not. When participation spikes, price swings expand and a static band gets sliced.
Percentiles place the current bar inside a recent distribution. If volume is in the top slice, the Supertrend allows more room. If volume is in the bottom slice, it expects smaller noise and tightens.
This keeps the same playbook usable across busy sessions and sleepy ones without constant manual retuning.
How it works
Volume distribution - A rolling window computes the Pth percentile of volume. Above that is flagged as high volume. A lower reference percentile marks quiet bars.
Dynamic multiplier - Start from a Base Multiplier. If bar is high volume, scale it up by a function of volume-to-average and a Sensitivity knob. If bar is low volume, scale it down. Smooth the result with an EMA to avoid jitter.
VWMA source - The price input for bands is a short volume weighted moving average of close. Heavy prints matter more.
ATR envelope - Compute ATR on your length. UpperBasic = VWMA + Multiplier x ATR. LowerBasic = VWMA - Multiplier x ATR.
Trailing logic - The final lines trail price so they only move in a direction that preserves Supertrend behavior. This prevents sudden flips from transient pokes.
Direction and signals - Direction flips when price crosses through the relevant trailing line. SupertrendLong and SupertrendShort mark those flips. The plotted Supertrend is the active trailing side.
Inputs and what they change
Volume Lookback - Window for percentile and average. Larger window = stabler percentile, smaller = snappier.
Volume Percentile Level - Threshold that defines high volume. Example 70 means top 30 percent of recent bars are treated as high activity.
Volume Sensitivity - Gain from volume ratio to the dynamic multiplier. Higher = bands expand more when volume spikes.
VWMA Source Length - Smoothing of the volume weighted price source for the bands.
ATR Length - Standard ATR window. Larger = slower, smaller = quicker.
Base Multiplier - Core band width before volume adjustment. Think of this as your neutral volatility setting.
Multiplier Smoothing - EMA on the dynamic multiplier. Reduces back and forth changes when volume oscillates around the threshold.
Show Supertrend on chart - Toggles the active line.
Show Upper Lower Bands - Draws both sides even when inactive. Good for context.
Paint candles according to Trend - Colors bars by trend direction.
Show Long and Short Signals - Prints 𝕃 and 𝕊 markers at flips.
Colors - Choose your long and short palette.
Reading the plot
Supertrend line - Thick line that hugs price from above in downtrends and from below in uptrends. Its distance breathes with volume.
Bands - Optional upper and lower rails. Useful to see the inactive side and judge how wide the envelope is right now.
Signals - 𝕃 prints when the trend flips long. 𝕊 prints when the trend flips short.
Candle colors - Quick bias read at a glance when painting is enabled.
Typical workflows
Trend following - Use 𝕃 flips to initiate longs and ride while bars remain colored long and price respects the lower trailing line. Mirror for shorts with 𝕊 and the upper trailing line. During high volume phases the line will give more room, which helps stay in the move.
Pullback adds - In an established trend, shallow tags toward the active line after a high volume expansion can be add points. The dynamic envelope adjusts to the session so your add distance is not fixed to a stale volatility regime.
Mean reversion filter - In quiet tape the multiplier contracts and flips come earlier. If you prefer fading, watch for quick toggles around the bands when volume percentile remains low. In high volume, avoid fading into the widened line unless you have other strong reasons.
Notes on behavior
High volume bar: the percentile gate opens, volRatio > 1 powers up the multiplier through the Sensitivity lever, bands widen, fewer false flips.
Low volume bar: multiplier contracts, bands tighten, flips can happen earlier which is useful when you want to catch regime changes in quiet conditions.
Smoothing matters: both the price source (VWMA) and the multiplier are smoothed to keep structure readable while still adapting.
Quick checklist
If you see frequent chop and today feels busy: check that volume is above your percentile. Wider bands are expected. Consider letting the trend prove itself against the expanded line before acting.
If everything feels slow and you want earlier entries: percentile likely marks low volume, so bands tighten and 𝕃 or 𝕊 can appear sooner.
If you want more or fewer flips overall: adjust Base Multiplier first. If you want more reaction specifically tied to volume surges: raise Volume Sensitivity. If the envelope breathes too fast: raise Multiplier Smoothing.
What the signals mean
SupertrendLong - Direction changed from non-long to long. 𝕃 marker prints. The active line switches to support below price.
SupertrendShort - Direction changed from non-short to short. 𝕊 marker prints. The active line switches to resistance above price.
Trend color - Bars painted long or short help validate context for entries and management.
Summary
Volume Percentile Supertrend adapts the classic Supertrend to the day you are trading. Volume percentile sets the mood, sensitivity translates it into dynamic band width, and smoothing keeps it clean. The result is a single plot that aims to stay conservative when the tape is loud and act decisively when it is quiet, without you having to constantly retune settings.

Volume Profile 3D (Zeiierman)█ Overview
Volume Profile 3D (Zeiierman) is a next-generation volume profile that renders market participation as a 3D-style profile directly on your chart. Instead of flat histograms, you get a depth-aware profile with parallax, gradient transparency, and bull/bear separation, so you can see where liquidity stacked up and how it shifted during the move.
Highlights:
3D visual effect with perspective and depth shading for clarity.
Bull/Bear separation to see whether up bars or down bars created the volume.
Flexible colors and gradients that highlight where the most significant trading activity took place.
This is a state-of-the-art volume profile — visually powerful, highly flexible, and unlike anything else available.
█ How It Works
⚪ Profile Construction
The price range (from highest to lowest) is divided into a number of levels (buckets). Each bar’s volume is added to the correct level, based on its average price. This builds a map of where trading volume was concentrated.
You can choose to:
Aggregate all volume at each level, or
Split bullish vs. bearish volume , slightly offset for clarity.
This creates a clear view of which price zones matter most to the market.
⚪ 3D Effect Creation
The unique part of this indicator is how the 3D projection is built. Each volume block’s width is scaled to its relative size, then tilted with a slope factor to create a depth effect.
maxVol = bins.bu.max() + bins.be.max()
width = math.max(1, math.floor(bucketVol / maxVol * ((bar_index - start) * mult)))
slope = -(step * dev) / ((bar_index - start) * (mult/2))
factor = math.pow(math.min(1.0, math.abs(slope) / step), .5)
width → determines how far the volume extends, based on relative strength.
slope → creates the angled projection for the 3D look.
factor → adjusts perspective to make deeper areas shrink naturally.
The result is a 3D-style volume profile where large areas pop forward and smaller areas fade back, giving you immediate visual context.
█ How to Use
⚪ Support & Resistance Zones (HVNs and Value Area)
Regions where a lot of volume traded tend to act like walls:
If price approaches a high-volume area from above, it may act as support.
From below, it may act as resistance.
Traders often enter or exit near these zones because they represent strong agreement among market participants.
⚪ POC Rejections & Mean Reversions
The Point of Control (POC) is the single price level with the highest volume in the profile.
When price returns to the POC and rejects it, that’s often a signal for reversal trades.
In ranging markets, price may bounce between edges of the Value Area and revert to POC.
⚪ Breakouts via Low-Volume Zones (LVNs)
Low volume areas (gaps in the profile) offer path of least resistance:
Price often moves quickly through these thin zones when momentum builds.
Use them to spot breakouts or continuation trades.
⚪ Directional Insight
Use the bull/bear separation to see whether buyers or sellers dominated at key levels.
█ Settings
Use Active Chart – Profile updates with visible candles.
Custom Period – Fixed number of bars.
Up/Down – Adjust tilt for the 3D angle.
Left/Right – Scale width of the profile.
Aggregated – Merge bull/bear volume.
Bull/Bear Shift – Separate bullish and bearish volume.
Buckets – Number of price levels.
Choose from templates or set custom colors.
POC Gradient option makes high volume bolder, low volume lighter.
-----------------
Disclaimer
The content provided in my scripts, indicators, ideas, algorithms, and systems is for educational and informational purposes only. It does not constitute financial advice, investment recommendations, or a solicitation to buy or sell any financial instruments. I will not accept liability for any loss or damage, including without limitation any loss of profit, which may arise directly or indirectly from the use of or reliance on such information.
All investments involve risk, and the past performance of a security, industry, sector, market, financial product, trading strategy, backtest, or individual's trading does not guarantee future results or returns. Investors are fully responsible for any investment decisions they make. Such decisions should be based solely on an evaluation of their financial circumstances, investment objectives, risk tolerance, and liquidity needs.

Advanced Market Structure [OmegaTools]📌 Market Structure
Advanced Market Structure is a next–generation indicator designed to decode price structure in real time by combining classical swing–based analysis with modern quantitative confirmation techniques. Built for traders who demand both precision and adaptability, it provides a robust multi–layered framework to identify structural shifts, trend continuations, and potential reversals across any asset class or timeframe.
Unlike traditional structure indicators that rely solely on visual swing identification, Market Structure introduces an integrated methodology: pivot detection, Donchian trend modeling, statistical confirmation via Z–Score, and volume–based validation. Each element contributes to a comprehensive, systematic representation of the underlying market dynamics.
🔑 Core Features
1. Five Distinct Market Structure Modes
Standard Mode:
Captures structural breaks through classical swing high/low pivots. Ideal for discretionary traders looking for clarity in directional bias.
Confirmed Breakout Mode:
Requires validation beyond the initial pivot break, filtering out noise and reducing false positives.
Donchian Trend HL (High/Low):
Establishes structure based on absolute highs and lows over rolling lookback windows. This approach highlights broader momentum shifts and trend–defining extremes.
Donchian Trend CC (Close/Close):
Similar to HL mode, but calculated using closing prices, enabling more precise bias identification where close–to–close structure carries stronger statistical weight.
Average Mode:
A composite methodology that synthesizes the four models into a weighted signal, producing a balanced structural bias designed to minimize model–specific weaknesses.
2. Dynamic Pivot Recognition with Auto–Updating Levels
Swing highs and lows are automatically detected and plotted with adaptive horizontal levels. These dynamic support/resistance markers continuously extend into the future, ensuring that historically significant levels remain visible and actionable.
3. Color–Adaptive Candlesticks
Price bars are dynamically recolored to reflect the prevailing structural regime: bullish (default blue), bearish (default red), or neutral (gray). This enables instant visual recognition of regime changes without requiring external confirmation.
4. Statistical Reversal Triggers
The script integrates a 21–period Z–Score calculation applied to closing prices, combined with multi–layered volume confirmation (SMA and EMA convergence).
Bullish trigger: Z–Score < –2 with structural confirmation and volume support.
Bearish trigger: Z–Score > +2 with structural confirmation and volume support.
Signals are plotted as diamond markers above or below the bars, identifying potential high–probability reversal setups in real time.
5. Integrated Alpha Backtesting Engine
Each market structure mode is evaluated through a built–in backtesting routine, tracking hit ratios and consistency across the most recent ~2000 structural events.
Performance metrics (“Alpha”) are displayed directly on–chart via a dedicated Performance Dashboard Table, allowing side–by–side comparison of Standard, Confirmed Breakout, Donchian HL, Donchian CC, and Average models.
Traders can instantly evaluate which structural methodology best adapts to the current market conditions.
🎯 Practical Advantages
Systematic Clarity: Eliminates subjectivity in defining structural bias, offering a rules–based framework.
Statistical Transparency: Built–in performance metrics validate each mode in real time, allowing informed decision–making.
Noise Reduction: Confirmed Breakouts and Donchian modes filter out common traps in structural trading.
Multi–Asset Adaptability: Optimized for scalping, intraday, swing, and multi–day strategies across FX, equities, futures, commodities, and crypto.
Complementary Usage: Works as a stand–alone structure identifier or as a quantitative filter in larger algorithmic/trading frameworks.
⚙️ Ideal Users
Discretionary traders seeking an objective reference for structural bias.
Quantitative/systematic traders requiring on–chart statistical validation of structural regimes.
Technical analysts leveraging pivots, Donchian channels, and price action as part of broader frameworks.
Portfolio traders integrating structure into multi–factor models.
💡 Why This Tool?
Market Structure is not a static indicator — it is an adaptive framework. By merging classical pivot theory with Donchian–style momentum analysis, and reinforcing both with statistical backtesting and volume confirmation, it provides traders with a unique ability:
To see the structure,
To measure its reliability,
And to act with confidence on quantifiably validated signals.

W Pattern Finder📊 W Pattern Finder
English:
This indicator automatically detects W-Patterns (Double Bottoms) following the HLHL structure and marks the last four crucial points on the chart.
Additionally, it draws the neckline, a Take Profit (TP) and a Stop Loss (SL) – including a Risk/Reward ratio.
✨ Features
* Automatic detection of W-Patterns (Double Bottoms)
* Draws the neckline and the last 4 key points
* Calculates and displays TP and SL levels (with adjustable RR ratio)
* Auto-Clear: All objects are removed once TP or SL is reached
* Fully customizable colors & widths for pattern, TP and SL lines
* Tolerance filter for lows to improve clean pattern recognition
* Visual marking of the W-pattern directly in the chart
⚙️ Settings
* Pivot Length → controls sensitivity of pattern detection
* Line color & width for the pattern
* Individual colors and widths for TP and SL lines
* Risk/Reward Ratio (RR) freely adjustable
* Tolerance (%) for deviation of lows
📈 Use Case
This indicator is especially useful for chart technicians & pattern traders who trade W-formations (Double Bottoms).
With the automatic calculation of TP & SL, it becomes instantly clear whether a trade is worth taking.
⚠️ Disclaimer:
This indicator is not financial advice. It is intended for educational and analytical purposes only.
Use it in trading at your own risk

HyperOscillatorThis indicator, HyperOscillator, is an enhanced oscillator designed to measure synthetic momentum by averaging percentage changes across multiple moving average periods. It provides a clear view of trend strength with a main line that turns green for bullish momentum and purple for bearish, alongside histograms for upper and lower bounds to spot crossovers. Exhaustion points are highlighted with circles for potential reversals, and you can enable divergence labels to detect regular or hidden mismatches between price and momentum. Volume weighting amplifies signals in high-activity bars, while multi-timeframe support brings in higher TF data for better context. The dashboard shows momentum strength as a 0-100% rank, risk level for overbought/oversold, and a flat data warning. Customize scales and styles to fit your chart, and pair it with HyperChannel for spotting exhaustion at channel edges. Not financial advice—experiment and see how it boosts your trading!

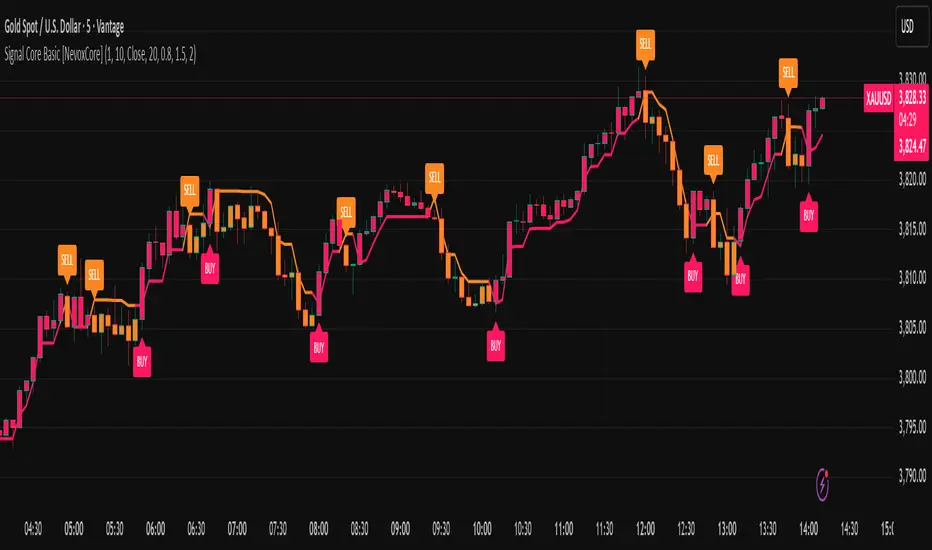
Signal Core Basic [NevoxCore]⯁ OVERVIEW
Signal Core Basic is a clean and functional ATR-based trailing stop with BUY/SELL signals.
It modernizes the classic "UT-style" concept with adaptive sensitivity, multi-source inputs (Close, Heikin-Ashi, ZLEMA, KAMA), and compact visuals.
The tool is designed for traders who want a clear, minimal, and reliable base indicator without repainting issues.
⯁ HOW IT WORKS
Calculates an ATR-based trailing stop (nLoss = Key × ATR).
Adaptive mode scales sensitivity depending on trend strength (trend/range detection).
Trailing stop flips when price crosses from one regime to the other.
BUY/SELL signals trigger only when confirmed and not blocked by cooldown.
Label ring-buffer ensures chart stays clean (max 50 labels).
Bar coloring optional (solid), auto-disabled when classic red/green colors are enabled.
⯁ KEY FEATURES
ATR-based trailing stop with adjustable sensitivity.
Adaptive key (trend/range aware).
Multiple compute sources: Close, Heikin-Ashi, ZLEMA, KAMA.
Global confirm-on-close switch (no repaint).
Early-flip protection (cooldown).
Compact BUY/SELL labels with auto-cleanup (max 50).
Optional solid bar coloring.
Alerts with ticker, timeframe, and price included.
⯁ SETTINGS (quick overview)
Visual: Classic Colors, Show Labels, Plot Trailing Stop, Barcolor ON/OFF.
Source & Sensitivity: Key Value, ATR Length, Compute Source.
Advanced: Adaptive Key toggle with min/max bounds.
Global: Confirm on bar close.
Extras: Cooldown protection (bars).
⯁ ALERTS (built-in)
Basic Long: BUY signal.
Basic Short: SELL signal.
Each alert includes {{ticker}} {{interval}} @ {{close}}.
⯁ HOW TO USE
Use as a trailing stop and regime filter.
Combine BUY/SELL signals with your strategy rules.
Enable cooldown for cleaner signals in choppy markets.
Try ZLEMA or Heikin-Ashi as compute source for smoother performance.
⯁ WHY IT’S DIFFERENT
Unlike generic UT-style scripts, Signal Core Basic adds adaptive sensitivity, multiple input sources, and strict non-repaint safety.
The visuals follow NevoxCore’s design standards: compact, minimal, and clean — ready for live trading with alerts.
⯁ DISCLAIMER
Backtest and paper-trade before using live. Not financial advice.
Performance depends on market, timeframe, and parameters.
Multi-TF CandlesMulti-Timeframe Support
Displays up to 6 different timeframes simultaneously
Configurable HTFs (default: 5m, 15m, 60m, 240m, 1D, 1W)
Customizable display limits (1-6 sets)
Visual Elements
Candlesticks: Full OHLC representation with customizable colors
Body & Wicks: Separate coloring for bullish/bearish candles
Fair Value Gaps (FVG): Automatically detects and highlights imbalance areas
Volume Imbalances: Identifies and marks volume-based imbalances
Day of Week Labels: Shows trading days for daily candles
Customization Options
Styling
Bullish/Bearish body colors with transparency
Border and wick colors
Candle width and spacing
Padding from current price
Labels & Information
HTF timeframe labels
Remaining time until candle close
Price tracing lines (Open, High, Low, Close)
Custom alignment options (Align/Follow Candles)
Advanced Features
Custom Daily Open Times: Midnight, 8:30, or 9:30 AM NY time
Trace Lines: Visual lines connecting HTF levels to current price
Imbalance Detection: Automatic FVG and volume imbalance detection
Real-time Updates: Live countdown to candle completion
Technical Details
Version: Pine Script v6
Overlay: Yes (displays directly on price chart)
Max Elements: 500 boxes, lines, labels each
Max Bars Back: 5000
Usage Benefits
Market Context: See multiple timeframes at once for better decision-making
Key Level Identification: Spot important support/resistance from HTFs
Pattern Recognition: Identify trends and reversals across timeframes
Efficiency: No need to switch between different chart timeframes
Customizable: Extensive settings to match your trading style
Ideal For
Swing traders analyzing multiple timeframes
Day traders wanting broader market context
Technical analysts identifying key levels
Anyone practicing multi-timeframe analysis
Scalper - Pattern Recognition & Price Action with Divergence Scalper - Pattern Recognition & Price Action with Divergence
Overview
An educational indicator designed to demonstrate comprehensive technical analysis concepts through integrated pattern recognition, price action analysis, and divergence detection. This tool combines traditional candlestick patterns with modern institutional concepts and advanced divergence analysis for educational market study.
Educational Purpose & Originality
Core Educational Concepts
This indicator serves as a learning platform for understanding:
- **Pattern Recognition Methodology**: Systematic identification of candlestick formations
- **Price Action Theory**: Modern institutional footprint analysis
- **Divergence Analysis**: Momentum divergence detection across multiple oscillators
- **Confluence Systems**: Multi-signal integration and validation techniques
Original Implementation Features
1. Enhanced Pattern Detection Library
- **Volatility-Filtered Patterns**: ATR-based validation for pattern significance
- **Volume-Confirmed Formations**: Integration of volume analysis with pattern detection
- **Multi-Candle Pattern Recognition**: Three-candle formations and complex patterns
- **Context-Aware Detection**: Patterns validated against market structure
2. Advanced Divergence System
- **Multi-Oscillator Analysis**: RSI, CCI, and MACD divergence detection
- **Four Divergence Types**: Regular bullish/bearish and hidden bullish/bearish
- **Pivot-Based Detection**: Systematic swing high/low identification
- **Weighted Signal Integration**: Divergences integrated into confluence scoring
3. Modern Price Action Concepts
- **Fair Value Gaps (FVG)**: Identification of institutional inefficiencies
- **Order Block Detection**: Volume-validated accumulation/distribution zones
- **Dynamic Support/Resistance**: Touch-count validated levels with ATR tolerance
- **Breakout Analysis**: Volume-confirmed price breakouts
4. Intelligent Confluence System
- **Multi-Signal Aggregation**: Combines patterns, oscillators, divergences, and breakouts
- **Weighted Scoring Algorithm**: Different signal types receive appropriate weighting
- **Visual Confluence Display**: Clear indication of high-probability setups
- **Reason Tracking**: Shows which signals contribute to confluence
How to Use
Initial Configuration
1. **Enable Desired Components**: Toggle individual analysis modules based on learning focus
2. **Adjust Sensitivity Settings**: Configure pattern detection parameters for your market
3. **Select Divergence Options**: Choose oscillators and divergence types to monitor
4. **Set Confluence Requirements**: Define minimum signals needed for confirmation
Component Settings
Moving Average Configuration
- Four customizable MA lines for multi-timeframe trend analysis
- Selectable MA types (SMA, EMA, WMA, VWMA, HMA)
- Independent timeframe settings for each MA
Pattern Recognition Settings
- **Engulfing Patterns**: Strong engulfing with ATR validation
- **Doji Variations**: Standard, gravestone, and dragonfly detection
- **Hammer/Hanging Man**: Context-validated reversal patterns
- **Star Formations**: Morning and evening star patterns
- **Three Soldiers/Crows**: Momentum continuation patterns
Divergence Detection Parameters
- **Lookback Period**: Adjustable swing detection range
- **Minimum Pivot Strength**: Percentage threshold for valid pivots
- **Oscillator Selection**: RSI, CCI, MACD, or combination
- **Divergence Types**: Regular and hidden divergences
Signal Interpretation
Visual Indicators
- **Pattern Labels**: Clear marking of detected formations
- **Divergence Lines**: Visual connection between price and oscillator pivots
- **Support/Resistance Levels**: Dynamic horizontal levels with validation
- **Confluence Signals**: Large "BULL" or "BEAR" labels for high-probability setups
Dashboard Information
- Real-time oscillator values (RSI, CCI, MACD)
- Current signal count for bulls and bears
- Active divergence status
- Confluence confirmation status
Important Educational Considerations
Learning Focus
- **Pattern Study**: Understand how traditional patterns form and their limitations
- **Divergence Concepts**: Learn to identify momentum shifts before price reversals
- **Confluence Theory**: Practice combining multiple analysis techniques
- **Risk Awareness**: No pattern or signal guarantees future price movement
Limitations for Learning
- **Historical Analysis**: Patterns are identified after formation
- **No Predictive Guarantee**: Educational tool for understanding concepts, not predictions
- **Market Context Required**: Patterns should be considered within broader market context
- **Practice Required**: Effective use requires study and practice
Educational Best Practices
1. **Start Simple**: Enable one component at a time to understand each concept
2. **Paper Trade**: Practice identifying signals without real money risk
3. **Study Failed Signals**: Learn why patterns fail to improve understanding
4. **Combine with Other Analysis**: Use alongside fundamental and sentiment analysis
5. **Document Observations**: Keep a journal of pattern occurrences and outcomes
Technical Components
Indicator Architecture
- **Modular Design**: Independent modules for different analysis types
- **Performance Optimization**: Efficient calculation methods for smooth operation
- **Visual Management**: Controlled use of Pine Script drawing objects
- **Array-Based Storage**: Efficient data management for historical analysis
Calculation Methods
- **ATR-Based Validation**: Volatility-adjusted pattern filtering
- **Volume Analysis**: Comparative volume assessment for confirmation
- **Pivot Detection**: Mathematical identification of swing points
- **Statistical Validation**: Touch-count and tolerance-based S/R levels
Divergence Detection Methodology
Regular Divergences (Reversal Signals)
- **Bullish**: Price lower low + Oscillator higher low
- **Bearish**: Price higher high + Oscillator lower high
Hidden Divergences (Continuation Signals)
- **Hidden Bullish**: Price higher low + Oscillator lower low
- **Hidden Bearish**: Price lower high + Oscillator higher high
Validation Criteria
- Minimum pivot strength requirement (percentage-based)
- Lookback period for swing detection
- Multiple oscillator confirmation option
Confluence Scoring System
Signal Categories
1. **Pattern Signals** (Weight: 1): Candlestick formations
2. **Oscillator Signals** (Weight: 1): RSI/CCI extremes
3. **Breakout Signals** (Weight: 1): Volume-confirmed breaks
4. **Regular Divergences** (Weight: 2): Higher probability reversals
5. **Hidden Divergences** (Weight: 1): Trend continuation signals
Confluence Thresholds
- Adjustable minimum signal requirement (2-6 signals)
- Visual indication when threshold is met
- Detailed reason display for educational understanding
Educational Dashboard
Real-Time Metrics
- Oscillator readings (RSI, CCI, MACD)
- ATR volatility measurement
- Bull/Bear signal counts
- Divergence status
- Confluence confirmation
Customization Options
- Position selection (6 screen locations)
- Color customization for all elements
- Enable/disable individual components
Version Information
- **Version 1.1**: Added comprehensive divergence detection system
- **Educational Focus**: Designed for learning technical analysis concepts
- **Integration**: All components work together in confluence system
Disclaimer
This indicator is designed exclusively for educational purposes to demonstrate technical analysis concepts. It is not financial advice and should not be used as the sole basis for trading decisions. Past patterns and signals do not guarantee future results. Trading involves substantial risk of loss. Users should conduct their own research, practice with demo accounts, and consider seeking advice from qualified professionals before making investment decisions.
Learning Resources
The indicator includes extensive inline comments explaining each calculation and concept. Users are encouraged to study the source code to understand the methodology behind each component. This transparency aids in learning how technical indicators work and their limitations.
---
**Note**: This is an educational tool meant to help traders learn pattern recognition and technical analysis concepts. Success requires practice, additional analysis, and proper risk management.

Fib Retracement ( AUTO)Key Features:
Automatic Pivot Detection:
Uses ZigZag algorithm to identify significant highs and lows
Configurable depth and deviation settings for pivot sensitivity
Automatically updates with new price data
Fibonacci Levels:
Standard retracement levels: 0%, 23.6%, 38.2%, 50%, 61.8%, 78.6%, 100%
Optional negative extension levels (-23.6%, -38.2%, -61.8%, -65%)
Clean visual presentation without extension levels beyond 100%
Customization Options:
Deviation: Controls sensitivity of pivot detection (higher values = fewer pivots)
Depth: Minimum bars between pivot points
Reverse: Switch between measuring from high-to-low or low-to-high
Extend Lines: Choose to extend lines left, right, both, or none
Display Format: Show levels as values or percentages
Label Position: Place labels on left or right side
Background Transparency: Adjust shading between levels
Visual Elements:
Colored horizontal lines at each Fibonacci level
Clear price labels aligned properly with levels
Optional background shading between levels
Dashed gray line connecting the pivot points
Alert System:
Automatic alerts when price crosses any Fibonacci level
Customizable alert messages with symbol and level information
Usage:
Traders use this indicator to identify potential support and resistance levels, entry/exit points, and to gauge the strength of price retracements within trends. The automatic nature eliminates subjective drawing and ensures consistent application of Fibonacci principles across different charts and timeframes.
Ideal For:
Swing traders looking for retracement entries
Position traders identifying key levels
Technical analysts automating Fibonacci analysis
Any trader wanting objective Fibonacci level placement
The indicator works across all timeframes and markets, providing reliable Fibonacci retracement levels without manual intervention.

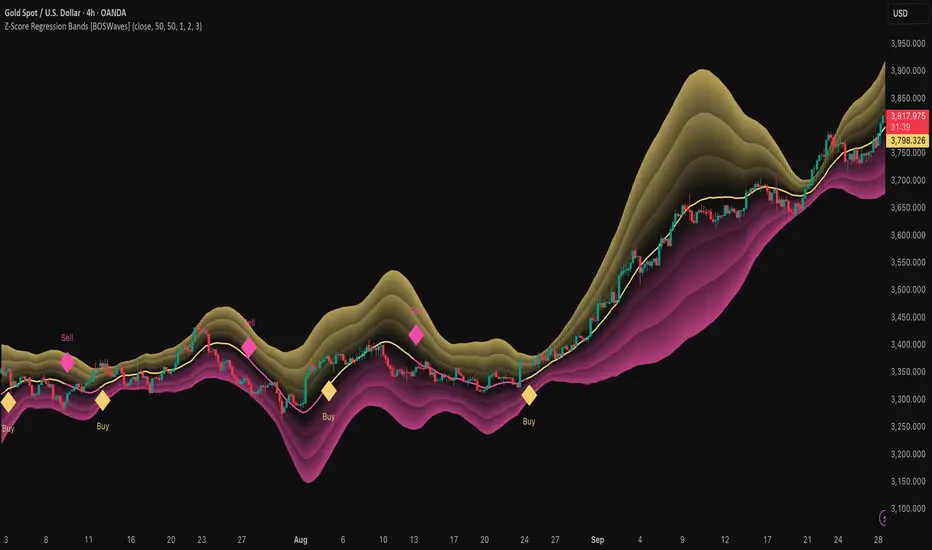
Z-Score Regression Bands [BOSWaves]Z-Score Regression Bands – Adaptive Trend and Volatility Insight
Overview
The Z-Score Regression Bands is a trend and volatility analysis framework designed to give traders a clear, structured view of price behavior. It combines Least Squares Moving Average (LSMA) regression, a statistical method to detect underlying trends, with Z-Score standardization, which measures how far price deviates from its recent average.
Traditional moving average bands, like Bollinger Bands, often lag behind trends or generate false signals in noisy markets. Z-Score Regression Bands addresses these limitations by:
Tracking trends accurately using LSMA regression
Normalizing deviations with Z-Scores to identify statistically significant price extremes
Visualizing multiple bands for normal, strong, and extreme moves
Highlighting trend shifts using diamond markers based on Z-Score crossings
This multi-layered approach allows traders to understand trend strength, detect overextensions, and identify periods of low or high volatility — all from a single, clear chart overlay. It is designed for traders of all levels and can be applied across scalping, day trading, swing trading, and longer-term strategies.
Theoretical Foundation
The Z-Score Regression Bands are grounded in statistical and trend analysis principles. Here’s the idea in plain terms:
Least Squares Moving Average (LSMA) – Unlike standard moving averages, LSMA fits a straight line to recent price data using regression. This “best-fit” line shows the underlying trend more precisely and reduces lag, helping traders see trend changes earlier.
Z-Score Standardization – A Z-Score expresses how far the LSMA is from its recent mean in standard deviation units. This shows whether price is unusually high or low, which can indicate potential reversals, pullbacks, or acceleration of a trend.
Multi-Band Structure – The three bands represent: Band #1: Normal range of price fluctuations; Band #2: Significant deviation from the trend; Band #3: Extreme price levels that are statistically rare. The distance between bands dynamically adapts to market volatility, allowing traders to visualize expansions (higher volatility) and contractions (lower volatility).
Trend Signals – When Z-Score crosses zero, diamonds appear on the chart. These markers signal potential trend initiation, continuation, or reversal, offering a simple alert for shifts in market momentum.
How It Works
The indicator calculates and plots several layers of information:
LSMA Regression (Trend Detection)
Computes a line that best fits recent price points.
The LSMA line smooths out minor fluctuations while reflecting the general direction of the market.
Z-Score Calculation (Deviation Measurement)
Standardizes the LSMA relative to its recent average.
Positive Z-Score → LSMA above average, negative → LSMA below average.
Helps identify overbought or oversold conditions relative to the trend.
Multi-Band Construction (Volatility Envelope)
Upper and lower bands are placed at configurable multiples of standard deviation.
Band #1 captures typical price movement, Band #2 signals stronger deviation, Band #3 highlights extreme moves.
Bands expand and contract with volatility, giving an intuitive visual guide to market conditions.
Trend Signals (Diamonds)
Appear when Z-Score crosses zero.
Indicates moments when momentum may shift, helping traders time entries or exits.
Visual Interpretation
Band width = volatility: wide bands indicate strong movement; narrow bands indicate calm periods.
LSMA shows underlying trend direction, while bands show how far price has strayed from that trend.
Interpretation
The Z-Score Regression Bands provide a multi-dimensional view of market behavior:
Trend Analysis – LSMA line slope shows general market direction.
Momentum & Volatility – Z-Score indicates whether the trend is accelerating or losing strength; band width indicates volatility levels.
Price Extremes – Price touching Band #2 or #3 may suggest overextension and potential reversals.
Trend Shifts – Diamonds signal statistically significant changes in momentum.
Cycle Awareness – Standard deviation bands help distinguish normal market fluctuations from extreme events.
By combining these insights, traders can avoid false signals and react to meaningful structural shifts in the market.
Strategy Integration
Trend Following
Enter trades when diamonds indicate momentum aligns with LSMA direction.
Use Band #1 and #2 for stop placement and partial exits.
Breakout Trading
Watch for narrow bands (low volatility) followed by price pushing outside Band #1 or #2.
Confirm with Z-Score movement in the breakout direction.
Mean Reversion/Pullback
If price reaches Band #2 or #3 without continuation, expect a pullback toward LSMA.
Exhaustion & Reversals
Flattening Z-Score near zero while price remains at extreme bands signals trend weakening.
Tighten stops or scale out before a potential reversal.
Multi-Timeframe Confirmation
High timeframe LSMA confirms the main trend.
Lower timeframe bands provide refined entry and exit points.
Technical Implementation
LSMA Regression : Best-fit line minimizes lag and captures trend slope.
Z-Score Standardization : Normalizes deviation to allow consistent interpretation across markets.
Multi-Band Envelope : Three layers for normal, strong, and extreme deviations.
Trend Signals : Automatic diamonds for Z-Score zero-crossings.
Band Fill Options : Optional shading to visualize volatility expansions and contractions.
Optimal Application
Asset Classes:
Forex : Capture breakouts, overextensions, and trend shifts.
Crypto : High-volatility adaptation with adjustable band multipliers.
Stocks/ETFs : Identify trending sectors, reversals, and pullbacks.
Indices/Futures : Track cycles and structural trends.
Timeframes:
Scalping (1–5 min) : Focus on Band #1 and trend signals for fast entries.
Intraday (15m–1h) : Use Bands #1–2 for continuation and breakout trades.
Swing (4h–Daily) : Bands #2–3 capture trend momentum and exhaustion.
Position (Daily–Weekly) : LSMA trend dominates; Bands #3 highlight regime extremes.
Performance Characteristics
Strong Performance:
Trending markets with moderate-to-high volatility
Assets with steady liquidity and identifiable cycles
Weak Performance:
Flat or highly choppy markets
Very short timeframes (<1 min) dominated by noise
Integration Tips
Combine with support/resistance, volume, or order flow analysis for confirmation.
Use bands for stops, targets, or scaling positions.
Apply multi-timeframe analysis: higher timeframe LSMA confirms main trend, lower timeframe bands refine entries.
Disclaimer
The Z-Score Regression Bands is a trading analysis tool, not a guaranteed profit system. Its effectiveness depends on market conditions, parameter selection, and disciplined risk management. Use it as part of a broader trading strategy, not in isolation.
BayesStack RSI [CHE]BayesStack RSI — Stacked RSI with Bayesian outcome stats and gradient visualization
Summary
BayesStack RSI builds a four-length RSI stack and evaluates it with a simple Bayesian success model over a rolling window. It highlights bull and bear stack regimes, colors price with magnitude-based gradients, and reports per-regime counts, wins, and estimated win rate in a compact table. Signals seek to be more robust through explicit ordering tolerance, optional midline gating, and outcome evaluation that waits for events to mature by a fixed horizon. The design focuses on readable structure, conservative confirmation, and actionable context rather than raw oscillator flips.
Motivation: Why this design?
Classical RSI signals flip frequently in volatile phases and drift in calm regimes. Pure threshold rules often misclassify shallow pullbacks and stacked momentum phases. The core idea here is ordered, spaced RSI layers combined with outcome tracking. By requiring a consistent order with a tolerance and optionally gating by the midline, regime identification becomes clearer. A horizon-based maturation check and smoothed win-rate estimate provide pragmatic feedback about how often a given stack has recently worked.
What’s different vs. standard approaches?
Reference baseline: Traditional single-length RSI with overbought and oversold rules or simple crossovers.
Architecture differences:
Four fixed RSI lengths with strict ordering and a spacing tolerance.
Optional requirement that all RSI values stay above or below the midline for bull or bear regimes.
Outcome evaluation after a fixed horizon, then rolling counts and a prior-smoothed win rate.
Dispersion measurement across the four RSIs with a percent-rank diagnostic.
Gradient coloring of candles and wicks driven by stack magnitude.
A last-bar statistics table with counts, wins, win rate, dispersion, and priors.
Practical effect: Charts emphasize sustained momentum alignment instead of single-length crosses. Users see when regimes start, how strong alignment is, and how that regime has recently performed for the chosen horizon.
How it works (technical)
The script computes RSI on four lengths and forms a “stack” when they are strictly ordered with at least the chosen tolerance between adjacent lengths. A bull stack requires a descending set from long to short with positive spacing. A bear stack requires the opposite. Optional gating further requires all RSI values to sit above or below the midline.
For evaluation, each detected stack is checked again after the horizon has fully elapsed. A bull event is a success if price is higher than it was at event time after the horizon has passed. A bear event succeeds if price is lower under the same rule. Rolling sums over the training window track counts and successes; a pair of priors stabilizes the win-rate estimate when sample sizes are small.
Dispersion across the four RSIs is measured and converted to a percent rank over a configurable window. Gradients for bars and wicks are normalized over a lookback, then shaped by gamma controls to emphasize strong regimes. A statistics table is created once and updated on the last bar to minimize overhead. Overlay markers and wick coloring are rendered to the price chart even though the indicator runs in a separate pane.
Parameter Guide
Source — Input series for RSI. Default: close. Tips: Use typical price or hlc3 for smoother behavior.
Overbought / Oversold — Guide levels for context. Defaults: seventy and thirty. Bounds: fifty to one hundred, zero to fifty. Tips: Narrow the band for faster feedback.
Stacking tolerance (epsilon) — Minimum spacing between adjacent RSIs to qualify as a stack. Default: zero point twenty-five RSI points. Trade-off: Higher values reduce false stacks but delay entries.
Horizon H — Bars ahead for outcome evaluation. Default: three. Trade-off: Longer horizons reduce noise but delay success attribution.
Rolling window — Lookback for counts and wins. Default: five hundred. Trade-off: Longer windows stabilize the win rate but adapt more slowly.
Alpha prior / Beta prior — Priors used to stabilize the win-rate estimate. Defaults: one and one. Trade-off: Larger priors reduce variance with sparse samples.
Show RSI 8/13/21/34 — Toggle raw RSI lines. Default: on.
Show consensus RSI — Weighted combination of the four RSIs. Default: on.
Show OB/OS zones — Draw overbought, oversold, and midline. Default: on.
Background regime — Pane background tint during bull or bear stacks. Default: on.
Overlay regime markers — Entry markers on price when a stack forms. Default: on.
Show statistics table — Last-bar table with counts, wins, win rate, dispersion, priors, and window. Default: on.
Bull requires all above fifty / Bear requires all below fifty — Midline gate. Defaults: both on. Trade-off: Stricter regimes, fewer but cleaner signals.
Enable gradient barcolor / wick coloring — Gradient visuals mapped to stack magnitude. Defaults: on. Trade-off: Clearer regime strength vs. extra rendering cost.
Collection period — Normalization window for gradients. Default: one hundred. Trade-off: Shorter values react faster but fluctuate more.
Gamma bars and shapes / Gamma plots — Curve shaping for gradients. Defaults: zero point seven and zero point eight. Trade-off: Higher values compress weak signals and emphasize strong ones.
Gradient and wick transparency — Visual opacity controls. Defaults: zero.
Up/Down colors (dark and neon) — Gradient endpoints. Defaults: green and red pairs.
Fallback neutral candles — Directional coloring when gradients are off. Default: off.
Show last candles — Limit for gradient squares rendering. Default: three hundred thirty-three.
Dispersion percent-rank length / High and Low thresholds — Window and cutoffs for dispersion diagnostics. Defaults: two hundred fifty, eighty, and twenty.
Table X/Y, Dark theme, Text size — Table anchor, theme, and typography. Defaults: right, top, dark, small.
Reading & Interpretation
RSI stack lines: Alignment and spacing convey regime quality. Wider spacing suggests stronger alignment.
Consensus RSI: A single line that summarizes the four lengths; use as a smoother reference.
Zones: Overbought, oversold, and midline provide context rather than standalone triggers.
Background tint: Indicates active bull or bear stack.
Markers: “Bull Stack Enter” or “Bear Stack Enter” appears when the stack first forms.
Gradients: Brighter tones suggest stronger stack magnitude; dull tones suggest weak alignment.
Table: Count and Wins show sample size and successes over the window. P(win) is a prior-stabilized estimate. Dispersion percent rank near the high threshold flags stretched alignment; near the low threshold flags tight clustering.
Practical Workflows & Combinations
Trend following: Enter only on new stack markers aligned with structure such as higher highs and higher lows for bull, or lower lows and lower highs for bear. Use the consensus RSI to avoid chasing into overbought or oversold extremes.
Exits and stops: Consider reducing exposure when dispersion percent rank reaches the high threshold or when the stack loses ordering. Use the table’s P(win) as a context check rather than a direct signal.
Multi-asset and multi-timeframe: Defaults travel well on liquid assets from intraday to daily. Combine with higher-timeframe structure or moving averages for regime confirmation. The script itself does not fetch higher-timeframe data.
Behavior, Constraints & Performance
Repaint and confirmation: Stack markers evaluate on the live bar and can flip until close. Alert behavior follows TradingView settings. Outcome evaluation uses matured events and does not look into the future.
HTF and security: Not used. Repaint paths from higher-timeframe aggregation are avoided by design.
Resources: max bars back is two thousand. The script uses rolling sums, percent rank, gradient rendering, and a last-bar table update. Shapes and colored wicks add draw overhead.
Known limits: Lag can appear after sharp turns. Very small windows can overfit recent noise. P(win) is sensitive to sample size and priors. Dispersion normalization depends on the collection period.
Sensible Defaults & Quick Tuning
Start with the shipped defaults.
Too many flips: Increase stacking tolerance, enable midline gates, or lengthen the collection period.
Too sluggish: Reduce stacking tolerance, shorten the collection period, or relax midline gates.
Sparse samples: Extend the rolling window or increase priors to stabilize P(win).
Visual overload: Disable gradient squares or wick coloring, or raise transparency.
What this indicator is—and isn’t
This is a visualization and context layer for RSI stack regimes with simple outcome statistics. It is not a complete trading system, not predictive, and not a signal generator on its own. Use it with market structure, risk controls, and position management that fit your process.
Metadata
- Pine version: v6
- Overlay: false (price overlays are drawn via forced overlay where applicable)
- Primary outputs: Four RSI lines, consensus line, OB/OS guides, background tint, entry markers, gradient bars and wicks, statistics table
- Inputs with defaults: See Parameter Guide
- Metrics and functions used: RSI, rolling sums, percent rank, dispersion across RSI set, gradient color mapping, table rendering, alerts
- Special techniques: Ordered RSI stacking with tolerance, optional midline gating, horizon-based outcome maturation, prior-stabilized win rate, gradient normalization with gamma shaping
- Performance and constraints: max bars back two thousand, rendering of shapes and table on last bar, no higher-timeframe data, no security calls
- Recommended use-cases: Regime confirmation, momentum alignment, post-entry management with dispersion and recent outcome context
- Compatibility: Works across assets and timeframes that support RSI
- Limitations and risks: Sensitive to parameter choices and market regime changes; not a standalone strategy
- Diagnostics: Statistics table, dispersion percent rank, gradient intensity
Disclaimer
The content provided, including all code and materials, is strictly for educational and informational purposes only. It is not intended as, and should not be interpreted as, financial advice, a recommendation to buy or sell any financial instrument, or an offer of any financial product or service. All strategies, tools, and examples discussed are provided for illustrative purposes to demonstrate coding techniques and the functionality of Pine Script within a trading context.
Any results from strategies or tools provided are hypothetical, and past performance is not indicative of future results. Trading and investing involve high risk, including the potential loss of principal, and may not be suitable for all individuals. Before making any trading decisions, please consult with a qualified financial professional to understand the risks involved.
By using this script, you acknowledge and agree that any trading decisions are made solely at your discretion and risk.
Best regards and happy trading
Chervolino.
Do not use this indicator on Heikin-Ashi, Renko, Kagi, Point-and-Figure, or Range charts, as these chart types can produce unrealistic results for signal markers and alerts.

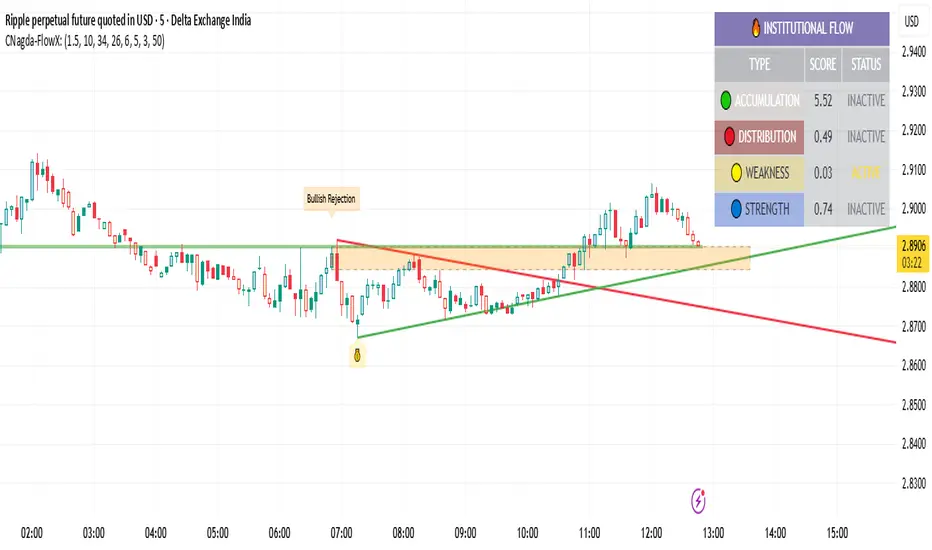
CNagda-MomentumX - Institutional FlowMomentumX is designed to empower traders with a deeper understanding of market movements by focusing on Institutional Flow and advanced market structure analytics. The core goal is to identify and visualize where major market participants are operating, and to translate these complex footprints into clear, actionable trading signals — all in real time.
Real-time institutional activity mapping
Actionable entry and exit signals based on live market structure
Intuitive dashboard and dynamic chart visuals
Fully customizable modules for trend, liquidity, and order blocks
Core Logic Design
At the heart of MomentumX lies a robust algorithmic engine built to capture and surface institutional trading behavior. By leveraging advanced mathematical models, the indicator calculates institutional volume ratios and price momentum to pinpoint aggressive moves from large participants.
Institutional Volume & Price Momentum:
Utilizes custom volume indicators and price change analysis to detect strong buying or selling pressure, filtering out retail noise.
Liquidity Grab Detection & Activity Zones:
The script identifies liquidity grabs by monitoring abrupt price sweeps at major support/resistance levels—often where institutions trigger stop hunts or reversals. All critical activity zones are automatically color-coded on the chart for instant recognition.
Dashboard Visualization:
A fully dynamic dashboard table overlays live scores for accumulation, distribution, strength, and weakness—giving traders a real-time scan of market health.
Trendline & Order Block Architecture:
The logic auto-detects pivot highs/lows to draw smart trendlines, while the order block system highlights key reversal areas and breaker zones—making market structure clear and actionable.
MomentumX is packed with high-performance modules, each engineered to simplify complex market behavior and enhance decision-making for traders:
Institutional Flow Signals:
Instantly identifies spots where institutional players drive momentum, using unique volume and price activity analytics.
Bullish/Bearish Liquidity Grab Detection:
Marks abrupt price moves that signal stop hunts or reversals, letting traders anticipate snap-backs or trend shifts.
Trendline Auto-Detection:
Smartly draws trendlines based on significant swing highs and lows, automatically adjusting as price evolves.
Order Block System (Rejection/Breaker):
Spots and highlights key reversal zones with order block rectangles, confirming rejections or breakouts at strategic levels.
Dashboard and Bar Coloring:
A clean dashboard overlay presents live market scores, while dynamic bar coloring makes trend, strength, and high-activity periods instantly visible.
User Input Toggles for Each Module:
Every major feature is fully customizable—enable or disable modules to match individual trading setups or preferences.
Scripting/Development
MomentumX’s scripting process is modular, enabling clarity, scalability, and fast optimization throughout development:
Initialization & Inputs:
Start by defining all user input options, module toggles, color settings, and calculation parameters—ensuring maximum flexibility early on.
Core Calculation Functions:
Script advanced institutional volume and price momentum algorithms. Build out swing length logic, market state filters, and activity scoring methods.
Detection Engines:
Develop and integrate engines for liquidity grabs, automated trendline detection, and order block identification—each with dedicated functions for speed and precision.
Visual Overlays & Plotting:
Implement powerful plotting logic for colored bars, score dashboards, trendlines, reversal zones, and liquidity markers—making every data point clear and actionable on the chart.
Testing Handlers:
Add diagnostic panels and debug outputs to refine calculations and assure accuracy in every market environment.
Sample Trade Setups (Usage)
Cnagda MomentumX delivers clarity for multiple trading styles by providing timely, actionable setups grounded in institutional behavior and market structure. Here’s how traders can leverage the indicator for confident decision-making:
Liquidity Grab Reversal
Enter trades around detected liquidity grabs when price sweeps major support/resistance and the dashboard signals a momentum shift.
Example: Wait for a bullish/Bearish grab near market lows/high, with institutional flow turning positive/negative—enter long/short for potential mean reversion.
Order Block Breakout
Trade breakouts when price cleanly rejects or flips key order block zones highlighted on the chart.
Example: Short at a marked breaker block after a rejection signal, confirmed by a downward institutional activity spike.
Trendline Continuation
Ride established market moves by entering on trendline confirmations plotted by the auto-detect system.
Example: Go long after a trendline retest, confirmed by a green bar color and dashboard strength score.
Dashboard Confirmation
Combine dashboard metrics (strength, accumulation, distribution) with bar color overlays for multi-factor entries.
Example: Enter trades only when all market signals align in real time for maximum probability.
For Short Entry check -- Weakness : For Long Entry Check - Strength With Other Indications
MomentumX is not just another indicator – it’s your edge for reading the market like an insider. By transparently mapping institutional flow, uncovering hidden liquidity zones, and color-coding every major structure shift, MomentumX transforms complexity into actionable clarity. Whether you’re scalping, swing trading, or investing, you’ll gain a decisive, real-time advantage on every chart.
Embrace smarter decisions, adapt to changing market conditions instantly, and join a new generation of technically empowered traders.
Customize, observe, and let the market reveal opportunities in a way you’ve never experienced before.
Happy Trading
Validated Order Blocks with Fib LevelsThis indicator automatically identifies and displays Smart Money Concepts (SMC) order blocks based on market structure breaks:
How it works:
Bearish Order Blocks (Red): Marks the last bullish candle before a swing high. The OB becomes valid when price breaks below the previous swing low, indicating institutional selling zones. Drawn from the candle's close (body top) to its low (bottom wick).
Bullish Order Blocks (Green): Marks the last bearish candle before a swing low. The OB becomes valid when price breaks above the previous swing high, indicating institutional buying zones. Drawn from the candle's high (top wick) to its close (body bottom).
Features:
Three Fibonacci retracement levels (50%, 75%, 100%) for each order block
Fib 100% faces downward on bearish OBs and upward on bullish OBs
Auto-validation: OBs are removed when price closes through them
Customizable: Adjustable swing detection, timeframe selection, and OB display limits
Optional Break of Structure (BOS) markers to show when OBs activate
Works on any timeframe with HTF analysis support
Perfect for identifying key institutional support/resistance zones and potential reversal areas.
MCros_EMA 20/50Long when the ema20 cross to ema50 up
Short when the ema20 cross to ema50 down
This is a test
MACD Forecast [Titans_Invest]MACD Forecast — The Future of MACD in Trading
The MACD has always been one of the most powerful tools in technical analysis.
But what if you could see where it’s going, instead of just reacting to what has already happened?
Introducing MACD Forecast — the natural evolution of the MACD Full , now taken to the next level. It’s the world’s first MACD designed not only to analyze the present but also to predict the future behavior of momentum.
By combining the classic MACD structure with projections powered by Linear Regression, this indicator gives traders an anticipatory, predictive view, redefining what’s possible in technical analysis.
Forget lagging indicators.
This is the smartest, most advanced, and most accurate MACD ever created.
🍟 WHY MACD FORECAST IS REVOLUTIONARY
Unlike the traditional MACD, which only reflects current and past price dynamics, the MACD Forecast uses regression-based projection models to anticipate where the MACD line, signal line, and histogram are heading.
This means traders can:
• See MACD crossovers before they happen.
• Spot trend reversals earlier than most.
• Gain an unprecedented timing advantage in both discretionary and automated trading.
In other words: this indicator lets you trade ahead of time.
🔮 FORECAST ENGINE — POWERED BY LINEAR REGRESSION
At its core, the MACD Forecast integrates Linear Regression (ta.linreg) to project the MACD’s future behavior with exceptional accuracy.
Projection Modes:
• Flat Projection: Assumes trend continuity at the current level.
• LinReg Projection: Applies linear regression across N periods to mathematically forecast momentum shifts.
This dual system offers both a conservative and adaptive view of market direction.
📐 ACCURACY WITH FULL CUSTOMIZATION
Just like the MACD Full, this new version comes with 20 customizable buy-entry conditions and 20 sell-entry conditions — now enhanced with forecast-based rules that anticipate crossovers and trend reversals.
You’re not just reacting — you’re strategizing ahead of time.
⯁ HOW TO USE MACD FORECAST❓
The MACD Forecast is built on the same foundation as the classic MACD, but with predictive capabilities.
Step 1 — Spot Predicted Crossovers:
Watch for forecasted bullish or bearish crossovers. These signals anticipate when the MACD line will cross the signal line in the future, letting you prepare trades before the move.
Step 2 — Confirm with Histogram Projection:
Use the projected histogram to validate momentum direction. A rising histogram signals strengthening bullish momentum, while a falling projection points to weakening or bearish conditions.
Step 3 — Combine with Multi-Timeframe Analysis:
Use forecasts across multiple timeframes to confirm signal strength (e.g., a 1h forecast aligned with a 4h forecast).
Step 4 — Set Entry Conditions & Automation:
Customize your buy/sell rules with the 20 forecast-based conditions and enable automation for bots or alerts.
Step 5 — Trade Ahead of the Market:
By preparing for future momentum shifts instead of reacting to the past, you’ll always stay one step ahead of lagging traders.
🤖 BUILT FOR AUTOMATION AND BOTS 🤖
Whether for manual trading, quantitative strategies, or advanced algorithms, the MACD Forecast was designed to integrate seamlessly with automated systems.
With predictive logic at its core, your strategies can finally react to what’s coming, not just what already happened.
🥇 WHY THIS INDICATOR IS UNIQUE 🥇
• World’s first MACD with Linear Regression Forecasting
• Predictive Crossovers (before they appear on the chart)
• Maximum flexibility with Long & Short combinations — 20+ fully configurable conditions for tailor-made strategies
• Fully automatable for quantitative systems and advanced bots
This isn’t just an update.
It’s the final evolution of the MACD.
______________________________________________________
🔹 CONDITIONS TO BUY 📈
______________________________________________________
• Signal Validity: The signal will remain valid for X bars .
• Signal Sequence: Configurable as AND or OR .
🔹 MACD > Signal Smoothing
🔹 MACD < Signal Smoothing
🔹 Histogram > 0
🔹 Histogram < 0
🔹 Histogram Positive
🔹 Histogram Negative
🔹 MACD > 0
🔹 MACD < 0
🔹 Signal > 0
🔹 Signal < 0
🔹 MACD > Histogram
🔹 MACD < Histogram
🔹 Signal > Histogram
🔹 Signal < Histogram
🔹 MACD (Crossover) Signal
🔹 MACD (Crossunder) Signal
🔹 MACD (Crossover) 0
🔹 MACD (Crossunder) 0
🔹 Signal (Crossover) 0
🔹 Signal (Crossunder) 0
🔮 MACD (Crossover) Signal Forecast
🔮 MACD (Crossunder) Signal Forecast
______________________________________________________
______________________________________________________
🔸 CONDITIONS TO SELL 📉
______________________________________________________
• Signal Validity: The signal will remain valid for X bars .
• Signal Sequence: Configurable as AND or OR .
🔸 MACD > Signal Smoothing
🔸 MACD < Signal Smoothing
🔸 Histogram > 0
🔸 Histogram < 0
🔸 Histogram Positive
🔸 Histogram Negative
🔸 MACD > 0
🔸 MACD < 0
🔸 Signal > 0
🔸 Signal < 0
🔸 MACD > Histogram
🔸 MACD < Histogram
🔸 Signal > Histogram
🔸 Signal < Histogram
🔸 MACD (Crossover) Signal
🔸 MACD (Crossunder) Signal
🔸 MACD (Crossover) 0
🔸 MACD (Crossunder) 0
🔸 Signal (Crossover) 0
🔸 Signal (Crossunder) 0
🔮 MACD (Crossover) Signal Forecast
🔮 MACD (Crossunder) Signal Forecast
______________________________________________________
______________________________________________________
🔮 Linear Regression Function 🔮
______________________________________________________
• Our indicator includes MACD forecasts powered by linear regression.
Forecast Types:
• Flat: Assumes prices will stay the same.
• Linreg: Makes a 'Linear Regression' forecast for n periods.
Technical Information:
• Function: ta.linreg()
Parameters:
• source: Source price series.
• length: Number of bars (period).
• offset : Offset.
• return: Linear regression curve.
______________________________________________________
______________________________________________________
⯁ UNIQUE FEATURES
______________________________________________________
Linear Regression: (Forecast)
Signal Validity: The signal will remain valid for X bars
Signal Sequence: Configurable as AND/OR
Table of Conditions: BUY/SELL
Conditions Label: BUY/SELL
Plot Labels in the graph above: BUY/SELL
Automate & Monitor Signals/Alerts: BUY/SELL
Linear Regression (Forecast)
Signal Validity: The signal will remain valid for X bars
Signal Sequence: Configurable as AND/OR
Table of Conditions: BUY/SELL
Conditions Label: BUY/SELL
Plot Labels in the graph above: BUY/SELL
Automate & Monitor Signals/Alerts: BUY/SELL
______________________________________________________
📜 SCRIPT : MACD Forecast
🎴 Art by : @Titans_Invest & @DiFlip
👨💻 Dev by : @Titans_Invest & @DiFlip
🎑 Titans Invest — The Wizards Without Gloves 🧤
✨ Enjoy!
______________________________________________________
o Mission 🗺
• Inspire Traders to manifest Magic in the Market.
o Vision 𐓏
• To elevate collective Energy 𐓷𐓏
🎗️ In memory of João Guilherme — your light will live on forever.

HTF Candle Highs and Lows with Labels + High Probability Signals█ OVERVIEW
This indicator overlays Weekly, Daily, and H4 High/Low levels directly onto your chart, allowing traders to visualize key support and resistance zones from higher timeframes. It also includes high probability breakout signals that appear one candle after a confirmed breakout above or below these levels, filtered by volume and candle strength.
Use this tool to identify breakout opportunities with greater confidence and clarity.
█ FEATURES
• Plots Weekly, Daily, and H4 High and Low levels using request.security. • Customizable line colors, widths, and label sizes. • Toggle visibility for each timeframe independently. • Signals appear one candle after a confirmed breakout: • Bullish: Close above HTF High, strong candle, high volume. • Bearish: Close below HTF Low, strong candle, high volume. • Signal shapes match the color of the broken level for visual clarity.
█ HOW TO USE
1 — Enable the timeframes you want to track using the input toggles. 2 — Watch for triangle-shaped signals: • Upward triangle = Bullish breakout. • Downward triangle = Bearish breakout. 3 — Confirm the breakout: • Candle closes beyond the HTF level by at least 0.1%. • Candle body shows momentum (close > open for bullish, close < open for bearish). • Volume exceeds 20-period average. 4 — Enter trade on the candle after the signal. 5 — Use the HTF level as a reference for stop-loss placement. 6 — Combine with other indicators (e.g., RSI, EMA) for confluence.
█ LIMITATIONS
• Signals may lag by one candle due to confirmation logic. • Not optimized for low-volume assets or illiquid markets. • Best used in trending environments; avoid during consolidation. • Does not include automatic alerts (can be added manually).
█ BEST PRACTICES
• Use on H1 or higher timeframes for cleaner signals. • Avoid trading during news events or low volatility. • Backtest thoroughly before live trading. • Adjust breakout percentage and volume filter based on asset volatility. • Maintain a trading journal to track performance.

Combined SMA with Murrey Math and Fixed Fractal Bands "Combined SMA with Murrey Math and Fixed Fractal Bands" , overlaying a Simple Moving Average (SMA), Murrey Math (MM) bands, and fixed fractal bands on a price chart. Here's a brief description of its functionality:Inputs:SMA Length: Configurable period for the SMA (default: 180 bars).
Resolution: Optional custom timeframe for data.
Frame Size for MM: Lookback period for Murrey Math calculations (default: 180 bars, adjustable via multiplier).
Ignore Wicks: Option to use open/close prices instead of high/low for MM calculations.
Fixed Fractal Size: Fixed distance in points for fractal bands (default: 1.22).
Shade 3/8-5/8 Overlap: Option to highlight overlapping regions between SMA-centered and absolute MM bands.
Data Source:Uses open, close, high, and low prices from the specified ticker and timeframe.
Optionally ignores wicks (high/low) for MM calculations, using max/min of open/close instead.
SMA Calculation:Computes a Simple Moving Average (SMA) based on the closing price and user-defined length.
Murrey Math Bands:Absolute MM Bands: Calculated using a dynamic range based on the highest/lowest prices over a lookback period, scaled logarithmically to create 13 levels (from -3/8 to +3/8, with 8/8 as the midpoint). These adapt to price action.
SMA-Centered MM Bands: Constructs MM bands relative to the SMA, with levels (0/8 to 8/8) spaced by a calculated increment derived from the absolute MM range.
Colors bands dynamically (green for bullish, red for bearish, gray for neutral) based on changes in the 4/8 level or increment, with labels indicating "Higher," "Lower," or "Same" states.
Fixed Fractal Bands:Plots six fixed-distance bands (±1, ±2, ±3) around the SMA, using a user-defined point value (default: 1.22).
Overlaps and Shading:Detects overlaps between SMA-centered and absolute MM bands at key levels (7/8-8/8, 0/8-1/8, and optionally 3/8-5/8).
Shades overlapping regions with distinct colors (red for 7/8-8/8, green for 0/8-1/8, blue for 3/8-5/8).
Fills specific SMA-centered MM regions (3/8-5/8, 0/8-1/8, 7/8-8/8) for visual emphasis.
Visualization:Plots SMA-centered MM bands, absolute MM bands, and fixed fractal bands as stepped lines with varying colors and transparency.
Displays a table at the bottom-right showing the current MM increment value.
Adds labels when the 4/8 level or increment changes, indicating trend direction.
In summary, this indicator combines a user-defined SMA with Murrey Math bands (both absolute and SMA-centered) and fixed fractal bands to provide a multi-level support/resistance framework. It highlights dynamic price levels, trend direction, and key overlaps, aiding traders in identifying potential reversal or consolidation zones.
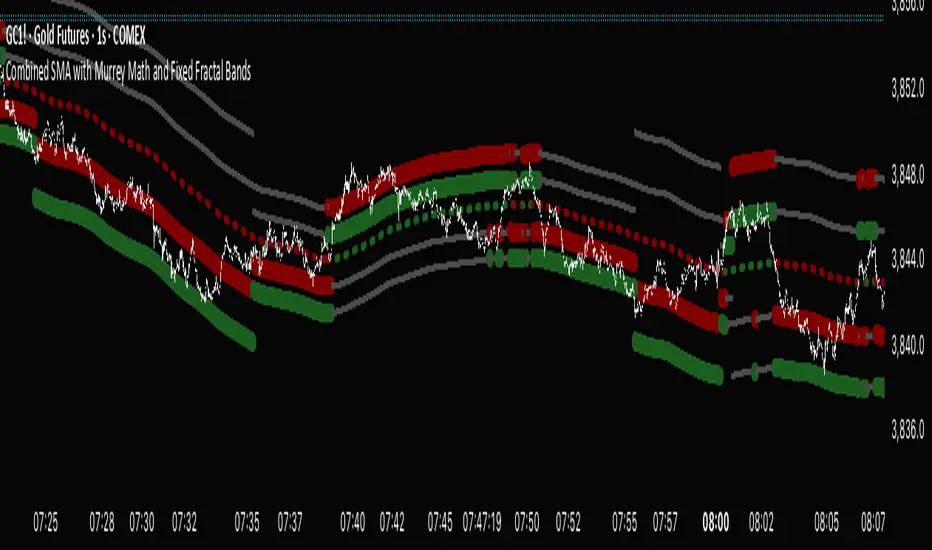
RXTrend█ OVERVIEW
The "RXTrend" indicator is a technical analysis tool based on a unique approach to trend identification using RSI values from overbought and oversold zones. Designed for traders seeking a precise tool to identify key market levels and trend direction, the indicator offers flexible settings, dynamic trend lines, candlestick coloring, and buy/sell signals, supported by alerts for key events.
█ CONCEPTS
"RXTrend" leverages the Relative Strength Index (RSI) to identify overbought and oversold zones, which are often significant areas on the chart due to potentially higher volume, increased volatility, or acting as pivot points. To address this, I created an indicator that uses RSI values from these zones, mapping them to price levels to determine the trend. Additionally, for a clearer market picture, boxes are added to highlight overbought and oversold zones on the chart, and candlestick coloring is based on the direction of the RSI moving average. This provides further confirmation of the trend direction and identifies potential correction or reversal points. The indicator is universal and works across all markets (stocks, forex, cryptocurrencies) and timeframes.
█ FEATURES
- RSI Calculation: Calculates RSI based on the closing price over a specified period, with a default length of 14.
- Trend Line: A smoothed trend line based on mapping RSI values from overbought (for downtrends) or oversold (for uptrends) zones to price levels. RSI values are transformed into prices using the price range from a selected period (default: 50 bars) and then smoothed to form the trend line. The line changes color based on the trend direction (blue for uptrend, orange for downtrend).
- Candlestick Coloring: Option to color candles based on the direction of the RSI moving average (RSI MA). Candle colors align with the trend and box colors (blue for uptrend, orange for downtrend, gray for neutral).
- Overbought and Oversold Zones: Identifies overbought (RSI > OB) and oversold (RSI < OS) levels, drawing dynamic boxes on the price chart to reflect these zones. Boxes update in real-time, adjusting to new highs and lows.
- Buy and Sell Signals: Generates buy signals (blue "Buy" labels) when the price crosses above the smoothed oversold line and sell signals (orange "Sell" labels) when the price crosses below the smoothed overbought line.
- Shadow Fill: Option to fill the space between the trend line and price (HL2) with adjustable transparency, aiding visual trend assessment.
Alerts: Built-in alerts for:
- Buy and sell signals.
- Appearance of new overbought/oversold boxes.
- RSI MA direction change (candle color change to uptrend or downtrend).
Customization: Allows adjustment of RSI length, overbought/oversold levels, smoothing period, colors, box and label transparency, and the option to keep boxes after RSI returns to normal.
█ HOW TO USE
Add to Chart: Apply the indicator to your TradingView chart via the Pine Editor or Indicators menu.
Configure Settings:
RSI Settings:
- RSI Length: Sets the RSI calculation period (default: 14).
- Overbought Level (OB): Sets the overbought threshold (default: 70).
- Oversold Level (OS): Sets the oversold threshold (default: 30).
Price Settings:
- Price Range Lookback: Defines the period for calculating the price range (default: 50).
Candle Coloring:
- Color Candles: Enables/disables candle coloring based on RSI MA direction.
- RSI MA Length: Sets the RSI moving average period (default: 21).
Smoothing Settings:
- Smoothing Length: Degree of trend line smoothing (default: 5).
Colors:
- Trend Colors: Customize colors for uptrend (default: blue), downtrend (default: orange), and shadow fill.
Box Settings:
- Box Transparency: Adjusts box transparency (0-100).
- Box Colors: Sets colors for overbought (orange) and oversold (blue) zones.
- Keep Boxes: Determines if boxes remain after RSI returns to normal.
Signals:
- Show Buy/Sell Signals: Enables/disables signal label display.
- Label Transparency: Adjusts signal label transparency.
Interpreting Signals:
- Trend Line: Shows market direction (blue for uptrend, orange for downtrend).
- Buy Signals: Blue "Buy" label appears when the price crosses above the smoothed oversold line, signaling a potential uptrend.
- Sell Signals: Orange "Sell" label appears when the price crosses below the smoothed overbought line, signaling a potential downtrend.
- Overbought/Oversold Boxes: Orange boxes indicate overbought zones (RSI > OB), blue boxes indicate oversold zones (RSI < OS). Boxes expand dynamically in real-time.
- Candlestick Coloring: Candle colors align with the trend and box colors, reflecting RSI MA direction.
- Alerts: Set up alerts in TradingView for buy/sell signals, new overbought/oversold boxes, or RSI MA direction changes.
- Combining with Other Tools: Use the indicator alongside support/resistance levels, Fair Value Gaps (FVG), or other indicators to confirm signals.
█ APPLICATIONS
The "RXTrend" indicator is designed to identify key market zones and trend direction, making it useful for trend-following and reversal strategies. It enables:
- Trend Confirmation: Candlestick coloring and the trend line help assess the dominant market direction, supporting entry or exit decisions. The trend line can act as a significant support/resistance level, and a price bounce from it may provide a good entry point, especially when confirmed by Fibonacci levels. Additionally, the appearance of overbought/oversold boxes combined with a change in candle color (RSI MA direction) may indicate an impending correction. This allows analysis of potential market overextension and correction endings, enabling multiple entries within a trend.
- Overbought and Oversold Zone Identification: Boxes highlight potential reversal or correction points, especially when combined with support/resistance levels or FVG.
- Signal-Based Strategies: Buy and sell signals can be used as entry points in a trend or as warnings of potential reversals.
█ NOTES
- The indicator is universal and works across all markets and timeframes due to its RSI-based and price-mapping logic.
- Adjust settings (e.g., RSI length, OB/OS levels, smoothing) to suit your trading style and timeframe.
- Use in conjunction with other technical analysis tools to enhance signal accuracy.

MSRanges📖 Market Structure with Ranges —
What this script does
This indicator highlights market structure on any symbol or timeframe. It automatically marks:
Swing points: Higher High (HH), Lower High (LH), Higher Low (HL), Lower Low (LL).
Break of Structure (BOS) and optional Change of Character (CHoCH) events.
Price ranges: each new swing label shows the difference from the last swing in price units (e.g. HH (54.8) or LL (-169.5)).
This lets you see at a glance whether the market is trending, consolidating, or shifting character.
How it works
Pivot detection
Uses TradingView’s ta.pivothigh / ta.pivotlow with a user-set Swing Length.
A pivot is confirmed only after the right-hand bars pass, so labels appear with a delay equal to Swing Length.
Swing classification
Each new pivot is compared with the previous pivot:
If a new high is higher than the last → HH.
If a new high is lower → LH.
If a new low is higher → HL.
If a new low is lower → LL.
Break of Structure (BOS)
A BOS is drawn when price closes (or wicks, depending on settings) beyond a previous swing.
The first BOS against trend can optionally be labelled CHoCH.
Range calculation
When a new swing is confirmed, the script prints the difference between that pivot and the previous swing.
Example: HL at 24,600 → HH at 24,655 → label shows HH (55).
Inputs & customization
Swing Length: bars left/right used to confirm pivots. Larger = fewer, more reliable swings; smaller = more signals, more noise.
BOS Confirmation: choose whether a BOS requires a full candle close or just a wick beyond the level.
Show CHoCH: toggle whether the first countertrend BOS is renamed CHoCH.
Show Swing Points: show/hide HH / LH / HL / LL labels.
BOS Style Settings: customize color, line style, and width.
How to use in practice
Trend identification:
Uptrend → repeating HL → HH sequence.
Downtrend → repeating LH → LL.
Breakout confirmation:
A BOS confirms continuation. Retests of BOS lines often act as support/resistance.
Reversal watch:
A CHoCH can signal possible trend shift. Wait for confirmation from price action or higher timeframe structure.
Range analysis:
The range numbers help compare move sizes. If swings shrink, market may be consolidating; if they expand, volatility is rising.
Best practices
Combine with higher timeframe analysis: use HTF trend, then refine entries on LTF.
Always confirm with other tools (volume, RSI, order flow) before trading.
Adjust Swing Length for the symbol and timeframe you trade.
Use risk management — never rely on a single indicator.
Technical notes
Pivots are not predictive — they appear only after confirmation. This avoids repainting but introduces lag.
Many labels/lines can impact chart performance; the script sets sensible max_labels_count and max_lines_count.
Designed for clarity, not signals. It does not issue buy/sell calls.
Disclaimer
This script is for educational purposes only . It is not financial advice and should not be used as a sole basis for trading decisions. Past performance of any method or indicator does not guarantee future results. Always test on demo accounts and apply proper risk management.
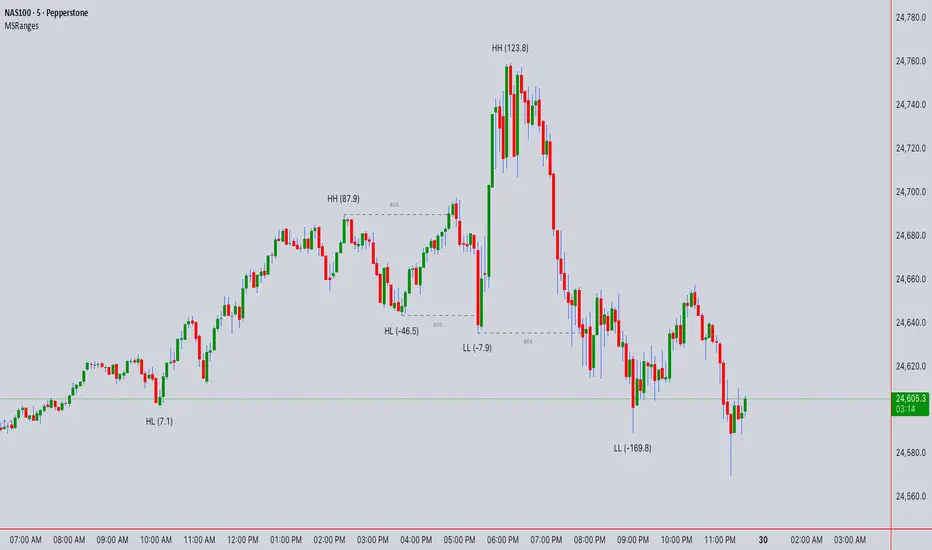
Global M2 (level / YoY) + correlation tableCalculates Global M2 with 11 weeks offset and then plots calculated Y-o-Y change of this M2. Inspired by GMI

Price Action [False Break+BreakOut] This indicator is designed to analyze Price Action with a focus on identifying Pivot Points and detecting Breakout and False Break signals.
Key Features:
Pivot Point Detection
Identifies Pivot High and Pivot Low points
Classifies Pivot Points into:
Higher High (HH)
Lower High (LH)
Higher Low (HL)
Lower Low (LL)
Visual Display Options
Pivot point markers (triangles)
Price values at pivot points
Support/Resistance level lines
Fractal Chaos Channel display
Average of Pivot High/Low
False Break Detection
Detects False Break signals
Customizable validation period (1-10 bars)
Option to include candle shadows in engulfing detection
Displays "FalseB!!" labels when detected
Color-coded signals (red for false break up, green for false break down)
Breakout Signals
Shows Breakout (⬆️) and Breakdown (⬇️) signals
Alert conditions for all signal types
Tracks recent breakout/breakdown levels
Main Configuration Settings:
Source data and length parameters for pivot detection
Selective display of different pivot types
Maximum bars to display
Support/Resistance level extension length
Text size customization
Technical Implementation:
Uses ta.pivothigh() and ta.pivotlow() for pivot detection
Implements bar counting for level persistence
Engulfing pattern detection for false breaks
Color-coded visual elements (teal for HH/HL, red for LH/LL)
Comprehensive alert system
Usage:
This indicator is ideal for traders using Price Action strategies, helping to identify trend reversal points, key Support/Resistance levels, and potential genuine/false breakout signals for better trade entries and exits.
