Average Trend with Deviation Bands v2TL;DR: An average based trend incl. micro trend spotting and multiple display options.
This script is basically an update of my "Average Trend with Deviation Bands" script. I made the following changes:
Not an overlay anymore - The amount of drawn lines makes the chart pretty messy. That's why I moved it to a pane. If you preferred the overlay you can use my "Average Trend with Deviation Bands" script. *This is also the reason why I publish this script instead of updating the existing one.
I added an EMA to represent the price movement instead of candles
I added a signal (SMA) to spot micro trends and early entry/exit signals
I added the option to switch between a "line view" which shows the average trend and deviation bands and an "oscillator view" which shows an oscillator and histogram (MACD style)
General usage:
1. The white line is the average trend (which is an average of the last N bars open, close, high, low price).
2. Bands around the average trend are standard deviations which can be adjusted in the options menu and are only visible in "lines view". Basically they are like the clouds in the Ichimoku Cloud indicator - In big deviation bands the price movement needs more "power" to break through the average trend and vice versa.
3. Indicator line (blue line) - This is the EMA which represents the price. Crossing the average trend from below indicates an uptrend and vice versa (crossing from above indicates a down trend).
4. Signal line (red line) - This is a smoothed version of the indicator line which can be used to predict the movement of the price when crossed by the indicator line (like at MACD and many other indicators).
Oscillator usage:
When switched to "oscillator view" the indicator line oscillates around a zero line which can be seen as the average trend. The usage is basically the same as described above. However there is also the histogram which shows the difference between the indicator and signal. Of course the histogram can be deactivated. Additionally a color filling can be added to easily spot entry/exit signals.
As always: Code is free do whatever you like. If you have any questions/comments/etc. just drop it in the comment section.
Moving_average

T3 OscillatorTL;DR - An Oscillator based on T3 moving average
The T3 moving average is a well known moving average created by Tim TIllson. Oscillator values are created by using the simple formula "source (close by default) - T3 moving average". Tim Tillson used a "volume factor" of 0.7 in his original T3 calculation. I changed this value to 0.618 and added the option to change it if needed/wanted. I also added alarms for zero line crossing upwards and downward, a smoothing option and custom time frames.
Compared to other oscillators like TSI, MACD etc. I observed better signals, especially in trending market situations, from the T3 oscillator (I tested Forex and Crypto).
Usage is simple: If the oscillator is above 0 it indicates a bearish trend. If below 0 it indicates a bullish trend. -> Really simple to use. However it can also be used to determine micro trends and reversals when combined with price action analysis. To keeps things simple I have not added a moving average like many other oscillators because I think it is confusing and does not help (in this particular case).
P.S. I haven't found a T3 oscillator on Trading View. Code is free - do whatever you want with it ;)

Fetch ATR + MA StrategyA trend following indicator that allows traders/investors to enter trades for the long term, as it is mainly tested on the daily chart. The indicator fires off buy and sell signals. The sell signals can be turned off as trader can decide to use this indicator for long term buy signals. The buy signals are indicated by the green diamonds, and the red diamonds show the points on then chart where the asset can be sold.
The indicator uses a couple indicators in order to generate the buy signals:
- ADX
- ATR
- Moving Average of ATR
- 50 SMA
- 200 SMA
The buy signal is generated at the cross overs of the 50 and 200 SMA's while the ATR is lower than then Moving Average of the ATR. The buy signal is fired when these conditions are met and if the ADX is lower than 30.
The thought process is as follows:
When the ATR is lower than its moving average, the price should be in a low volatilty environment. An ADX between 25 and 50 signals a Strong trend. Every value below 25 is an absent or weak trend. So entering a trade when the volatilty is still low but increasing, you'll be entering a trade at the start of a new uptrend. This mechanism also filters out lots of false signals of the simple cross overs.
The sell signals are fired every time the 50 SMA drops below the 200 SMA.

Trend Reversal Probability CalculatorThe "Trend Reversal Probability Calculator" is a TradingView indicator that calculates the probability of a trend reversal based on the crossover of multiple moving averages and the rate of change (ROC) of their slopes. This indicator is designed to help traders identify potential trend reversals by providing signals when the short-term moving averages start to slope in the opposite direction of the long-term moving average.
To use the indicator, simply add it to your TradingView chart and adjust the input parameters according to your preferences. The input parameters include the length of the moving averages, the ROC length (trend sensitivity), and the reversal sensitivity (signal percentage).
The indicator calculates the ROC of the moving averages and determines if the short-term moving averages are sloping in the opposite direction of the long-term moving average. The number of short-term moving averages that meet this condition is then counted, and the probability of a trend reversal is calculated based on the percentage of short-term moving averages that meet this condition.
When the probability of a trend reversal is high, a bullish or bearish signal is generated, depending on the direction of the reversal. The bullish signal is generated when the short-term moving averages start to slope upward, and the bearish signal is generated when the short-term moving averages start to slope downward.
Traders can use the "Trend Reversal Probability Calculator" to identify potential trend reversals and adjust their trading strategies accordingly. It is important to note that this indicator is not a guarantee of a trend reversal and should be used in conjunction with other technical analysis tools to make informed trading decisions.

FRAMA & CPMA Strategy [CSM]The script is an advanced technical analysis tool specifically designed for trading in financial markets, with a particular focus on the BankNifty market. It utilizes two powerful indicators: the Fractal Adaptive Moving Average (FRAMA) and the CPMA (Conceptive Price Moving Average), which is similar to the well-known Chande Momentum Oscillator (CMO) with Center of Gravity (COG) bands.
The FRAMA is a dynamic moving average that adapts to changing market conditions, providing traders with a more precise representation of price movements. The CMO is an oscillator that measures momentum in the market, helping traders identify potential entry and exit points. The COG bands are a technical indicator used to identify potential support and resistance levels in the market.
Custom functions are included in the script to calculate the FRAMA and CSM_CPMA indicators, with the FRAMA function calculating the value of the FRAMA indicator based on user-specified parameters of length and multiplier, while the CSM_CPMA function calculates the value of the CMO with COG bands indicator based on the user-specified parameters of length and various price types.
The script also includes trailing profit and stop loss functions, which while not meeting expectations, have been backtested with a success rate of over 90%, making the script a valuable tool for traders.
Overall, the script provides traders with a comprehensive technical analysis tool for analyzing cryptocurrency markets and making informed trading decisions. Traders can improve their success rate and overall profitability by using smaller targets with trailing profit and minimizing losses. Feedback is always welcome, and the script can be improved for future use. Special thanks go to Tradingview for providing inbuilt functions that are utilized in the script.

Conceptive Price Moving Average [CSM]The Conceptive Price Moving Average (CPMA) is a technical indicator designed to provide a more accurate moving average of the price by using the average of various price types, such as open, close, high, low, etc. The CPMA can help to smooth out the noise and provide a clearer picture of the overall trend by taking the average of the last 3 candles for each price type and then calculating the average of those averages.
To use the CPMA for generating buy/sell signals, you can look for crossovers of the CPMA and other commonly used moving averages, such as the 9-period EMA, 20-period EMA, 50-period EMA, 100-period EMA, and 200-period EMA, which are also plotted on the chart. When the CPMA crosses above a shorter-term moving average, such as the 9-period EMA or 20-period EMA, it can indicate a potential buy opportunity, while when the CPMA crosses below a shorter-term moving average, it can indicate a potential sell opportunity.
Based on my analysis of BankNifty and Nifty, I have found that the CPMA works best at a length of 21, showing good resistance and support for stocks. Therefore, I recommend using a length of 21 when using the CPMA for generating buy/sell signals.

FRAMA and Candlestick Patterns [CSM]FRAMA (Fractal Adaptive Moving Average) is a technical analysis indicator that adapts its smoothing period according to the market's volatility, allowing it to provide accurate signals in all market conditions. This indicator script plots the FRAMA on a chart and generates buy and sell signals based on the FRAMA and candlestick patterns. It also includes an option to filter signals based on bullish and bearish engulfing patterns.
To detect candlestick patterns, the script imports the "BankNifty_CSM" library from the creator's public library on TradingView. The FRAMA calculation is done using a loop that iterates over the last "length" number of bars, with the smoothing factor adjusted based on the "fracDim" parameter.
The buy and sell signals are generated based on the position of the current price relative to the FRAMA line. If the "engulfing" parameter is set to true, the signals are further filtered based on bullish and bearish engulfing patterns.
Overall, this script combines various technical indicators and candlestick pattern recognition to provide a complete trading strategy. However, as with any trading strategy, it should be thoroughly backtested and evaluated before using it in a live trading environment.

Moving Averages SuiteThe Moving Averages Suite is a powerful technical analysis tool that provides traders with unparalleled control over five different moving averages and two special moving average indexes. This suite is designed to provide traders with a comprehensive understanding of market trends and help them make more informed trading decisions.
By default, the Moving Averages Suite displays two special moving average indexes that are made from the moving averages within the suite. These special moving average indexes are specially weighted indexes that are designed to provide a more accurate representation of market trends. The first index is the Moving Average Directional Index (MADI), which measures the strength of the trend in the market. The second index is the Moving Average Oscillator Index (MAOI), which measures the momentum of the trend in the market.
In addition to these special indexes, traders can enable five different moving averages within the suite. These moving averages include the TEMA, HMA, EMA, VWMA, and SMA. Each moving average has a specific purpose and is used to provide traders with a unique perspective on market trends.
The Triple Exponential Moving Average (TEMA) is designed to reduce the lag time associated with traditional moving averages. This moving average places more weight on recent price data, providing traders with a more accurate representation of current market trends.
The Hull Moving Average (HMA) is another moving average that is designed to reduce lag time. This moving average uses weighted averages to provide traders with a more accurate representation of market trends.
The Exponential Moving Average (EMA) is a popular moving average that is used to identify trends in the market. This moving average places more weight on recent price data, providing traders with a more accurate representation of current market trends.
The Volume Weighted Moving Average (VWMA) is another moving average that is used to identify trends in the market. This moving average places more weight on periods of high volume, providing traders with a more accurate representation of market trends during high volume periods.
The Simple Moving Average (SMA) is a widely used moving average that provides traders with a simple and easy-to-understand representation of market trends.
The Moving Averages Suite is a powerful technical analysis tool that provides traders with unparalleled control over five different moving averages and two special moving average indexes. Each moving average within the suite is designed to provide traders with a unique perspective on market trends, allowing them to make more informed trading decisions. Traders who are looking to gain a comprehensive understanding of market trends should consider using the Moving Averages Suite in their trading strategies.

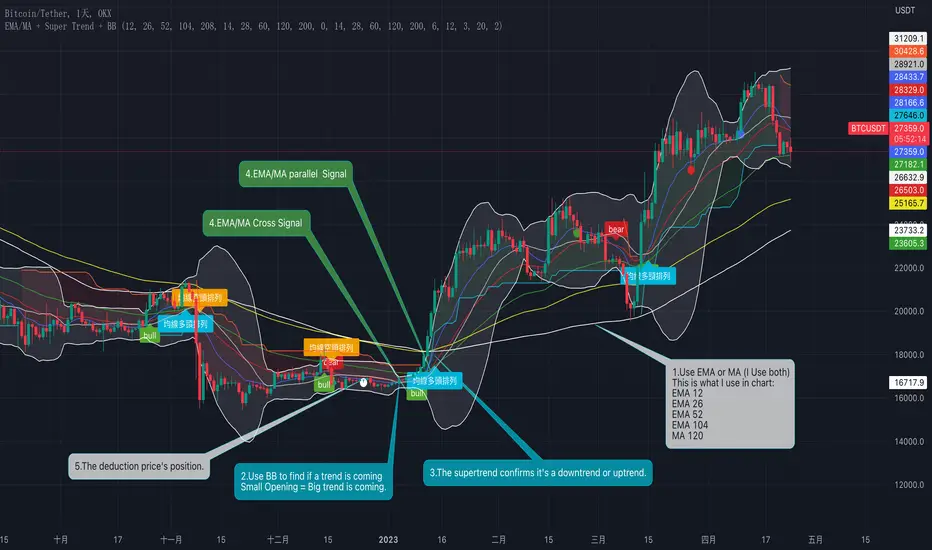
EMA/MA + Super Trend + BBHere is what this indicator does :
1. EMA+SMA moving average system
1. EMA moving average (five in total)
2. SMA moving average (five in total)
3. deduction price
4. EMA/SMA cross prompt: EMA 12//26 cross, or MA14/MA28 cross
5. EMA/SMA parallel prompt: prompt when EMA 12/26/52 is in parallel, or prompt when MA14/MA28/MA 60 is in parallel
Why use EMA 12/26 cross prompt, and MA14/MA28 cross prompt?
Because I backtested BTC based on the winning rate of EMA and MA crossover, its winning rate is higher.
Why use parallel prompt?
Because after the moving averages cross, they will start to be in parallel mode. If you don't see the moving averages be in parallel, it will be a warning sign.
2. Super Trend:
Super Trend is used to assist in judging the current trend.
3. BB Bollinger Bands:
Use the size of the opening to judge whether the major trend is coming.
How to use this indicator? (see chart)
1. Choose EMA or MA, or mix them at the same time
2. Use the Bollinger Bands to find the potential big trend is coming
3. Confirm the trend with Supertrend
4. Use moving averages to confirm crossover and long or short moving average parallel signals
5. The deduction price is used to judge whether the moving average continues to go up or down
Why to do this, why mix them?
1. When the opening of the Bollinger band is very small, it means that the trend is coming
2. Supertrend can help us confirm whether it is an upward or downward trend
3. The crossing and parallel of moving averages can be used as entry trading signals
4. The deduction price is used to judge whether the moving average continues to go up or down
This's why there is a mix of Moving average, Supertrend and BB.
這是這個指標的功能(instructions in Chinese):
一、EMA+SMA 均線系統
1、EMA 均線(共五條)
2、SMA 均線(共五條)
3、抵扣價:可以五條均線的折扣價位置
4、EMA/SMA 交叉提示:EMA 12/EMA 26交叉 或 MA14/MA28 交叉
5、EMA/SMA 排列提示:EMA 12/26/52 呈排列時提示,或 MA14/MA28/MA 60 排列時提示
交叉定義:
二、Super Trend 超級趨勢:
Super Trend 用來輔助判斷當前趨勢。
三、BB 布林帶:
藉由開口大小判斷大趨勢是否即將來臨。
如何使用這個指標?(見圖表說明)
1、選擇EMA或MA均線,或同時混合使用它們
2、用布林帶尋找潛在大趨勢即將來臨
3、用Supertrend 確認趨勢
4、用均線確認交叉與多頭或空頭均線排列訊號
5、抵扣價用來判斷均線是否持續向上或向下
為什麼要這麼做?
1、當布林帶的開口很小時,說明趨勢即將來臨
2、Supertrend 可以幫助我們確認是向上還是向下趨勢
3、均線的交叉與排列可以作為進場交易訊號
4、抵扣價則用來判斷均線是否持續向上或向下
這就是為什麼要混合使用這幾個指標的原因。
Crypto Uptrend Script + Pullback//Volume CandlesDescription: his is an adaption of my Pullback candle - This works on all timeframes and Markets (Forex//Stocks//)
Crypto Uptrend Script with Pullback Candle allows traders to get into a trend when the price is at end of a pullback and entering a balance phase in the market (works on all markets). The use of Moving averages to help identify a Trends and the use of Key levels to help traders be aware of where strong areas are in the market.
This script can work really well in Crypto Bull Runs when used on HTF and with confluences
The script has key support and resistance zones which are made up of quarterly data. Price reacts to these areas but patience is required as price will take time to come into these areas
I have updated the Pullback Candle with the use of Volume to filter out the weak Pullback Candles -
There are new candles to the script.
The First candle is the Bullish Volume Candle - This candle is set to a multiplier of 2x with a crossover of 50/100 on Volume - this then will paint a purple candle.
Uses of the Bullish Volume Candle:
Breakthrough of key areas // special chart patterns
Rejection of key areas
End of a impulse wave (Profit Takers)
The second candle is a Hammer - I prefer using the Hammers on Higher Timeframes however they do work on all timeframes. .
The third candle is a Exhaustion of impulse downward move.
Uses of this candle - can denote a new trend but has to be with confluence to a demand area // support area or with any use of technical analysis - using this alone is not advised
The fourth candle is a indecision candle in the shape of a Doji - this candle can help identify if the trend is in a continuation or a reversal
This script can work really well in Crypto Bull Runs
Disclaimer: There will be Pullbacks with High Volume (Breakouts) and not go the way as intended but this script is to allow traders to get into trends at good price levels. The script can paint signals in areas where price is too expensive so please do your own due diligence on the markets as this script is to help get into good areas of price
Please leave a thumbs up if you like this script and message me for information on how to use the script.

Seer's HutThis is a strategy based on Exponential Moving Averages or Volume Weighted Moving Averages against Adaptive fib resistance / support level and profit percentage which can be definetly defined by user and targeting small profits(profits will be raised by leverages).
In this strategy, there are predefined values which are collected one by one with statistical background and backtests. This gives an advantage to see which ratios are working better for each symbol. Also this statistics are re-evaluated monthly and if there is a need they are going to be changed with the help of libraries. Also IT IS RECOMMENDED TO USE IN DAILY INTERVAL GRAPHICS!!!!
When we deep dive to strategy, it is based on profit percentages. it is similar to the MOST system. MOST only changes the way with default value of %2. But this hardcoded strategy is not working well with each Symbol.
So this is the point where DC and ADR Statistics are involved.
For Ex. while BTC is suits well with %2, it does not do wonders for RSR or RUNE which is 4-5% for each.
There is 3 options for setting the statistical usage of this indicator.
1. Auto calculated based on 1000 days of ADR and DC
imgur.com
2. Using Library where statistical values are stored.
imgur.com
3. User-defined values used. Yeah you read it right. Fully on-demand changes are supported. Which gives freedom to users for setup their own Adaptive FIB and Profit Percentages.
imgur.com
Based on this 3 options, TP and SL points are calculated on bar closures. Strategy Orders are also shown / raised with the closures.
Ok, system calculates these values but how to read / use them. what is this strategy based on ?
This strategy is mostly looking for minimizing the LOSS in case of any stop. So because of this, in each TP, system gives order signal to close half of the remaining open position.
There are 7 type of orders
OL : Open Long (Close Short and Open Long if in position)
CL 50 : Close Long - %50 of Open Position
CL 100 : Close Long - Close all position
OS : Open Short (Close Long and Open Short if in position)
CL 50 : Close Short - %50 of Open Position
CL 100 : Close Short - Close all position
TP5 : Highest TP reached. Close all position.
Script checks cross of EMA / VWMA and adFib to decide open a position. In reversal / crosses, adFib line had been set to defined Fib. Percentage (FP) level.
For creating the TP points, Profit Percentage (PP) parameter had been used which I briefly introduce at the beginning with the options.
One important topic about this strategy, it is not stacking / pyramiding the positions. Which means, it always calculate one way position. For example we are in the long position after OL signal.
We reached TP values and take profits. Later on due to FP crossing EMA, OS order signal given. This means you have to close all long position and open short position.
But beware. These calculated points are based on given values or calculated regarding to average ADR / DC ratings. For supporting strategy, several methods also had been included in the options.
imgur.com
These are:
1. MA plotting (Optional 4 EMA, 1WMA) - checking for Golden and Death Cross
2. Bollinger Bands (Length 25 and Multiplier 2.5 set as default. Used in correlation with TEMA)
3. Kama 2 / Kama 5 - Crossing speaks of Trend way
4. TEMA (TEMA 50, VWMA 25 calculations and plotting. Used for TEMA 50 / VWMA 25 / SMA 25 cross checks for weakening or strengthening trend analysis)
5. ATR plotting
6. Chandelier Exit plotting (Widely used for calculating Stop levels in market)
7. PSAR (Widely used for indicating trend reversal)
Also for the ease of use, if the users does not want to plot any values on the graph and just want to see the values there is couple of tables also included.
1. EMA info
2. KAMA info
3. Order info
4. TP/SL info
imgur.com
Some important notes:
1. To minimize the stop just after the order opening candle in volatile grounds, system prevents to raise new order signals if there is a signal already raised in last 4 candle.
2. if system reach and give close order in one of the TP points (For Ex TP1.), then index goes down and goes up again same TP (above TP1 in scenario) after 4 candle, system gives a close order signal again in the same TP.
3. There is a Profit Factor value had been shown at Order Info table. This information shows how profitable is the setup regarding to given FP and PP values.
In general market conditions, A Profit Factor above 1.50 is considered good enough and above 2.0 it is considered ideal. A strategy with profit factor less than 1.20 suggests too bigger a risk taken for making money.
In some cases automatic ADR and DC calculations are not good enough. so if you want to find a good Profit Factor value, you can change the system automatic calculation to manual value entering and you can see the results directly with in this field.

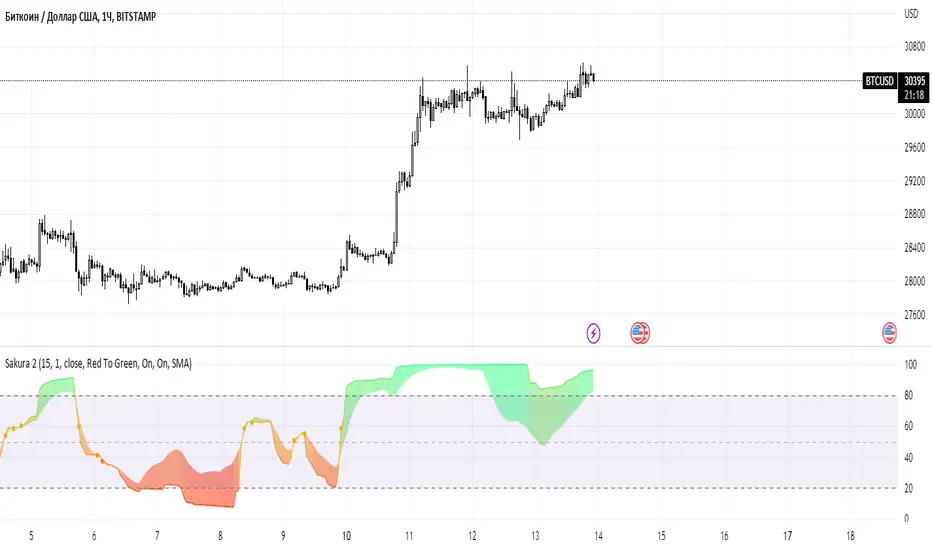
Sakura 2The oscillator uses an adaptive moving average as input to another RSI oscillator and is designed to provide a way to minimize the impact of corrections on the output of the oscillator without significant lag.
An additional trigger line is present in order to provide entry points from intersections between the oscillator and the trigger line.
I'll be working on the code to add and describe the privileges and the best settings
Settings
=Lengthy : period of the oscillator
=Power : controls the sensitivity of the oscillator to retracements, with higher values minimizing the sensitivity to retracements.
=Src : source input of the indicator
The indicator also includes the following graphical settings:
=Gradient : Determines the color mode to use for the gradient, options include "Red To Green", "Red To Blue" and "None", with "None" displaying no gradient.
=Color fill : Determines whether to fill the area between the oscillator and the trigger line or not, by default "On".
=Circles : Determines whether to show circles highlighting the crosses between the oscillator and the trigger line.
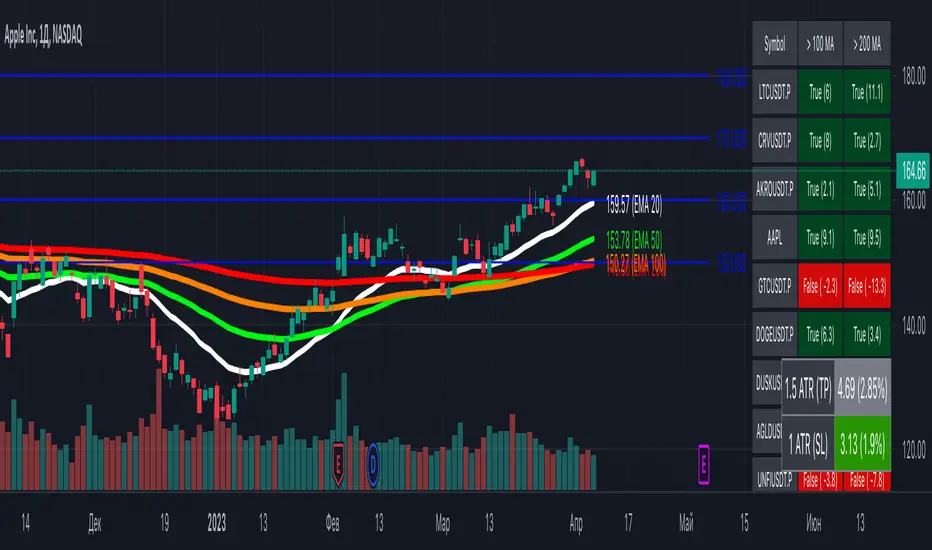
[MiV] MA Screener v1.0In my trading I stick to the following strategy: I buy an asset above the 100/200 moving average and then sell it.
The most problematic thing in all this is to look for assets that are above the 100 or 200 moving average, and to assess how "far" the price is from that moving average.
In fact, to solve this problem I created this indicator.
It works with 30 different assets and displays the state of its two moving averages, whether the price is higher or not, and how much higher the price is from that level.
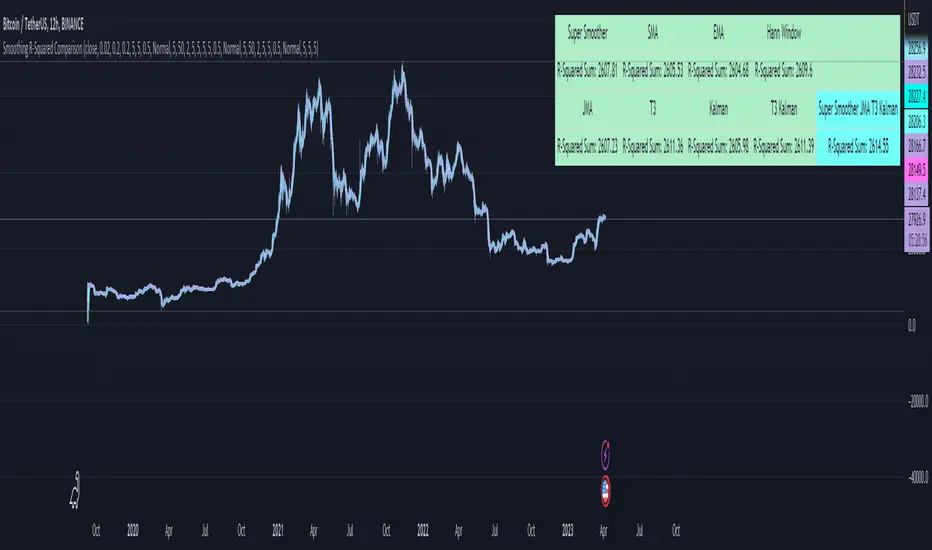
Smoothing R-Squared ComparisonIntroduction
Heyo guys, here I made a comparison between my favorised smoothing algorithms.
I chose the R-Squared value as rating factor to accomplish the comparison.
The indicator is non-repainting.
Description
In technical analysis, traders often use moving averages to smooth out the noise in price data and identify trends. While moving averages are a useful tool, they can also obscure important information about the underlying relationship between the price and the smoothed price.
One way to evaluate this relationship is by calculating the R-squared value, which represents the proportion of the variance in the price that can be explained by the smoothed price in a linear regression model.
This PineScript code implements a smoothing R-squared comparison indicator.
It provides a comparison of different smoothing techniques such as Kalman filter, T3, JMA, EMA, SMA, Super Smoother and some special combinations of them.
The Kalman filter is a mathematical algorithm that uses a series of measurements observed over time, containing statistical noise and other inaccuracies, and produces estimates of unknown variables that tend to be more accurate than those based on a single measurement.
The input parameters for the Kalman filter include the process noise covariance and the measurement noise covariance, which help to adjust the sensitivity of the filter to changes in the input data.
The T3 smoothing technique is a popular method used in technical analysis to remove noise from a signal.
The input parameters for the T3 smoothing method include the length of the window used for smoothing, the type of smoothing used (Normal or New), and the smoothing factor used to adjust the sensitivity to changes in the input data.
The JMA smoothing technique is another popular method used in technical analysis to remove noise from a signal.
The input parameters for the JMA smoothing method include the length of the window used for smoothing, the phase used to shift the input data before applying the smoothing algorithm, and the power used to adjust the sensitivity of the JMA to changes in the input data.
The EMA and SMA techniques are also popular methods used in technical analysis to remove noise from a signal.
The input parameters for the EMA and SMA techniques include the length of the window used for smoothing.
The indicator displays a comparison of the R-squared values for each smoothing technique, which provides an indication of how well the technique is fitting the data.
Higher R-squared values indicate a better fit. By adjusting the input parameters for each smoothing technique, the user can compare the effectiveness of different techniques in removing noise from the input data.
Usage
You can use it to find the best fitting smoothing method for the timeframe you usually use.
Just apply it on your preferred timeframe and look for the highlighted table cell.
Conclusion
It seems like the T3 works best on timeframes under 4H.
There's where I am active, so I will use this one more in the future.
Thank you for checking this out. Enjoy your day and leave me a like or comment. 🧙♂️
---
Credits to:
▪@loxx – T3
▪@balipour – Super Smoother
▪ChatGPT – Wrote 80 % of this article and helped with the research
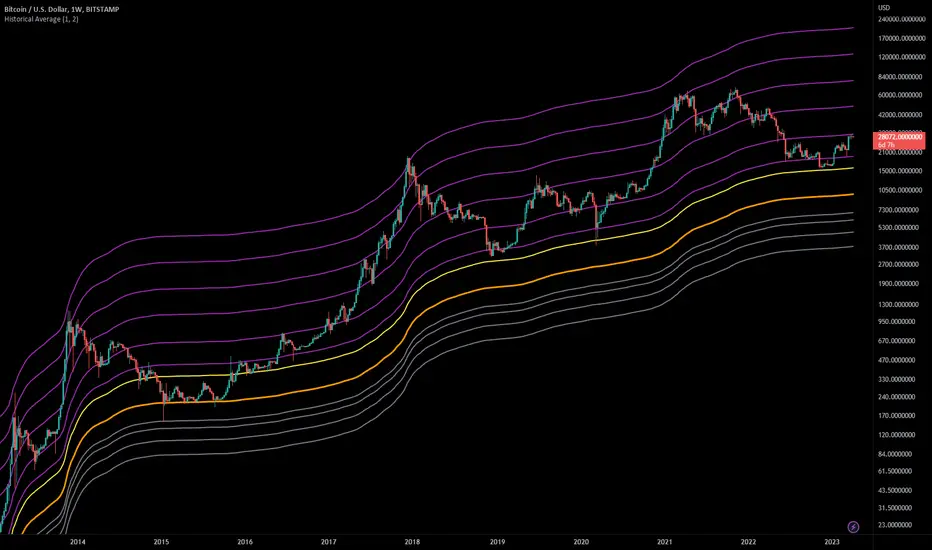
Historical AverageThis indicator calculates the sum of all past candles for each new candle.
For the second candle of the chart, the indicator shows the average of the first two candles. For the 10th candle, it's the average of the last ten candles.
Simple Moving Averages (SMAa) calculate the average of a specific timeframe (e.g. SMA200 for the last 200 candles). The historical moving average is an SMA 2 at the second candle, an SMA3 for the third candle, an SMA10 for the tenth, an SMA200 for the 200th candle etc.
Settings:
You can set the multiplier to move the Historical Moving Average along the price axis.
You can show two Historical Moving Averages with different multipliers.
You can add fibonacci multipliers to the Historical Moving Average.
This indicator works best on charts with a lot of historical data.
Recommended charts:
INDEX:BTCUSD
BLX
But you can use it e.g. on DJI or any other chart as well.
Colorful Moving Averageswhat is Colorful Moving Averages?
This indicator allows you to use your favorite moving averages in their advanced form.
what it does?
It gives you easy access to the following information with a single indicator: the direction and momentum of the price,
rate of change of momentum (acceleration),
time-dependent change in momentum,
and all the other information a moving average provides.
it paints the selected moving average type according to the momentum it has, and also shows the momentum and acceleration values in a table. colors are interpreted as follows: the color of the moving average is red, the momentum is negative; A green color means the momentum is positive, and a yellow color means the momentum is 0. As the momentum changes, the moving average takes on different shades of these 3 colors. how it actually works can be easily understood at a glance.
"Δ" sign indicates momentum compressed between 100 and -100.
"Γ" sign indicates the momentum of the momentum, that is the acceleration. its values are compressed between 100 and -100.
how it does it?
it uses this formulas:
how to use it?
First, select the moving average type you want to use. then set the length and source. Now, with a single indicator, you can observe both the distance of the price from the mean, its instantaneous momentum relative to the last candle by looking at the symbol "Δ", the current change of momentum by looking at the symbol "Γ", and the time-dependent change in its momentum by looking at the colors. you can also see the maximum and minimum points where the momentum is equal to 0.

Mason’s Line IndicatorThe Macon Strategy is an idea conceived by Didier Darcet , co-founder of Gavekal Intelligence Software. Inspired by the Water Level, an instrument used by masons to check the horizontality or verticality of a wall. This method aims to measure the psychology of financial markets and determine if the market is balanced or tilting towards an unfavorable side, focusing on the behavioral risk of markets rather than economic or political factors.
The strategy examines the satisfaction and frustration of investors based on the distance between the low and high points of the market over a period of one year. Investor satisfaction is influenced by the current price of the index and the path taken to reach that price. The distance to the low point provides satisfaction, while the distance to the high point generates frustration. The balance between the two dictates investors’ desire to hold or sell their positions.
To refine the strategy, it is important to consider the opinion of a group of investors rather than just one individual. The members of a hypothetical investor club invest successively throughout the past year. The overall satisfaction of the market on a given day is a democratic expression of all participants.
If the overall satisfaction is below 50%, investors are frustrated and sell their positions. If it is above, they are satisfied and hold their positions. The position of the group of investors relative to the high and low points represents the position of the air bubble in the water level. Market performance is measured day by day based on participant satisfaction or dissatisfaction.
In conclusion, memory, emotions, and decision-making ability are closely linked, and their interaction influences investment decisions. The Macon Strategy highlights the importance of the behavioral dimension in understanding financial market dynamics. By studying investor behavior through this strategy, it is possible to better anticipate market trends and make more informed investment decisions.
Presentation of the Mason’s Line Indicator:
The main strategy of this indicator is to measure the average satisfaction of investors based on the position of an imaginary air bubble in a tube delimited by the market’s highs and lows over a given period. After calculating the satisfaction level, it is then normalized between 0 and 1, and a moving average can be used to visualize trends.
Key features:
Calculation of highs and lows over a user-defined period.
Determination of the position of the air bubble in the tube based on the closing price.
Calculation of the average satisfaction of investors over a selected period.
Normalization of the average satisfaction between 0 and 1.
Visualization of normalized or non-normalized average satisfaction levels, as well as their corresponding moving averages.
User parameters:
Period for min and max (days) : Sets the period over which highs and lows will be calculated (1 to 365 days).
Period for average satisfaction (days) : Determines the period over which the average satisfaction of investors will be calculated (1 to 365 days).
Period for SMA : Sets the period of the simple moving average used to smooth the data (1 to 1000 days).
Bubble_value : Adjustment of the air bubble value, ranging from 0 to 1, in increments of 0.025.
Normalized average satisfaction : Option to choose whether to display the normalized or non-normalized average satisfaction.
Please note that the Mason’s Line Indicator is not a guarantee of future market performance and should be used in conjunction with proper risk management. Always ensure that you have a thorough understanding of the indicator’s methodology and its limitations before making any investment decisions. Additionally, past performance is not indicative of future results.

Rainbow Collection - VioletMoving averages come in all shapes and types. The most basic type is the simple moving average which is simply the sum divided by the quantity. Therefore, the simple moving average is the sum of the values divided by their number.
In technical analysis, you generally use moving averages to understand the underlying trend and to find trading signals. In the case of the Violet indicator, we are using a Hull moving average which is a special variation based on different weights to minimize lag.
The Violet indicator is therefore used as follows:
* A bullish signal is generated whenever the close price surpasses the 20-period Hull moving average while the previous close prices from periods were all below their respective Hull moving average of the period.
*A bearish signal is generated whenever the close price breaks the 20-period Hull moving average while the previous close prices from periods were all above their respective Hull moving average of the period.
The aim of the Violet indicator is to capture reversals as early as possible through a combination of lagged conditions based on the Fibonacci sequence.

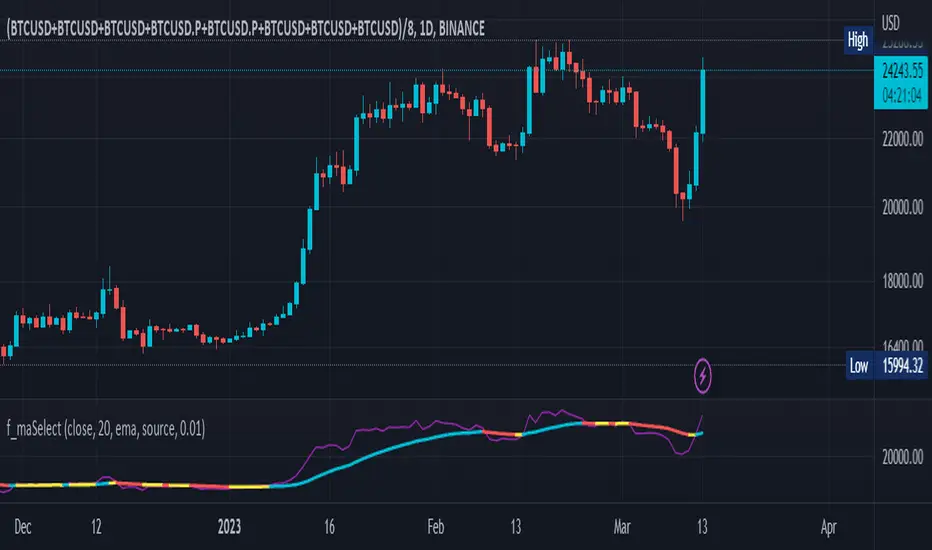
f_maSelectLibrary "f_maSelect"
Easy to use drop-in facade function to lots of different moving average calculations, including some that are not natively available in PineScript v5 such as Zero-Lag EMA. Simply call f_maSelect(series float serie, simple string ma_type="sma", ma_length=14) instead of a ta.*ma() call and you get access to all MAs offered by PineScript and more.
zema(src, len)
Zero-lag EMA (ZLMA)
Parameters:
src : Input series
len : Lookback period
Returns: Series smoothed with ZLMA
approximate_sma(x, ma_length)
Approximate Standard Moving Average, which substracts the average instead of popping the oldest element, hence losing the base frequency and is why it is approximative. For some reason, this appears to give the same results as a standard RMA
Parameters:
x : Input series.
ma_length : Lookback period.
Returns: Approximate SMA series.
f_maSelect(serie, ma_type, ma_length)
Generalized moving average selector
Parameters:
serie : Input series
ma_type : String describing which moving average to use
ma_length : Lookback period
Returns: Serie smoothed with the selected moving average.
generalized_dev(src, length, avg, lmode)
Generalized deviation calculation: Whereas other Bollinger Bands often just change the basis but not the stdev calculation, the correct way to change the basis is to also change it inside the stdev calculation.
Parameters:
src : Series to use (default: close)
length : Lookback period
avg : Average basis to use to calculate the standard deviation
lmode : L1 or L2 regularization? (ie, lmode=1 uses abs() to cutoff negative values hence it calculates the Mean Absolute Deviation as does the ta.dev(), lmode=2 uses sum of squares hence it calculates the true Standard Deviation as the ta.stdev() function does). See also the research works of everget:
Returns: stdev Standard deviation series
generalized_dev_discount(src, length, avg, lmode, temporal_discount)
Standard deviation calculation but with different probabilities assigned to each bar, with newer bars having more weights en.wikipedia.org
Parameters:
src : Series to use (default: close)
length : Lookback period
avg : Average basis to use to calculate the standard deviation
lmode : L1 or L2 regularization? (ie, lmode=1 uses abs() to cutoff negative values hence it calculates the Mean Absolute Deviation as does the ta.dev(), lmode=2 uses sum of squares hence it calculates the true Standard Deviation as the ta.stdev() function does). See also the research works of everget:
temporal_discount : Probabilistic gamma factor to discount old values in favor of new ones, higher value = more weight to newer bars
Returns: stdev Standard deviation series
median_absdev(src, length, median)
Median Absolute Deviation
Parameters:
src : Input series
length : Lookback period
median : Median already calculated on the input series
Returns: mad, the median absolute deviation value
Blocky's EMA RibbonA classic EMA ribbon setup.
The script uses eight EMAs, with default lengths ranging from 21 to 55 periods, with an additional EMA with a default length of 200 periods.
The lengths of the EMAs can be customized, when customizing, the shortest time frame should be first and the longest time frame last.
The ribbons gradient strength is calculated based on the EMA's sequence, and their separation.
The color and transparency are set based on the calculated strength. The bolder the color, the stronger the strength.
Use the opacity multiplier to increase/decrease the strength of the gradient. BITSTAMP:BTCUSD
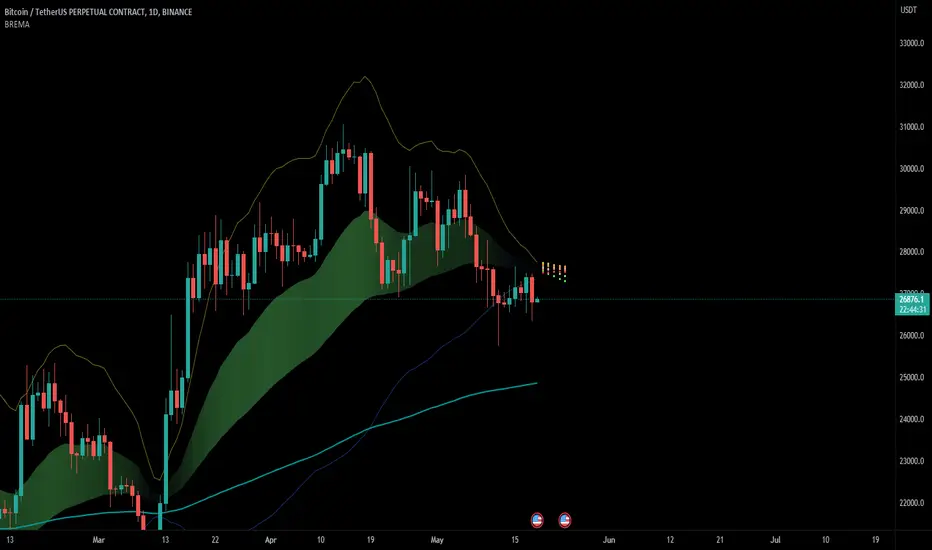
Short Term Bubble RiskThis risk indicator uses the extension of the closing price to the 20W SMA and displays a color-coded risk oscillator. The higher the oscillator is, the greater the short-term risk and vice-versa. This indicator has historically worked well for estimating the short-term risk of Bitcoin and Ethereum on a weekly timeframe.

Rainbow Moving AverageA Rainbow Moving Average script. There are many like it, but this one is mine. It is designed to be easy to read without too much noise in the number of lines and shading, with the moving average to be some of the commonly used ones. Using commonly referenced moving average values help us to understand "the crowd" and what moving average or trend lines they might be looking at. The default values are derived from hourly charts, but work well on any time frame.
The moving average function is simple to change so you can use it for any moving average type that you like, including volume-weighted.
Inspired by my daughter's love of rainbows, she has approved the colors.

Rekt Edge Reversion BandRekt Edge Reversion band is a technical indicator that utilizes a combination of moving averages and standard deviations to determine optimal entry and exit points in the market. By comparing the current price to its moving average, the indicator identifies potential trends and determines how you can position around them by plotting buy/sell signals and two channels based on user input parameters. The user can choose between Simple Moving Average ( SMA ) or Exponential Moving Average ( EMA ) and select the moving average period, the unit of separation, the multiples of the unit, and other important parameters. The indicator's inputs can be adjusted to suit different trading styles, and it can be used on any time frame. The indicator can be used to identify potential trend reversals or breakouts (or breakdowns) when the price moves outside of the channels. The indicators potential use cases include identifying overbought or oversold conditions. With its ability to provide a clear signal on when to enter and exit a trade, this indicator is a popular tool among traders looking to make more informed and profitable trading decisions. This indicator can also be used in conjunction with other technical analysis tools to confirm or invalidate trading signals.
