Money Flow Trend Strength [CraftyChaos]I devised this indicator because I wanted to find a way to track the Money Flow Trend to exhaustion for both directions.
Overview:
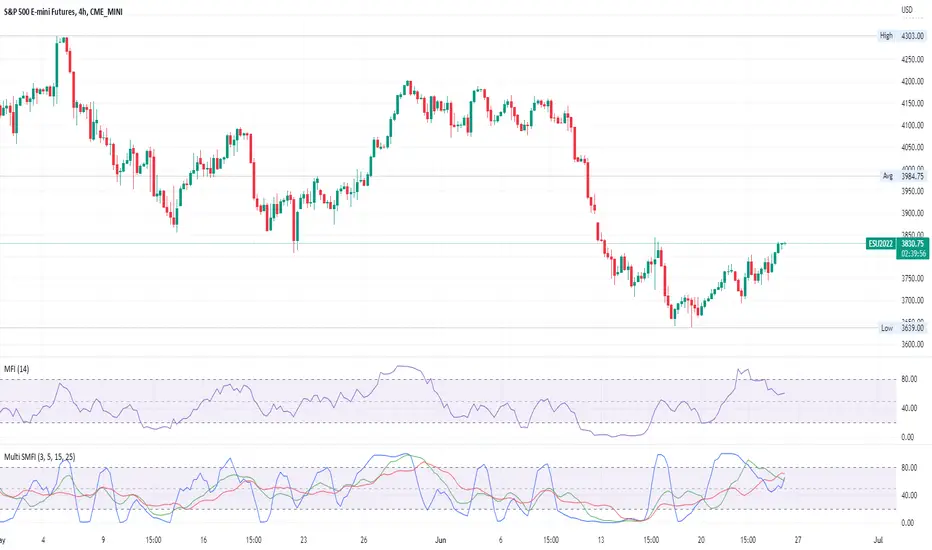
I use two MFI series and an EMA of the faster MFI series to derive when the Money Flow is trending in one direction or another.
What does this indicator not do:
This indicator does not give buy and sell signals.
What does this indicator do:
This indicator offers confluence with your other indicators to determine when a reversal is approaching after a sustained trend of money flowing in or out of an asset.
This indicator can help time your trades near reversal points, so you are not entering trades in the middle of some trending move.
How to Tune
I would not recommend changing the settings. I have exposed them for people that want to experiment. The short lengths are key to reducing lag
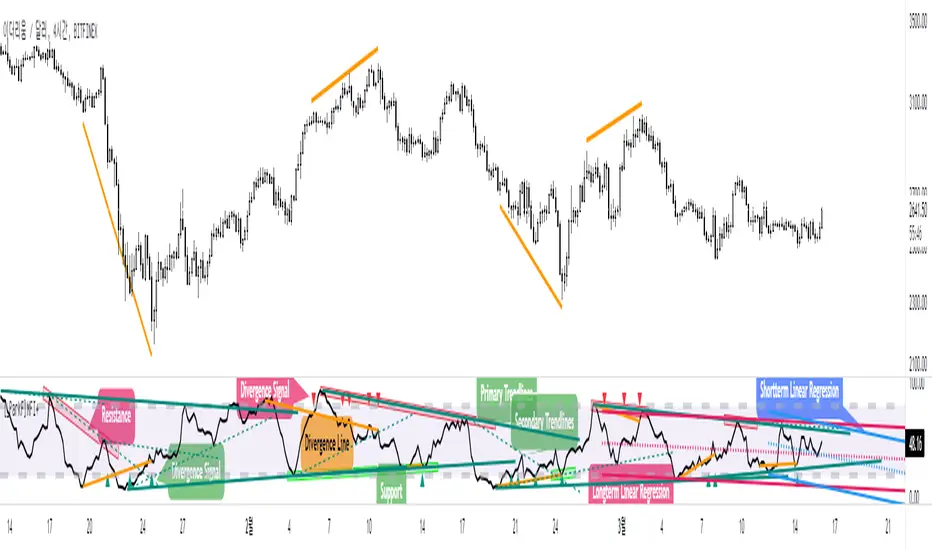
How to read the indicator:
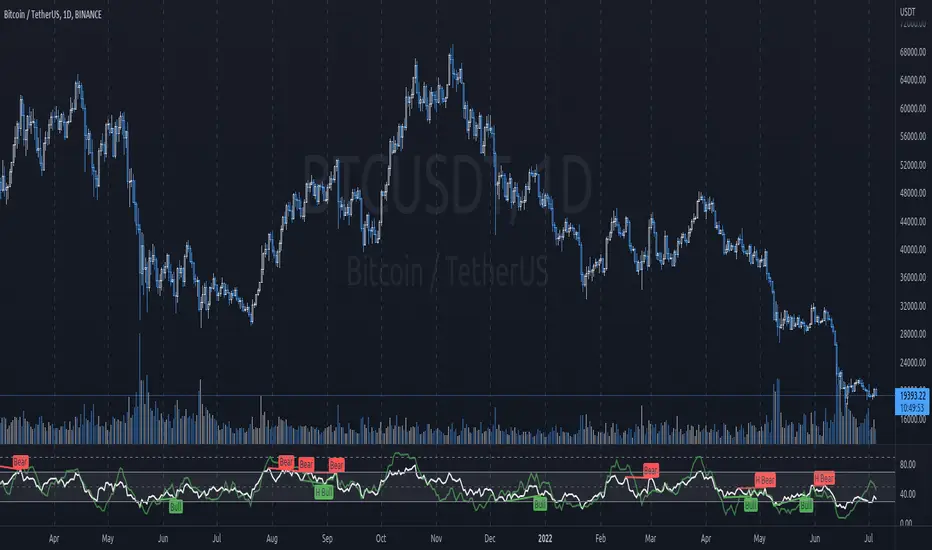
When a red cross appears at the top, this indicates money flow into the asset is strong. Do not short an asset while there are red crosses. You will get REKT
When a green cross appears at the bottom, this indicates money flow exiting the asset is strong. DO NOT buy an asset while there are green crosses. You will get REKT.
When the white step line enters the top, but no crosses appear, this indicates money is flowing into the asset, but is weak. The trend will either gain strength soon or will collapse.
When the white step line enters the bottom, but no crosses appear, this indicates money is flowing out of the asset, but is weak. The trend will either gain strength soon or will collapse.
The green line is the slower MFI. I would not use any crosses with the white step line and the green line. These two lines can cross frequently and show divergences with price. very frequent crossing may indicate sideways movement with no real price movement.
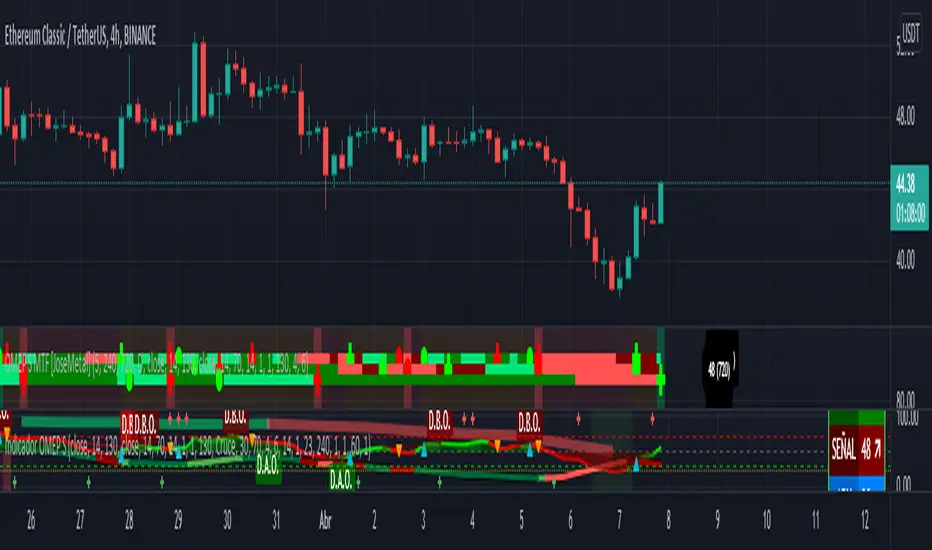
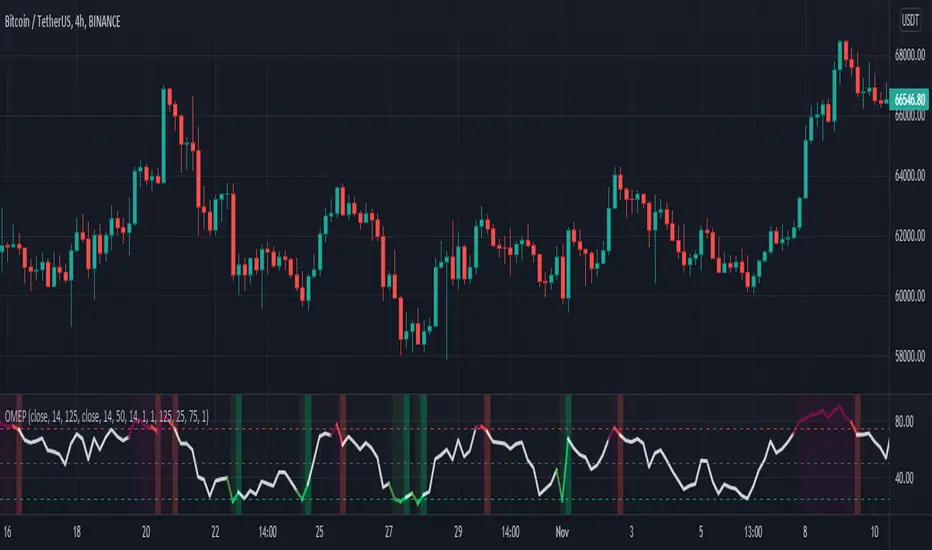
I often see the white step line enter the bottom and top zones under two primary conditions:
Secondary tests of support and resistance zone which fail
Failed breakouts/pullbacks after a pump or dump
Additionally, I use my indicator with the following indicators. You may find them useful:
Jurik Filtered, Composite Fractal Behavior (CFB) Channels (on current timeframe). Note: I often find strong trends trace the upper/lower bands, and end when the upper or lower band flattens
Jurik Filtered, Composite Fractal Behavior (CFB) Channels (on smaller timeframe, i.e., 2hr on a 4h or 15m on the 1hr). Note: I often find weak trend pullbacks/breakouts touch the channel bands
Session Volume Profile. Note: find trend completion corresponds to price above/below VAL areas
Wskaźnik Pine Script®