Money Flow Index (MFI)User request. A tuned version of the built-in True Strength Index (TSI) indicator with the following options included:
MFI - Signal Histogram
MFI/Signal Crossovers
MFI/Signal Ribbon
Bands breakouts highlighting
Middle line crossovers background
MFI

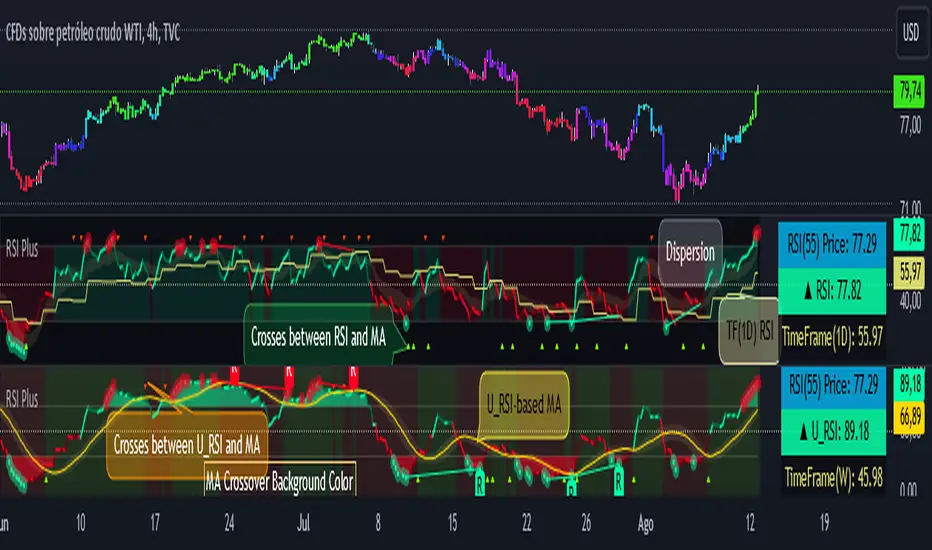
RSI PlusRSI Plus:
☑️ Show the divergences.
☑️ Shows the approximate price of an RSI level (by default it is level 55 but it can be changed for any other level).
☑️ Shows the bulls and bears zones, in green when crossing level 50 up and red when crossing down.
☑️ Circle the highest and lowest levels as possible purchases and sales.
☑️ Includes a smoothed RSI.
RSI Plus:
☑️ Muestra las divergencias.
☑️ Muestra el precio aproximado de un nivel del RSI (por defecto viene el nivel 55 pero se lo puede cambiar por cualquier otro nivel).
☑️ Muestra la zonas de toros y osos, en verde cuando cruza hacia arriba el nivel 50 y rojo cuando cruza hacia abajo.
☑️ Marca con un circulo los niveles mas alto y mas bajos como posibles compras y ventas.
☑️ Incluye un RSI suavizado.
Pure Volume Divergence [NeoButane]PVD: MACD with volume as source.
Options to configure:
OBV, PVT, or MFI as source
Display PVD or a faux zero-based oscillating CVD

Oscilator CandlesBased on the response received on Bollinger %B candles, thought it would be nice to get the same on oscillators.
Use cases include applying atr based indicators or any indicators which utilizes - high, low, open close on oscillator values. Example : supertrend
Note: length values are reused by different oscillator types based on input requirements.

Ehler's Autocorrelation Periodogram - RSI/MFIWarning! Frequently hits the execution time limit for scripts.
Especially on initially adding to your chart. Often requires toggling show/hide indicator to get it to complete script execution within the time limit. YMMV!
From TASC Sept 2016 this is Ehler's Autocorrelation periodogram. A means of determining the dominant cycle ("ideal" indicator length / dynamic length).
As an example it's applied here to RSI or MFI. Lower indicator segment displays the autocorrelation spectrum and the computed dominant cycle. Upper segment is RSI/MFI.
Finnie's RSI + 3EMA crossover + MFI + Vix Fix-added a medium and long term rsiEMA, in addition to the previous short term, except this time there's a visual crossover :)
-added CM Williams vix fix
-and finally just a general visual overhaul!

Effort v RewardI made this indicator to make it easier to compare volume and price movement. This is similar in concept to the Market Facilitation Index by Bill Williams, although hopefully this can make that analysis easier to see at a glance (similar to the way some bar overlays/recolors work but with more detail and in its own pane). The primary use for this indicator would be paying attention to the red EMA, which shows the difference between price movement and volume, normalized within the normalization lookback period (adjustable, defaults to 30 bars). When the red ema moves up, it means there is less effort required to move price more, which means the trend (if there is one) is probably stronger or has had resistance removed/shaken out already; if the red ema moves down into the negative, it means there is a lot of effort for very little price movement, meaning a large battle between the bears and the bulls currently (squat). Enjoy, let me know if you want adjustments, and safe and successful trading!

Scalpy MFI*Modified version of my Scalpy indicator replacing RSI with MFI*
It is made up of a 2 main parts.
- The cloud comprising of a 10 period SMA and a 30 period SMA .
- When the cloud is green you should be looking for long entries.
- When the cloud is red you should be looking for short entries.
- Price is most bullish above a green cloud and most bearish below a red cloud.
- Being within the cloud indicates indecision.
The red line represents the MFI

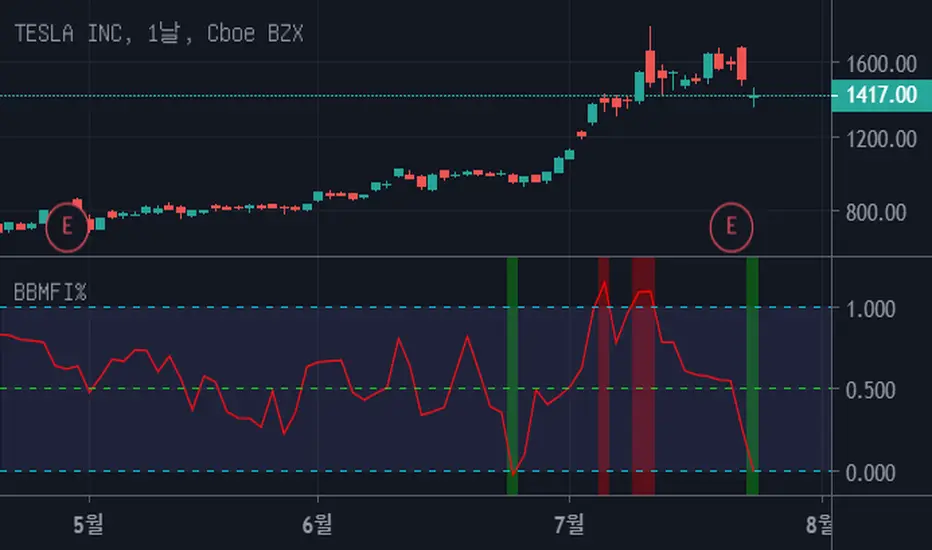
Bollinger Bands Money Flow Index %This script is similar to the previous one "Bollinger Bands Money Flow Index" but it's a little easier to interpret.
Fix the top line of the "BBMFI" to 1, and the bottom line to 0.
Indicates where "Money Flow Index" is located between the top and bottom lines.
If it's bigger than 1, it's overbuying. If it's less than 0, it's overselling.
Consider a trade if you are out of range from 0 to 1.
It's also a good trade timing to out of range and come back in.
Hybrid Overbought/Oversold Detector + Put/Call SignalsThere are many indicators of overbought/oversold conditions out there. Some of more common ones are:
- Bollinger Bands %B
- Money Flow Index (MFI)
- Relative Strength Index (RSI)
- Stochastic
This script uses a combination of these 4 oscillators to confirm overbought/oversold and filter the signals of market reverse which could be used for trading binary options.
You may select which oscillators you want to apply and of course change the source, the length of the calculations and the overbought/oversold levels.
Also the script will draw a combined graph which is the average of the selected oscillators in the options.
Send me your ideas!

Bollinger Bands Money Flow IndexThis script embodies the application of the Bollinger Band and Money Flow Index in John A. Bollinger's book "Bollinger on Bollinger Bands."
"Bollinger on Bollinger Bands" suggests a relatively method of analysis by applying the Bollinger Band to an indicator.
Here's one of the indicators, Money Flow Index.
Money Flow Index is an indicator of overbuying and overselling by reflecting the volume of transactions.
"Bollinger on Bollinger Bands" suggests using the Bollinger Band to create relative top and bottom lines for various indicators, such as Money Flow Index.
Original Money Flow Index is considered to be over-purchased if it is more than 80% and over-selling if it is less than 20%.
But if you put a bolinger band on it, you can set the standard for higher or lower over-selling and over-selling in a sustained bullish, bearish market.
This script uses the following values as the default values as recommended by "Bollinger on Bollinger Bands".
Money Flow Index for 10 days.
a bollinger band of forty days
standard deviation of 2
The above values are suitable for most stocks and markets, but sometimes there is too much or too little data inside the Bollinger Band.
It is recommended to modify each value little by little to adjust 85% to 90% of the total data to fit inside the Bollinger Band.
If the value is higher than the top line, it is considered over-purchased, and a red background color appears.
If the bottom line is crossed down, it is considered over-sold and the green background color appears.

VI BB RSI CRSI MFI - All In OneThis script simply creates a combo of some indicators I have found to be useful to visualize together.
Its fairly simple to use... buy the red and sell the green. The red and green 'zones' are VI indicator plus and minus using color to identify instead of plotting the lines and creating more mess for us.
The blue line is our BB B%... and the solid lines are the buy and sell thresholds.
The yellow line is our RSI, and the dotted lines are the thresholds.
The orange CRSI line is for intrazone (red or green VI zone) trades.. for instance, buying in the sell zone and then selling again (dead cats) and vice versa.
Lastly the purple MFI plot can be useful in identifying trend reversals.
This is not secret code, its free for everyone to use. If you find that it is too cluttered, you can simply comment out the plot function for that indicator to disable the ones that you find most cluttering.
Feedback is appreciated, along with ideas or suggestions.. cheers and happy trading!

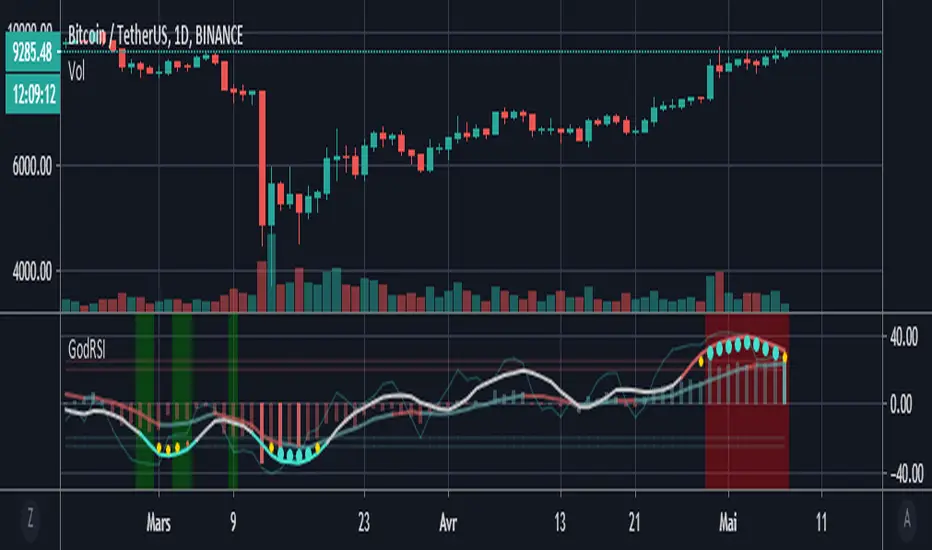
Godmode RSI with MFIBased on the Godmode indicators modified by LEGION, LAZYBEAR, Ni6HTH4wK, xSilas, oh92, sco77m4r7in and anise.
Big thanks to them.
Just an add on of the excellent script of anise.
I only added the possibility to chose the exchange and asset so that the multi exchange option can be used on other assets and the MFI's overbought and oversold highlights.
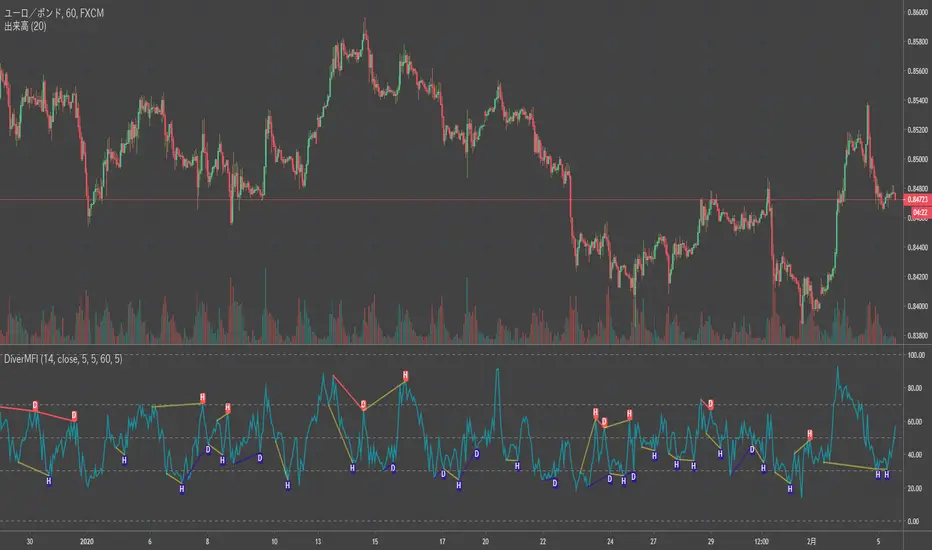
Divergence MFI[mado]Divergence screener for MFI
Regular Bullish: "D" navy label
Hidden Bullish: "H" navy label
Regular Bearish: "D" red label
Hidden Bearish: "H" red label
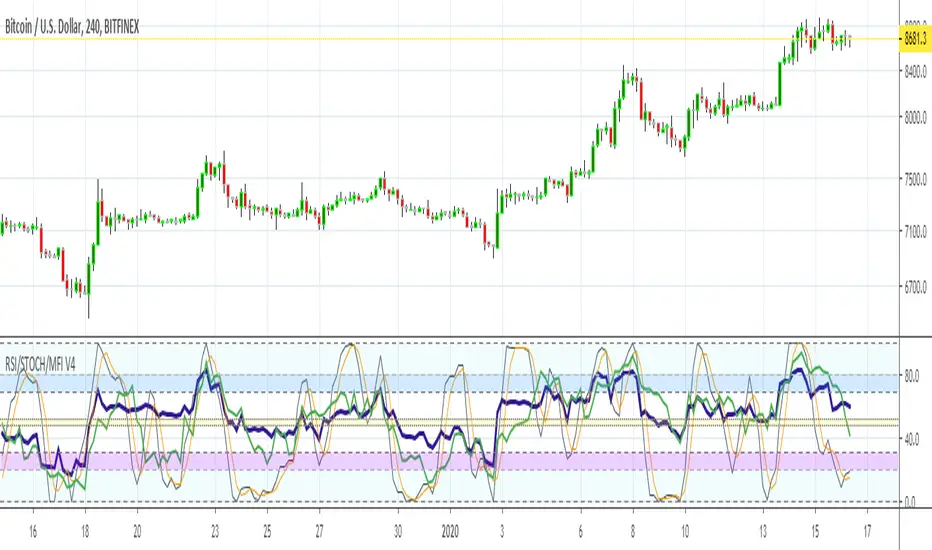
MFI RSI w STOCH OVERLAY V3Combines: Relative Strength (purple) and RSI Stoch (Orange/gray), Money Flow (green) all in one indicator window.
On screen indicator text identifier will read in this order: "RSI/STOCH/MFI V3"
// Changes from original version \\
It was important to bring forth the RSI indicator as the most visually important line and its relationship to the background.
A: Major visual changes from my first published one..as default now
1: Increased RSI line to size 3
2: Increased MFI line to size 2
3: Separated all Bar Line Fields in the background for custom editing, total of 5 now. Much easier to distinguish when the RSI enters these fields.
B: Other major changes as default now
1: Sped up the indicators from 14 to 11, for quicker response. (user can adjust back to 14 or another number)
2: Increased user friendly inputs to adjust colors, lines, data, etc.
3: (darken / lighten and change background colors, increase/decrease line strengths and colors, adjust field data inputs)
Enjoy and Good Luck Trading.
MFI - Money Flow Index [UTS]Money Flow Index (MFI) is the technical indicator, which indicates the rate at which money is invested into a security and then withdrawn from it.
Construction and interpretation of the indicator is similar to Relative Strength Index with the only difference that volume is important to MFI.
Usage:
When analyzing the money flow index one needs to take into consideration the following points:
divergences between the indicator and price movement. If prices grow while MFI falls (or vice versa), there is a great probability of a price turn;
Money Flow Index value, which is over 80 or under 20, signals correspondingly of a potential peak or bottom of the market.
Common known variants of this type of indicator are the On Balance Volume, Chaikin Oscillator or Chaikin Money Flow.
Based on www.metatrader5.com

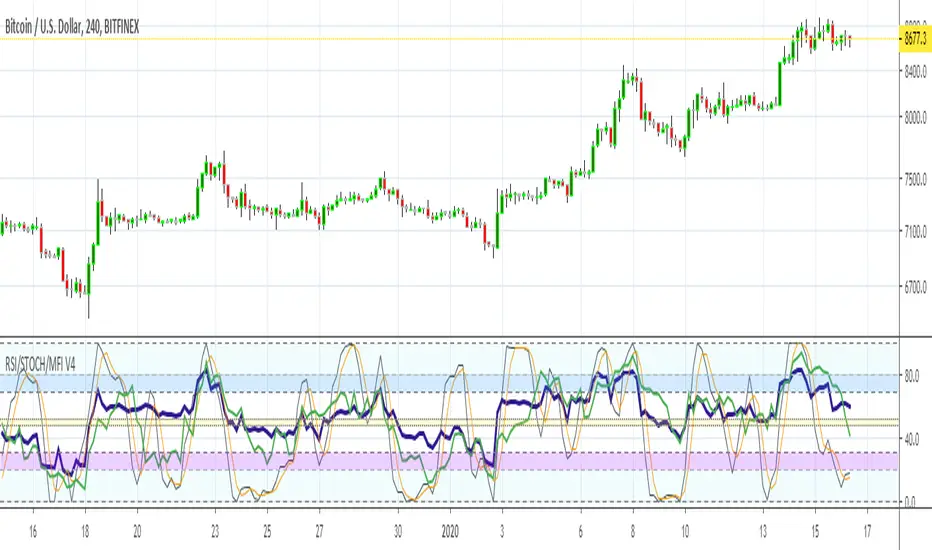
RSI + RSI STOCHASTIC + MFICombines: Relative Strength (purple) and RSI Stoch (Orange/gray), Money Flow (green) all in one indicator window.
Open Interest Stochastic Money Flow IndexThis is the improved version of Stochastic Money Flow Index script that uses Open Interest instead of volume in Future markets.
I think it will make a difference especially in Future and CFD markets.
Since the system will pull data from Quandl, CFTC reports may cause repaint when disclosed.
So if you use it during the weekly time frame (1W), it will definitely not repaint.
You can also use the volume by selecting "Others" from the menu.This option applies to each instrument, you can use it on any financial instrument with or without COT data.
Bitcoin is included in the "Futures" option.
In Futures, you can observe the difference of Open Interest's success by comparing, since it counts exchanges between the two parties singularly, it reacts more firmly to speculative movements.
This script also includes alerts and bar color options, you can use from the menu.
It is also suitable for mutable variables.This script was freed from the integer loads.You can modify it in any adaptive or fractional period.
I hope it will help your analyzes, regards .

Function : Stochastic Money Flow IndexThis function is similar to the stochastic rsi function.
The only difference is that Money Flow Index is used instead of rsi.
Oversold and overbought values were changed to 80 and 20.
Because the MFI's overbought and overbought zones are 20 and 80.
In MFI, I think that it can be more beneficial in liquid markets than stochastic rsi since volume is taken into account in contrast to RSI.
Regards.

Multi momentum indicatorScript contains couple momentum oscillators all in one pane
List of indicators:
RSI
Stochastic RSI
MACD
CCI
WaveTrend by LazyBear
MFI
Default active indicators are RSI and Stochastic RSI
Other indicators are disabled by default
RSI, StochRSI and MFI are modified to be bounded to range from 100 to -100. That's why overbought is 40 and 60 instead 70 and 80 while oversold -40 and -60 instead 30 and 20.
MACD and CCI as they are not bounded to 100 or 200 range, they are limited to 100 - -100 by default when activated (extras are simply hidden) but there is an option to show full indicator.
In settings there are couple more options like show crosses or show only histogram.
Default source for all indicators is close (except WaveTrend and MFI which use hlc3) and it could be changed but for all indicators.
There is an option for 2nd RSI which can be set for any timeframe and background calculated by Fibonacci levels.


Open Interest Money Flow Index (OIMFI)CAUTION : This system was inspired from seiglerj' s "Money Flow Index " script. Open Interests are used instead of volume.
What is the Money Flow Index ( MFI )?
The Money Flow Index ( MFI ) is a technical oscillator that uses price and volume for identifying overbought or oversold conditions in an asset. It can also be used to spot divergences which warn of a trend change in price. The oscillator moves between 0 and 100.
Unlike conventional oscillators such as the Relative Strength Index ( RSI ), the Money Flow Index incorporates both price and volume data, as opposed to just price. For this reason, some analysts call MFI the volume-weighted RSI .
What Does the Money Flow Index ( MFI ) Tell You?
One of the primary ways to use the Money Flow Index is when there is a divergence. A divergence is when the oscillator is moving in the opposite direction of price. This is a signal of a potential reversal in the prevailing price trend.
For example, a very high Money Flow Index that begins to fall below a reading of 80 while the underlying security continues to climb is a price reversal signal to the downside. Conversely, a very low MFI reading that climbs above a reading of 20 while the underlying security continues to sell off is a price reversal signal to the upside.
Traders also watch for larger divergences using multiple waves in the price and MFI . For example, a stock peaks at $10, pulls back to $8, and then rallies to $12. The price has made two successive highs, at $10 and $12. If MFI makes a lower higher when the price reaches $12, the indicator is not confirming the new high. This could foreshadow a decline in price.
The overbought and oversold levels are also used to signal possible trading opportunities. Moves below 10 and above 90 are rare. Traders watch for the MFI to move back above 10 to signal a long trade, and to drop below 90 to signal a short trade.
Other moves out of overbought or oversold territory can also be useful. For example, when an asset is in an uptrend, a drop below 20 (or even 30) and then a rally back above it could indicate a pullback is over and the price uptrend is resuming. The same goes for a downtrend. A short-term rally could push the MFI up to 70 or 80, but when it drops back below that could be the time to enter a short trade in preparation for another drop .
Reference : www.investopedia.com
WARNING :
** Since each instrument in the list has its own unique contract data, you must first enter its name to display it. I recommend you to select OANDA from the markets. Finally, when the COT reports are issued, it may repaints. However, this repaint is usually close to closing or after close .(When COT reports are so sharp ) So use this script only 1W ( 1 week ) or 1 M ( 1 month ) timeframe.
** This data is taken to Tradingview with the help of Quandl. This is a very low possibility, but the system will not work if there is a malfunction.
FEATURES :
*** Working with all futures (Including : Bitcoin )
*** If you dont work with "Futures" , you can select "Others" from switchable menu and use volume for all instruments.
*** New generation elegant design used : Adaptive coloring Overbought - Oversold Levels according to the closing price.
NOTE : This code is open source under the MIT License. If you have any improvements or corrections to suggest, please send me a pull request via the github repository github.com
Stay tuned. Best wishes !

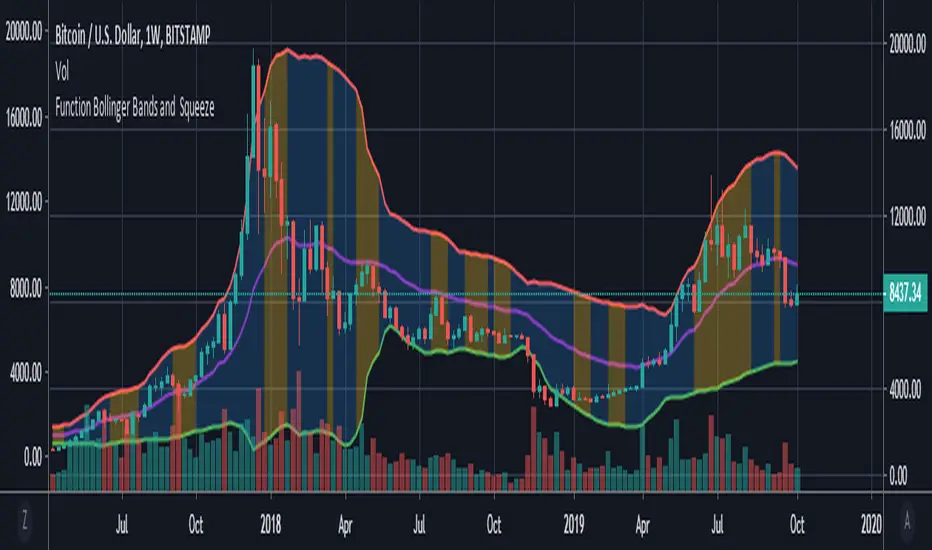
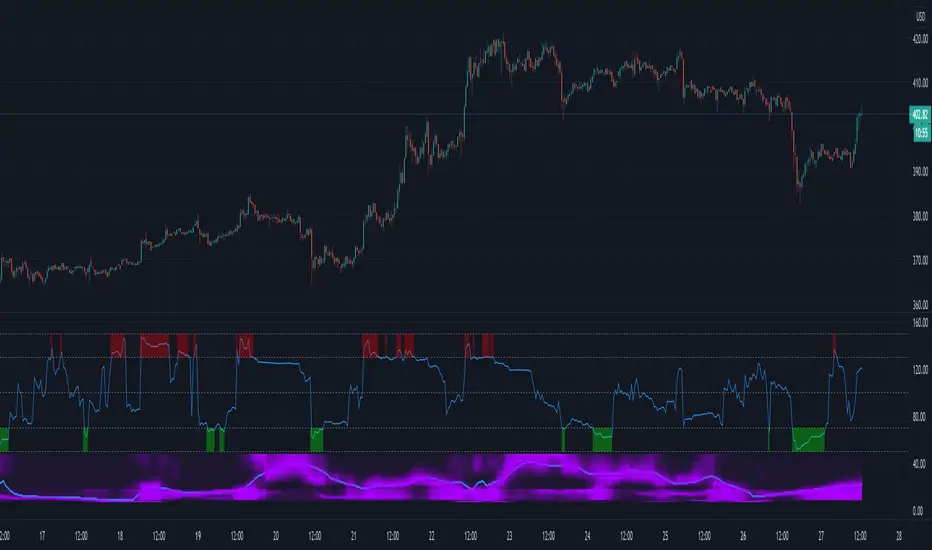
Function : Bollinger Bands and BBW Squeeze DetectorThis script shows Bollinger Bands function and want to detect Bollinger Band Width Squeeze with a successful, different perspective .
Bollinger Bands : You can specify the Bollinger Bands periods as mutable variables .
Bollinger Band Width Squeeze : First the Bollinger bands width was calculated.The width was then divided into levels using the money flow index.
Thus, the bollinger takes into account the available volume averages when calculating the band width mfi (Money Flow Index).
After this modelling, we can limit and color the lower limit and upper limits just as Relative Strength Index.
We can even put warnings on oversold areas if desired. Let's not forget that we are working with width rather than price.
By design, squeeze areas are defined directly above the Bollinger Bands with coloration. I think it is very practical and looks stylish.
I tried and found it quite successful and wanted to share it with users.
I came up with many ideas when I wrote this system, and I will share them very soon . I hope it will be useful to users and give new ideas.
Best regards.