Price Extension from 8 EMAOverview
This indicator can be used to see how far away the price is from the 8 EMA. It compares this to the Average Daily Range % to see if the stock may be overextended. The "Extension Multiplier" represents how far the stock is extended away from the 8 EMA.
Core Concept
This indicator is best used for breakout trades that are trying to make sure they are not chasing the stock.
How to Use This Indicator
This tool is primarily intended for analyzing daily charts of individual stocks and is often used by breakout traders to evaluate potential entry areas.
If the stock is far away from the 8 EMA, it is likely not ready to break out. If it is close to the 8ema, it could be ready to move higher.
This indicator can also be used in the opposite way. For example, shorting or puts.
Understanding the colors
Green (Not Extended): Indicates the price is close to the 8 EMA. This often corresponds to periods of consolidation.
Yellow (Slightly Extended): The price is beginning to move away from the 8 EMA.
Orange (Extended): The price has moved a considerable distance from the 8 EMA.
Red (Very Extended): The price is at an extreme distance from the 8 EMA, historically increasing the likelihood of a pullback or consolidation.
Settings
Info Row Position: Adjusts the vertical position of the display table on the chart. Useful when using other indicators.
ADR Length: Sets the lookback period for calculating the Average Daily Range. Or the average range % for different timeframes.
Timeframe: Determines the timeframe for the EMA and ADR calculation (the default is Daily).
Extension

ATR% Multiple from MAThis indicator builds upon the original idea by jfsrevg of using the ATR% multiple from a daily 50-period moving average to highlight when a stock or instrument is extended relative to its own volatility. My version expands on this by incorporating an ADR% (Average Daily Range percentage) volatility filter, which helps refine the signals to adapt better to different instruments and timeframes.
What it does:
• Calculates the 50-period simple moving average (SMA) using daily data as the baseline trend reference.
• Measures the instrument’s Average True Range (ATR) relative to the current close (ATR%).
• Uses this ratio to identify when an instrument is significantly extended above its average volatility-based range.
• Adds a dynamic ADR% filter — computed as the average daily range divided by the daily close — to adjust the extension threshold dynamically based on recent price volatility.
• Plots small circles above price bars when extension conditions are met, signaling potential overbought conditions.
•The script works on both daily and weekly timeframes, but all volatility calculations are based on daily data to ensure consistency.
How to use:
• Traders can use this indicator to spot when a stock or instrument is significantly stretched relative to its own volatility, which may signal a good time to scale out or manage risk.
• The dynamic ADR% filter helps reduce false positives by adjusting thresholds based on market conditions.
• Use the customizable settings for ATR length, SMA length, and ADR length to fine-tune the indicator for your preferred instruments.
Original Contributions:
• Integrated an ADR% filter that refines the extension threshold based on real-time volatility.
• Added dynamic thresholds that adapt to market conditions, making the indicator more reliable across different instruments and timeframes.
• Maintained daily volatility calculations while allowing signals to appear on both daily and weekly charts.

Session extensions [dani]Session Extension
Indicator Description
The Session Extensions indicator is a customizable tool designed to visually represent key price levels during a specified trading session. It calculates and displays the high, low, and midpoints of the session, along with extension levels based on user-defined multipliers. These extensions help traders identify potential support and resistance zones beyond the initial session range.
This indicator is particularly useful for intraday traders who rely on session-based analysis to make informed decisions. It overlays directly on the chart, ensuring seamless integration with price action.
Key Features
Session-Based Analysis : Tracks and highlights key price levels (high, low, midpoint) during a specific trading session.
Customizable Extension Levels : Allows users to define up to six extension levels (both above and below the session range) with unique multipliers, colors, styles, and widths.
Real-Time Updates : Automatically updates during the active session and resets at the start of a new session.
Usage Guidelines
Add the Indicator to Your Chart : Apply the Session Extensions indicator to your chart to visualize key session-based levels.
Intraday Focus : This indicator is optimized for intraday trading. Ensure that the chart's timeframe is set to an intraday interval (e.g., 1-minute, 5-minute).
Session Alignment : Verify that the session time aligns with your trading schedule and timezone. Misalignment may result in incorrect session detection. (This indicator use America - New York timezone)
Avoid Overcrowding : While the indicator supports multiple extension levels, enabling too many levels simultaneously may clutter the chart. Use discretion when configuring extension levels.
Customize Line Styles and Colors : Tailor the appearance of lines and labels to align with your trading style. Use solid, dashed, or dotted lines, and choose colors that enhance visibility without cluttering the chart.
Combine with Other Tools : Pair this indicator with other technical analysis tools (e.g., moving averages, volume profiles) to enhance decision-making.
Disclaimer & Chat
The Session Extensions indicator is intended for educational and analytical purposes only. It does not provide financial advice or guarantee trading success. Users are responsible for verifying the accuracy of session times and ensuring proper configuration before using the indicator in live trading. This indicator is not a trading signal generator.
Thank you for choosing this indicator! I hope it becomes a valuable part of your trading toolkit. Remember, trading is a journey, and having the right tools can make all the difference. Whether you're a seasoned trader or just starting out, this indicator is designed to help you stay organized and focused on what matters most—price action. Happy trading, and may your charts be ever in your favor! 😊
From, Dani.

Static price-range projection by symbolThis indicator shows you a predefined range to the right of the last candle of your chart. This range is custom and can be changed for a handful of symbols that you can choose. This scale will help you determining if the market is providing a reasonable range before you enter a trade or if the market isn't actually moving as much as you might think. This is particularly useful if you are into scalping and have to consider commission or spread in your trades.
Since all symbols have different price ranges in which they move this indicator doesn't make sense to just have "a one size fits all" approach. That's why you can choose up to 6 symbols and set the range that you want to have shown for each when you pull it up on the chart. Using my default values that means for when the NQ (Nasdaq future) is on the chart you will see a range of 20 handles projected. When you change the the ES (S&P500 future) you will instead see 5 handles. While the number is different that is somewhat of an equal move in both symbols.
There also is an option to set a default price range for all other symbols that are not selected if it is needed. However the display of the scale on anything else than the 6 selected symbols can also be turned off.
There are options provided on how exactly you want to indicator to determine if the chart symbol matches one of the selected symbols.
You can enable it to make sure the exchange/broker is the exact same as selected.
It can check for only the symbol root to match the selection. Specifically for futures this means that while ES1! might be selected, anything ES (ES1!, ES2!, ESH2025, ESM2025, ESM2022, ...) will be a match to the selection)
On the painted scale it is possible to not just show this range extended into each direction once. Per default you will have 3 segments of it in each direction. This can be reduced to just 1 or increased.
If you chose a high number of segments or a large range make sure to use the "Scale price chart only" option on your chart scale to not have the symbols price candles squished together by the charts auto scaling.
And last but not least the indicator options provide some possibilities to change the appearance of the printed price range scale in case you disagree with my design.

Icaro [VekiSeba]
Icaro Indicator: Monitoring Price Extensions
Overview
The Icarus Indicator is a tool designed to help traders identify critical points in the price movements of financial assets. Inspired by the Greek myth of Icarus , this indicator alerts on potential exhaustions in bullish movements or significant price extensions. It is ideal for traders looking to optimize profitability and make strategic decisions on when to exit a position, thereby minimizing the risk of dramatic price reversals.
How the Indicator Works: The Icarus Indicator combines various volatility and trend metrics to provide signals:
ATR (Average True Range): Measures the asset’s volatility, providing insight into the intensity of price movements. This component is crucial for understanding the strength behind the asset’s fluctuations.
Gain from Average Trend: This metric calculates how much the current price has deviated from an average trend line. It helps identify how extended or overvalued the price might be in relation to its overall trend.
ATR Acceleration: Assesses how the pace of volatility change compares to its recent average, indicating rapid changes in volatility that might suggest an increase in momentum or an early warning of overextension.
Visual Signals:
Wing Momentum (Purple Cross): Indicates a significant increase in volatility acceleration, suggesting that the price may be entering a phase of unusual momentum. There is also the potential that this signal could lead to a correction.
Solar Roof (Red Circle): Activates when the price reaches an exhaustion level as defined by the user’s threshold, indicating a possible turning point or correction.
NASDAQ:SMCI
Configuration and Use: Users can customize the "Flight Threshold" to adjust the sensitivity of the indicator to their specific trading strategies. Modifying this threshold allows the indicator to be less or more reactive to the asset’s fluctuations.
Originality and Utility of the Indicator: Icarus stands out from other indicators with its unique focus on measuring volatility, offering a dynamic perspective on the asset's conditions. A notable feature of Icarus is its ability to reduce the number of false signals through its specialized formula, which prioritizes accuracy over the frequency of alerts. Although this may mean that the indicator does not react to all price extensions and might occasionally overlook some, it is intentionally designed to provide a higher percentage of correct signals when it does issue an alert. This "lower frequency, higher accuracy" approach is particularly valuable for traders who prefer the quality of signals over quantity, thus minimizing reactions to incorrect market movements and optimizing trading decisions based on highly reliable indicators. However, it is important to note that no indicator, including Icarus, can guarantee 100% effectiveness. Indeed, we cannot quantify the exact success rate of Icarus, as its performance can vary widely depending on the volatility of each asset and the market context at any given time.

DP-OCR MTF & MA 2024This script developed is designed for multi-timeframe analysis of previous open, close, and range, with additional signal plots based on various percentage extension levels. It also incorporates EMA calculations for crossover strategies. Here's a quick breakdown of what the script does:
Key Features:
1. Timeframes:
o Two separate timeframes (TF1 and TF2), which can be set by the user (e.g., 15 mins, 30 mins, daily, etc.). The script computes price actions and extensions for both timeframes. For better analysis, use Daily in TF1 and Weekly in TF2
2. Extension Levels:
o Calculates and plots 10%, 21%, 31%, 51%, and 61% extensions (both positive and negative) for each timeframe.
o The most commonly used extension levels are 61%, 31%, -61%, and -21%.
o These extension levels can be turned on or off by the user.
3. Open/Close/Range:
o Tracks the high, low, open, and close for both timeframes.
o Highlights open/close gaps.
o Plots the previous high/low range for both timeframes with a fill and different colors based on price movement.
How to Use:
• You can toggle specific extension levels on or off in the script’s settings.
• For example, when price hits a +61% extension, it could signal a breakout, and when it hits a -61% extension, it may indicate a potential retracement.
• Use these levels in conjunction with your price action analysis to set entry/exit points or stop-loss levels.
4. Today’s Open:
o Plots today’s opening price for both timeframes.
How to Use:
• Use today’s open as a key reference point to determine the day’s price action.
• Compare today’s open with the previous high/low or extension levels to evaluate possible trends or reversals.
5. EMA Calculations:
o The script calculates 5, 15, and 20 period EMAs and plots them on the chart.
o Additional EMA crossover signals can be included for strategy optimization.
How to Use:
• Observe the EMAs for potential crossover signals. For example, a 5-period EMA crossing above a 15-period or 20-period EMA may signal a buy opportunity, while a crossover in the opposite direction may signal a sell.
• Combine the EMA crossovers with extension levels or previous price data to refine your entries and exits.
Customizations Available:
• Users can select whether to display extension levels for either timeframe.
• The script allows automatic adaptation to intraday, daily, weekly, or monthly timeframes based on the current chart settings.
Moreover, the extension levels are calculated based on the previous period’s range, with the most commonly usable extension levels being 61, 31, -61, and -21. These levels are often used for identifying potential price retracements, breakouts, or reversal points in technical analysis.

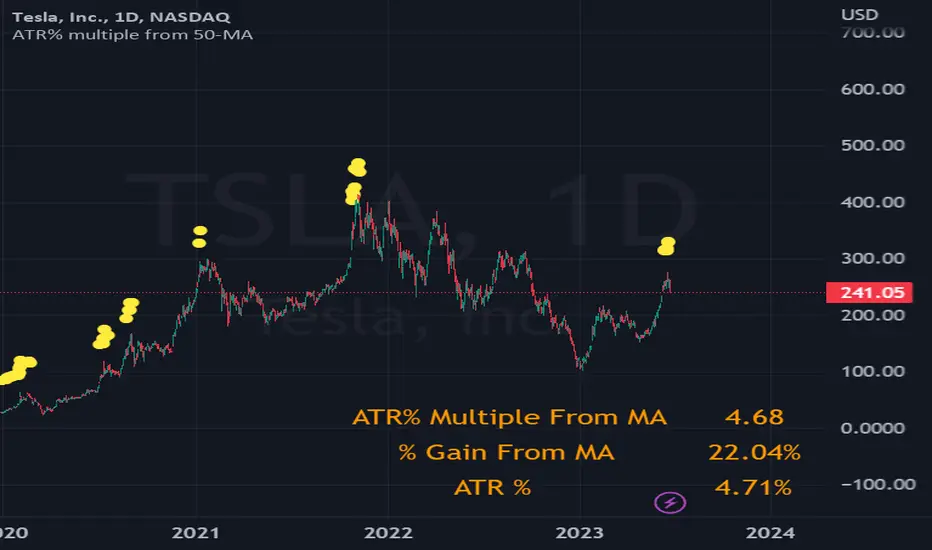
ATR% multiple from 50-MABig credits again to TradingView User @Fred6724 to develop this tool on my behalf to our community.
How can one measure stock price extension?
In my view, decision-making in the trading business should rely on quantifiable data. A method I personally employ for scaling out and taking partial profits involves setting a threshold based on the multiple of Average True Range (ATR%) from the 50-day Simple Moving Average (SMA). For instance, I find it beneficial to start taking profits when positions exceed 7-10 times the ATR% from the 50-SMA. This practice helps prevent second-guessing or becoming emotionally attached to any particular position.
A relevant example illustrating this concept is the case of PLTR, SOFI, TSLA, VRT, NVDA which experienced a stall and subsequent decline after exceeding 10 times the ATR% from its 50-day moving average.
While there is no foolproof profit-taking mechanism that guarantees selling at the absolute market peak, employing this strategy can be a valuable tool for scaling out profits during extended periods to minimize potential losses.
The formula employed is as below:
A = ATR% = $ ATR / $ Last Done Price
B = % Gain From 50-MA
B / A = ATR% multiple from 50-MA
[TTI] Reversion Alert on Nasdaq📜 ––––HISTORY & CREDITS 🏦
This script, titled " Reversion Alert", was developed by TinTinTrading with the intention of creating an easy visual tool based on the relationship between the price and different Exponential Moving Averages (EMAs). It is something TinTinTrading has learned over the years from studying the Investor's Business Daily courses and materials, especially seminars held by William O'Neil.
🎯 ––––WHAT IT DOES 💡
The " Reversion Alert" script monitors the distance between the closing price and the 9-period EMA as well as the distance between the 9-period and 20-period EMAs. It generates an alert when the closing price is far enough away from the 9-period EMA relative to the distance between the two EMAs. The sensitivity of this alert can be adjusted by the user. The script also plots the 9-period and 20-period EMAs on the chart for visual reference. When the distance between the closing price and the 9-period EMA is more than the distance between the 9 and 20 period EMAs (and meets several other coded conditions), the price is likely extended and we can anticipate a pullback within next 1-3 days on the chart.
IMPORTANT - I only use this indicator on the NASDAQ Composite ( NASDAQ:IXIC ) and S&P500 ( SP:SPX ) and Dow Jones Composite ( TVC:DJI ). If you decide to use it for individual assets (equities, crypto or forex) make sure you toggle the sensitivity input so that it makes sense for the asset you are trading.
🛠️ ––––HOW TO USE IT 🔧
After adding the script to your chart, you will see two lines representing the 9-period and 20-period EMAs. You can adjust the sensitivity of the alert using the 'Sensitivity (%)' input in the settings panel. The default sensitivity is set at 18.5%. When an alert condition is met, a downward pointing red triangle with an exclamation mark will appear above the bar. This indicates a potential reversion scenario based on the relative positioning of the closing price and the two EMAs.
If the indicator shows an exclamation mark above the chart we can anticipate a pullback. Some techniques that yuo could apply could be:
👉 Tighten stops
👉 Reduce position size
👉 Harvest profits (or scale down)
👉 Be cautious to add new positions
Remember that this tool is meant to aid in your analysis and not to dictate trades. Always use in conjunction with other tools and your own analysis.

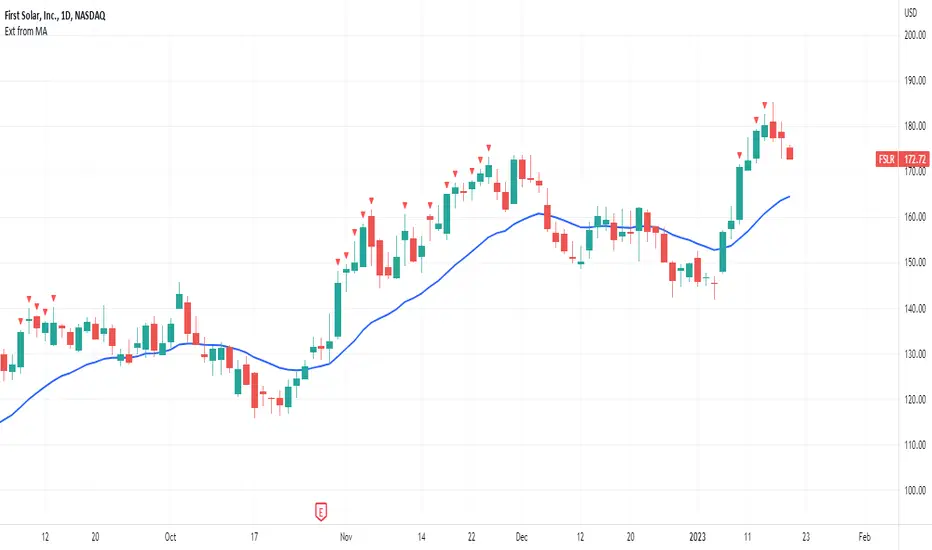
Extended from Moving AverageThis indicator helps avoid chasing extended stocks by showing every time a stock is too far extended from a selected moving average.
Features:
✔️ selectable moving average and source (high, low, close)
✔️ choose to plot or hide the moving average
✔️ selectable distance to be considered too extended
Extension %This is a tracking tool to measure two different kinds of distances:
- Gaps, from the open/close or the high/low value to the nearest open/close or high/low value.
- Price extensions of one or two candles from a preferred starting point (open, high, low or close) to a final point (open, high, low or close). The two-candles mode includes an optional rectangle to help you visualize the first and the last point of the measurement.
The script will plot a label with a percentage when the extension reaches the value you set. Unless you choose to track the one-candle price extension, the label will always be displayed on the high/low value of the second candle.

Support & Resistance Trendlines with PP + Fib. Channel█ Support & Resistance Trendlines with Pivot Points + Fibonacci Channel
This script automatically draw support and resistance trend lines based on pivot points and add a fibonacci channel.
It will show potential patterns with the help of support and resistance lines as well as breakout target and pullback entry with the fibonacci extension and retracement levels.
It is based on atolelole's script, I only made it more configurable so please check out his script.
I added the possibility to change values and add additional retracement and extension levels.
I also made it customizable with the possibility to change lines color, width and style.

Fib Percentage Previous Day CloseIntraday regulated markets move within their circuit range above or below which the market activity is halted.
These levels are protected by the MM to accumulate or distribute. These levels are mostly same for all markets i.e. 2%, 4% , 5%, 10% and 20% of previous day close, crossing which the market activity halts.
So, from here the expectation of turning or breaking increases.
This indicator automatically plots the levels and helps understanding the price behavior at these points. This in turn helps taking better RR trades.

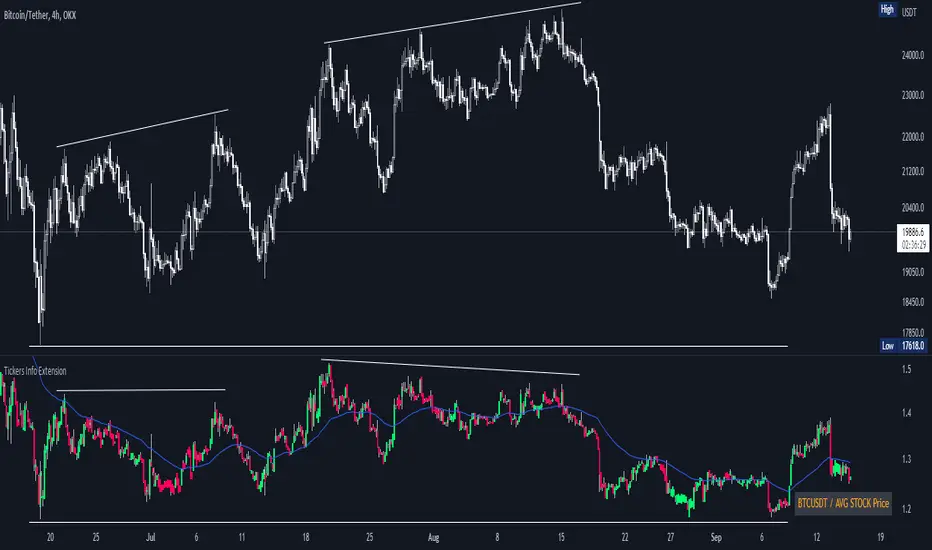
Tickers Info ExtensionWith the indicator you can easily evaluate or compare any ticker with the one you choose in the options.
You can choose any of the tickers I provide in the mod options to your liking :
XAU
DXY
BTC
ETH
SPX
NASDAQ
AVG Stable Dominance
AVG Stock Price
Custom
You can also select or create your own ticker if you select the Custom in Mode option.
If the Compare mode is enabled, then the current ticker you are viewing is divided by the ticker selected in the indicator (in the Mode option).
Thus, you create a new pair and can evaluate the strength of this or that asset.
For example, if you have the ticker BTCUSDT open. And the ticker XAU is selected in the Mode option in the indicator. And the Compare mode is also enabled. Then you will get a new BTCUSDT/XAU pair. That means that now you can see the bitcoin/gold ratio. (Same as EUR/USD etc.)
If the Compare option is switched off then you will see the usual ticker you choose in the Mode option. You can also see if there is a correlation between the selected pairs.
Option ' AVG STABLE.D ' = Calculated as: USDT.D + USDC.D + DAI.D
- This is the average domination of the most important Stable Coins
Option ' AVG STOCK Price ' = Calculated as: (DJI + SPX + NDQ) / 3
- This is the average price of the most important Indexes.
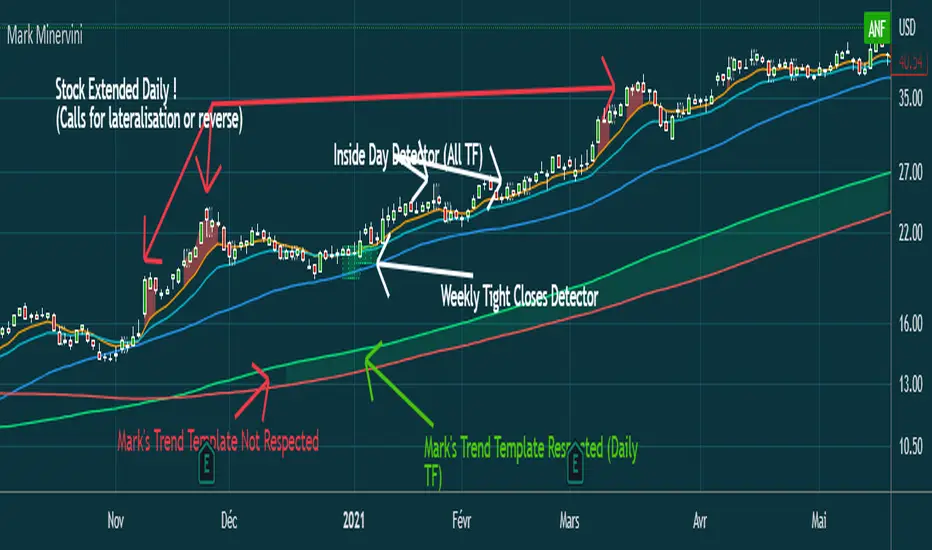
Mark MinerviniHi everyone,
Just sharing a script that I made when I began to be interested in Mark Minervini, Wiliam O'Neil, Nicolas Darvas,.. trading style.
This script displays :
- 10 EMA (orange)
- 20 EMA (blue light)
- 50 SMA (blue)
-150 SMA (green)
-200 SMA (red)
- Shows when the stock is "extended" from EMA10 to high of the candle (Works in Daily, you can adjust the % to make it match with the stock's volatility)
(Shows a red area between price and 10 EMA)
- Shows when Mark Minervini's trend template is respected by highlighting green between 150 & 200 SMA.
I Although added bollinger bands and 5 EMA for very strong stocks. (I never use them)
Have fun
Max distance from weekly averageAfter extended advances, stocks occasionally have a last surge higher and form what is known as a climax top. One way to gauge this is to study what distance the stock is, in percentage terms, vs a moving average. However, most indicators use the close of the bar rather than the high of the bar for this calculation. Stocks that have big reversals may not show to be overextended when looking at a weak closing price. therefore, this tool looks at the high of the week vs the 10-week moving average so that the closing price does not affect comparisons between different weeks.

Swing Crossings - TradingEDThis case study is based on different previous studies: ADX Performance , MACD Performance & RSI Performance, with different counts to compare different oscillations of each indicator. Actually, this indicator is complementary to those previously mentioned. The use of this indicator is restricted to private use, and it can be used only by invitation. Different functionalities have been added to the original codes, such as alerts and signals that seek to make trading much easier to interpret by any type of trading operator of any experience level, from beginner to intermediate and advanced .
Key components of the original ADX indicator:
• The DIRECTIONAL MOVEMENT INDEX (DMI) is a technical indicator that measures both the strength and direction of a price movement and is intended to reduce false signals.
• The DMI uses two standard indicators, one negative ( -DI ) and one positive ( +DI ), in conjunction with a third, the AVERAGE DIRECTIONAL INDEX ( ADX ), which is non-directional but shows momentum.
• The larger the spread between the two primary lines, the stronger the price trend. If +DI is way above -DI the price trend is strongly up. If -DI is way above +DI then the price trend is strongly down.
• ADX measures the strength of the trend, either up or down; a reading above 20 indicates a strong trend.
ADX is plotted as a single line with values ranging from a low of zero to a high of 100. ADX is non-directional; it registers trend strength whether price is trending up or down. The indicator is usually plotted in the same window as the two DMI lines, from which ADX is derived. When +DI is above -DI , there is more upward pressure than downward pressure in the price. Conversely, if -DI is above +DI , then there is more downward pressure on the price. This indicator may help traders assess the trend direction. Crossovers between the lines are also sometimes used as trade signals to buy or sell, theay are the main trade signals. A long trade is taken when the +DI crosses above the -DI and an uptrend could be underway. Meanwhile, a sell signal occurs when the +DI instead crosses below the -DI .
Key components of the original RSI indicator:
● The Relative Strength Index ( RSI ) is a popular momentum oscillator developed in 1978.
● The RSI provides technical traders signals about bullish and bearish price momentum, and it is often plotted beneath the graph of an asset's price.
● An asset is usually considered overbought when the RSI is above 70% and oversold when it is below 30%.
It is a momentum indicator used in technical analysis that measures the magnitude of recent price changes to assess overbought or oversold conditions in the price of an asset. The RSI is displayed as an oscillator (a line chart moving between two extremes) and can read from 0 to 100. Overbought does not necessarily mean that the price will reverse lower, just as oversold does not mean that the price will reverse higher. Rather, the overbought and oversold conditions simply alert traders that the RSI is near the extremes of its recent readings.
Key components of the original MACD indicator:
● The Moving Average Convergence Divergence ( MACD ) is calculated by subtracting a long period (26) Exponential Moving Average ( EMA ) from a short (12) period EMA .
● MACD triggers technical signals when it crosses above (to buy) or below (to sell) its signal line.
● The speed of crossovers is also taken as a signal of a market is overbought or oversold.
● MACD helps traders to understand whether the bullish or bearish movement in the price is strengthening or weakening.
It is a momentum indicator that follows the trend and shows the relationship between two moving averages of the price of a security. It can function as a trigger for buy and sell signals, when you cross above (to buy) or below (to sell) your signal line. It helps to understand if the movement is bullish or bearish , if it is getting stronger or weaker. The further the MACD is above or below its baseline, it indicates that the distance between the two EMAs will be growing, often shown with a histogram that graphically represents the distance between the MACD and its signal line, and It is used to identify when the bullish or bearish momentum.
Main functions of this modified indicator:
1) The SOURCE for the counts can be determined by the trader (close, open, etc).
2) In some cases, you can select the type of MOVING AVERAGE, among many available options ( SMA , EMA , DEMA , HMA , etc.)
3) The MEASURE can be based on a CANDLES count if you are trading OHLC Charts from 1D onwards, or if your trading is intraday, you can also select counts by MINUTES, HOURS or DAYS, depending on your trading style.
4) LENGTH, by default it will be loaded as in the STRATEGY, but considering the previous point, you can modify it according to your convenience.
5) You have the option to hide or show a LABEL at the top of the chart, with respect to the signals: BULLISH green, BEARISH red. *
6) You have the option to hide or show INDICATORS or SIGNALS based on EACH OSCILLATION.
Main performance functions of this modified indicator:
I) In the case of the PERFORMANCE that appears at the right of the chart, you have the option to adjust the WIDTH of each box.
II) The TEXT of the PERFORMANCE is not modifiable, but you can customize the default color. *
III) The BACKGROUND of the PERFORMANCE, you can customize the default color. *
IV) You have the option to hide or show a PERFORMANCE that appears at the right of the chart.
Main functions to customize the style of this indicator:
a) For any type of SIGNAL, it is painted as a VERTICAL LINE in the graph, you can change the color that comes by default. *
b) In the case of the LABELS that appear at the top, the text is not modifiable, but you can customize both the type of label and change the default color. *
c) When you have a SHORT SIGNAL or a LONG SIGNAL, you can change the EMOTICON that comes by default. **
* By default, they are marked as red for downtrends and green for uptrends.
** By default, they are marked with an emoticon indicating the possible direction of the price, down if it is bearish or up if it is bullish .

Litt Opening Range BreakoutThe Litt ORB, Opening Range Breakout, is a tool used by many intraday traders to take advantage of short-term momentum. This script plots extensions based on the opening range and then color candles depending on where the closing price of that candle is. The opening range is defined by either the first 30 or 60 minutes of a new trading day. During that time the opening ranges are set. If the opening range time has passed and we start to break above the Opening Range High that is a good indication that a Trend Day to the upside could be forming. When a stock takes out the range high from the first 30 or 60 minutes this is called an Opening Range Breakout.
OR = Opening Range
ORH = Opening Range High
ORL = Opening Range Low
ORM = Opening Range Mid (Half-way between ORH and ORL)
You can see the ORH and ORL (Opening Range) lines on the chart. The other lines are extension lines from the Opening Range. These are used as price targets for the end of Opening Range breakouts.
The candles are colored as follows.
If we are above the ORH then we use Bull Color 1.
If we are below the ORL then we use Bull Color 2.
If we are above the ORM, Opening Range Mid or the halfway point between the ORH and the ORL, we color Bull Color 2.
If we are below the ORM then we color Bear Color 2.
If the current time is still within the Opening Range then we color the Opening Range Color.
OR = Opening Range
ORH = Opening Range High
ORL = Opening Range Low
ORM = Opening Range Mid (Half-way between ORH and ORL)

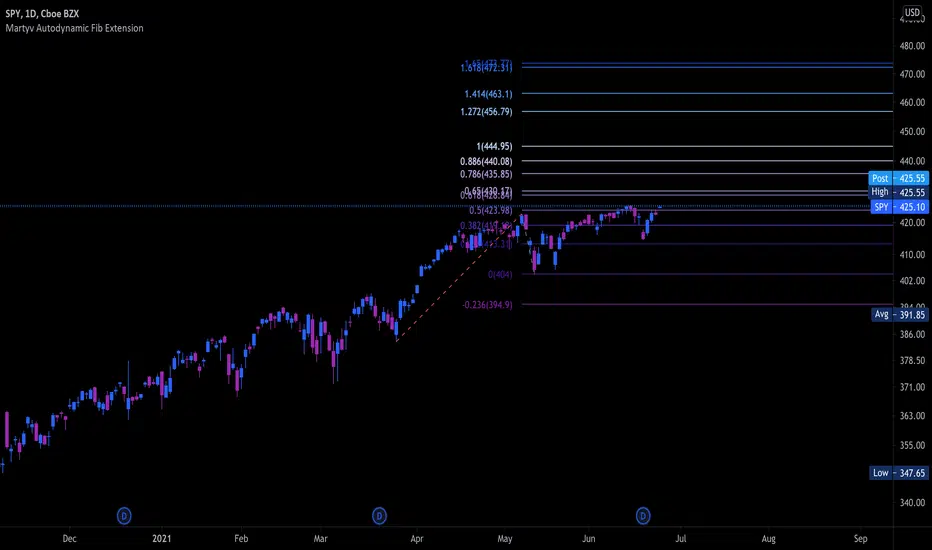
Martyv Auto Fib Extension with Logarithmic SupportSimilar to the Auto Fib Retracement tool - I took the out-of-the-box functionality and added Logarithmic support, as well as nicer colors and easier management of levels. I'm... 90% sure I got the Fib calculations correct. If you see something, say something! Would love any suggestions for improvement.
Example - Custom Defined Dual-State SessionThis script example aims to cover the following:
defining custom timeframe / session windows
gather a price range from the custom period ( high/low values )
create a secondary "holding" period through which to display the data collected from the initial session
simple method to shift times to re-align to preferred timezone
Articles and further reading:
www.investopedia.com - trading session
Reason for Study:
Educational purposes only.
Before considering writing this example I had seen multiple similar questions
asking how to go about creating custom timeframes or sessions, so it seemed
this might be a good topic to attempt to create a relatively generic example.

MESA Adaptive Moving Average - MTF and Divergence analysisThe latest iteration of the MESA Adaptive Moving Average - rewritten to make use of Pinescript v4 Arrays.
Explanation of settings and example use cases:
Fast Limit: Lower values will reduce the reactivity of the MA to rapid price changes.
- For instance, if you want to ignore price spikes on a low timeframe, then reduce Fast Limit
Slow Limit: Lower values will reduce the reactivity of the MA to slow price changes.
- For instance, if you want the MA to ignore small retracements during a trend, then reduce Slow Limit
Show MESA for next higher timeframe: Display the MA of the next standard timeframe that TV offers.
- Displays 3min if the chart timeframe is 1min. Displays D if the chart timeframe is 4H. Does not work with custom timeframes.
Show MESA for custom higher timeframe: Display a secondary MESA plot with a custom timeframe, selectable via the Custom Timeframe drop-down. Overrides the previous setting, if enabled. This functionality is experimental since it provides a higher sample rate than would normally be available. Take precautions making entries using only Custom Timeframe MESA.
- For instance, you made a decision on the 4H chart using MESA and are now watching the 15min to time a trade entry. Enable and select "4H" from the drop-down menu
Show Divergence between MESA Timeframes: Since divergence can differ greatly between assets, we form a baseline by continuously tracking the difference between the chart MA and higher timeframe MA. We note the maximum divergence in each direction (bullish and bearish). A white circle is plotted when divergence is close to the historical maximum. When a record-breaking divergence occurs, a yellow circle is plotted. You can tweak these indications by adjusting the Divergence Threshold %
- Multi-timeframe divergence is typically a weak indication of trend exhaustion, especially if Volume is not present.
Show Divergence between Source & MESA: Again, divergence can differ greatly between assets. This time, we form a baseline by continuously tracking the difference between the chart MA and Source (usually Close). We note the maximum divergence in each direction (bullish and bearish). A purple triangle is plotted when divergence is close to the historical maximum. When a record-breaking divergence occurs, a lime-green triangle is plotted. You can tweak these indications by adjusting the Divergence Threshold %
- Price divergence is a strong indicator of over-extension. It works well for timing reversals on intraday timeframes.
Source: The input data to perform MESA calculations on.
I've really enjoyed trading with this indicator, especially when combined with my previous two tools:
Empirical Suite : factors Trend, Price momentum, Volume, and Volatility
Squeeze Zone : provides a visual representation of volatility squeezes and attempts to predict breakout directions
Use this indicator to get a sense of overall trend, from any chart timeframe, as well as indications of over-extensions and exhaustion.

Extension of High, Low and InbetweenThis script plots an extension my other script High, Low, Inbetween.
It sometimes makes it difficult to view the candles effectively so I've added this separately to my other script
It calculates the range between high/low and midpoint.
It then plots these lines as extensions from the high and low.
This is done twice.

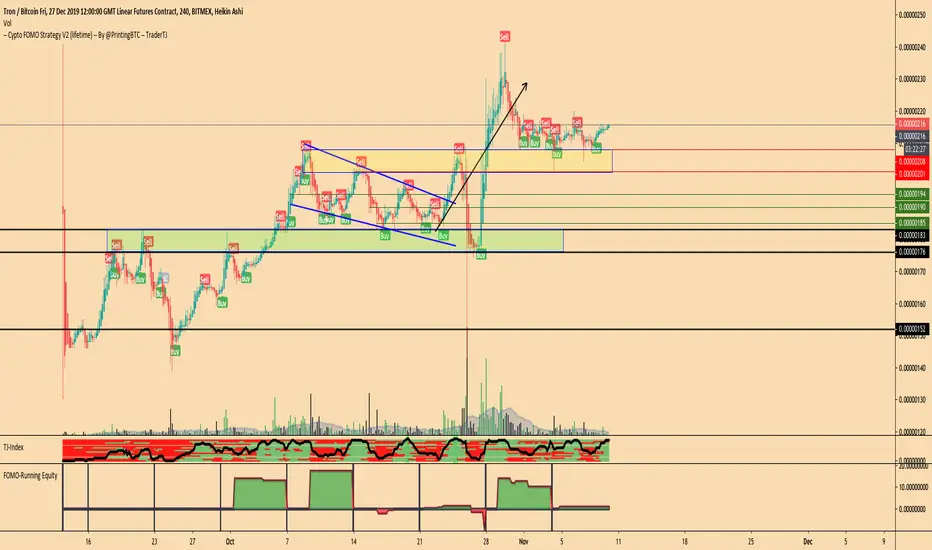
FOMO-Running EquityThis is a backtested for the running equity of my Crypto FOMO Strategy.
It shows you the performance of each trade, shows you periodical equity, resets the equity after each period to 0, shows histograms after each trade.
This is an easy visual tool following Gainzys style to see how the algorithm performed previously and which settings might be the most or more profitable ones in the near future.
Best regards, TJ
Support/Resistance Zones x3Support and Resistance Levels + Zones for 3 time frames, based on volume at fractal levels with Zones based on wick size which is a true reflection of a Zone when compared to other S/R Zone scripts which only use a thick line not based on anything.
Original script is thanks to synapticex I have just migrated to version 3, heavily modified it and added Support and Resistance Zones.
