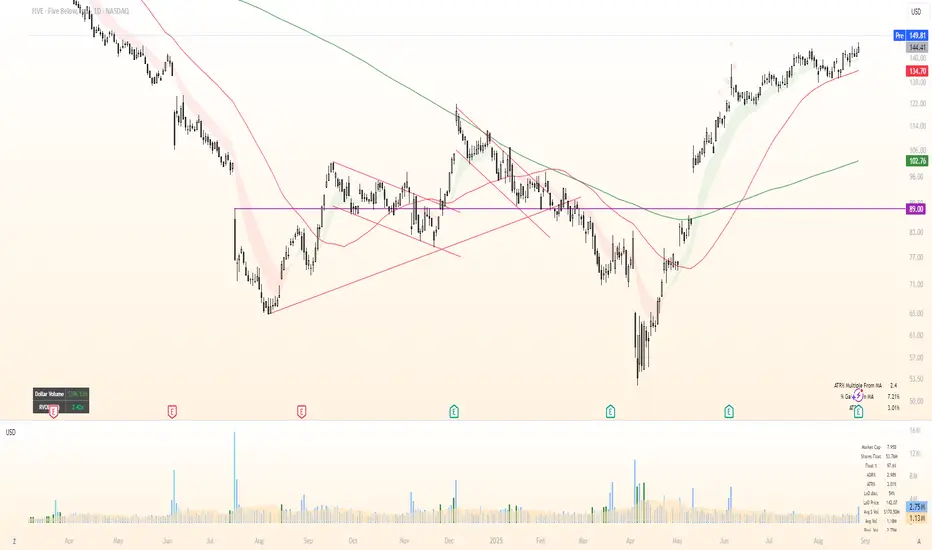
EMA多空趋势信号The EMA multi-period moving average combination retains the Fibonacci sequence 144 for moving support and resistance. It also integrates 1ATR to facilitate users to set take-profit and stop-loss.Wskaźnik Pine Script®od jqz1z1y1x126
Signalgo VSignalgo V: Technical Overview and Unique Aspects Signalgo V is a technical indicator for TradingView that integrates multiple layers of analysis: moving averages, MACD, Bollinger Bands and RSI to deliver buy and sell signals. Below is an informational breakdown of how the indicator functions, its input parameters, signal logic, exit methodology, and how it stands apart from traditional moving average (MA) tools, without disclosing specifics that allow for code duplication. How Signalgo V Works 1. Multi-Layered Technical Synthesis Signalgo V processes several technical studies simultaneously: Fast/Slow Moving Averages: Uses either EMA or SMA (user-selected) with adjustable periods. These are central to initial trend detection through crossovers. MACD Filter: MACD line vs. signal line cross-check ensures trend direction is supported by both momentum and MA structure. RSI Confirmation: The RSI is monitored to verify that signals are not excessively overbought or oversold, tuning the system to changing momentum regimes. Bollinger Bands Context: Entry signals are only considered when price action is beyond the Bollinger Bands envelope, which further filters for unusually strong movements. These strict, multi-indicator entry criteria are designed to ensure only the most robust signals are surfaced, each is contingent on the presence of aligned trend, momentum and volatility. 2. Exit Methodology Take-Profit Levels: After entering a trade, the strategy automatically sets three predefined profit targets (TP1, TP2, TP3). If the price reaches any of these targets, the system marks it, helping you lock in profits at different stages. Stop-Loss System: Simultaneously, a stop-loss (SL) value is set, protecting you from significant losses if the market moves against your position. Dynamic Adjustment: When the first profit target (TP1) is hit, the system can automatically move the stop-loss to your entry price. This means your worst-case outcome is break-even from that point, reducing downside risk. Trailing Stop-Loss: After TP1 is reached, a dynamic trailing stop can activate. This allows the stop-loss to follow the price as it moves in your favor, aiming to capture more profit if the trend continues, while still protecting your gains if the price reverses. Visual Markers: The system plots all important exit levels (profit targets, stop-loss, trailing stop) directly on the chart. Optional labels also appear whenever a target or stop-loss is hit, making it easy to see progress. Visual cues (labels) are plotted directly on the bar where a buy or sell signal triggers, clarifying entry points and aiding manual exit/risk management decisions. Input Parameters rsiLen: Lookback period for RSI calculation. rsiOB and rsiOS: Overbought/oversold thresholds, adaptive to the indicator’s multi-layered logic. maFastLen and maSlowLen: Periods for fast and slow MAs. maType: EMA or SMA selectable for both MAs. bbLen: Length for Bollinger Bands mean calculation. bbMult: Standard deviation multiplier for BB width. macdFast, macdSlow, macdSig: Standard MACD parameterization for nuanced momentum oversight. What Separates Signalgo V from Traditional Moving Average Indicators Composite Signal Architecture: Where traditional MA systems generate signals solely on MA crossovers, Signalgo V requires layered, cross-confirmational logic across trend (MAs), momentum (MACD), volatility (Bollinger Bands), and market strength (RSI). Adaptive Volatility Context: MA signals only “count” when price is meaningfully breaking out of its volatility envelope, filtering out most unremarkable crosses that plague basic MA strategies. Integrated Multi-Factor Filters: Strict compliance with all layers of signal logic is enforced. A marked improvement over MA strategies that lack secondary or tertiary confirmation. Non-Redundant Event Limiting: Each entry is labeled as a unique event. The indicator does not repeat signals on subsequent bars unless all entry conditions are freshly met. Trading Strategy Application Trend Identification: By requiring concurrence among MA, MACD, RSI, and BB, this tool identifies only those trends with robust, multifactor support. Breakout and Momentum Entry: Signals are bias-toward trades that initiate at likely breakout points (outside BB range), combined with fresh momentum and trend alignment. Manual Discretion for Exits: The design is to empower traders with high-confidence entries and leave risk management or partial profit-taking adaptive to trader style, using visual cues from all component indicators. Alert Generation: Each buy/sell event optionally triggers an alert, supporting systematic monitoring without constant chart watching.Wskaźnik Pine Script®od signalgo2
EMA vs TMA Regime FilterEMA vs TMA Regime Filter This indicator is built as a visual study tool to compare the behavior of the Exponential Moving Average (EMA) and the Triangular Moving Average (TMA). The EMA applies an exponential weighting to price data, giving stronger importance to the most recent values. This makes it a faster, more responsive line that reflects short-term momentum. The TMA, by contrast, applies a double-smoothing process (or in the “True TMA” option, a split SMA sequence), which produces a much slower curve. The TMA emphasizes balance over reactivity, often used for filtering noise and observing longer-term structure. When both are plotted on the same chart, their differences become clear. The shaded region between them highlights times when short-term price dynamics diverge from longer-term smoothing. This is where the idea of “regime” comes in — not as a trading signal, but as a descriptive way of seeing whether market action is currently dominated by speed or by stability. Users can customize: Line styles, widths, and colors. Cloud transparency for visual clarity. Whether to color bars based on relative position (optional, purely visual). The goal is not to create a system, but to help traders experiment, observe, and learn how different smoothing techniques can emphasize different aspects of price. By switching between the legacy and true TMA, or adjusting lengths, users can study how each approach interprets the same data differently.Wskaźnik Pine Script®od geneclash34
EMA and BB Analysis for US100 V250829This TradingView strategy generates buy and sell signals based on exponential moving average (EMA) crossovers, limited by other factors such as Bollinger Bands, volume, and EMA distance. It uses EMAs of 16, 24, 32, and 64 periods, as well as the angles of each of these EMAs. Entry Conditions: EMA Crossover Entry: When EMA16 crosses EMA64 and the following conditions are met: EMA16, EMA24, EMA32 are aligned — for a buy signal: EMA16 > EMA24 EMA24 > EMA32 EMA32 > EMA48 (and the opposite for a sell signal) EMA Angles: The angles of the EMAs must also follow the same alignment. Divergence Entry: When the distance between EMAs 16, 24, 32, and 48 increases. Entry Limitations: Once an entry is detected, it is filtered by several conditions: When the distance between the entry candle and EMA96 is more than two candles of the maximum size over three periods. The stop loss is set as two candles of the maximum size over three periods. If this stop loss exceeds 6,000 points (adjustable parameter), the entry is invalid. When the price is at the edge of the Bollinger Band with a 1200-period setting (equivalent to a 1-hour Bollinger Band). When the Bollinger Band's middle line is descending and a buy signal is triggered (and vice versa). When volume drops below a certain threshold. When a sideways market movement is detected. All these entry limitations are configurable parameters and can be enabled or disabled.Strategia Pine Script®od alasso69Zaktualizowano 0
200 4H EMA and MA on ALL TFThis is a EMA/MA 200 4 hour period on all time framesWskaźnik Pine Script®od crushertrades2
Shaded EMA CrossIndicator included 5 EMA's ( 9,20,50,100,200 ) with EMA cross marker and shaded area between EMAs. Shaded EMA100 and EMA200 to see market trend. Shaded EMA20 and EMA50 to see market short trend. Wskaźnik Pine Script®od ameng222Zaktualizowano 42
Multi Triple EMA Crossover [Salamun]Multi EMA Crossover Indicator Function: 1. Identifying Trends: Short EMA (7, 10, 20) for short term trend Intermediate EMA (30, 60, 100) for intermediate trends Long EMA (200) for long term trend The shorter the EMA period, the more sensitive it is to price changes. 2. Providing Entry/Exit Signals: Green Arrow (BUY) : When fast EMA crosses above slow EMA = bullish momentum Red Arrow (SELL) : When the fast EMA crosses below the slow EMA = bearish momentum How to Read Indicators: ✅ Bullish Condition: Price is above the majority of EMA The short EMA is above the long EMA Light green background A green arrow appears. ❌ Bearish Condition: Price is below the majority of EMA The short EMA is below the long EMA Pink background A red arrow appears 📊 Tips Trading: Trend confirmation : Make sure the EMAs are in sequence (EMA7 > EMA10 > EMA20 for uptrend) Support/Resistance : EMA can function as dynamic support/resistance Signal filter : Use higher timeframe for confirmation Risk management : Do not trade against the 200 EMA trend. The table on the top right displays the real-time values of all EMAs and the current trend status for easy quick analysis.Wskaźnik Pine Script®od SamSalamun8
Multi-EMA System (9,34,50,200)This script gives you: Yellow line: 9 EMA (your fastest momentum indicator) Orange line: 34 EMA (good for short-term trend confirmation) Blue line: 50 EMA (classic medium-term trend line) Red line: 200 EMA (the big daddy - long-term trend and major support/resistance) I made the 200 EMA a bit thicker since it's usually the most significant level. You can adjust the colors in the script if you prefer different ones.Wskaźnik Pine Script®od Neat3172243
Dynamic EMADynamic EMA — Flexible Trend Indicator Dynamic EMA is a clean and universal indicator that uses two Exponential Moving Averages to highlight market direction. By default, it applies the popular EMA 14/50 setup, but both EMA lengths can be freely customized. Why EMA 14 and EMA 50? The 14-period EMA is commonly used to capture short-term price momentum, making it sensitive to quick market moves. The 50-period EMA reflects the medium-term trend and is widely recognized by traders and institutions. Together, EMA 14/50 provide a balanced view: fast enough to react to price changes, yet smooth enough to filter out noise. Key Features Two EMAs (fast and slow) with fully adjustable lengths Automatic dynamic coloring for bullish, bearish, and neutral conditions Optional fill between EMAs for improved visualization Adjustable opacity to control chart clarity Why use it? Dynamic EMA offers a reliable way to read market trends, spot momentum shifts, and confirm entries or exits. It works across all asset classes and timeframes, while allowing traders to adjust EMA settings to their own strategy.Wskaźnik Pine Script®od WorldMarket618F10
EMA Crossover Alert with Pullback and Crossthis is mr. priyank sharma sir 's ema strategy indicator it will plot buy or sell signal after ema break and opposite candle formed it will aslo plot "cross" signal if price cross ema again thank you priyanks sir for this awsome knowledgeWskaźnik Pine Script®od vishal50002004Zaktualizowano 18
BornInvestor MA CloudsBornInvestor MA Clouds The BornInvestor MA Clouds script is a powerful, multi-layered moving average cloud system designed to help traders visualize market trends, momentum shifts, and crossover signals in a clear, intuitive way. 🔑 Features Up to 5 customizable MA Clouds Choose between SMA or EMA for each moving average. Flexible input sources (Close, Open, High, Low, etc.). Adjustable lengths for full control over short-, medium-, and long-term trend analysis. Dynamic Cloud Coloring Clouds automatically change color to reflect bullish or bearish momentum. Customizable transparency and color schemes for each cloud. Crossover Signals Visual triangle markers appear when faster MAs cross above/below slower MAs. Bullish crossovers are shown below bars, bearish crossovers above bars. Alerts Ready 🚨 Built-in alert conditions for bullish and bearish crossovers (Cloud 1). Alerts trigger once per bar for cleaner signals. Clean Visuals Option to show/hide individual MA lines. Lightweight design optimized for clarity on any chart. 📊 How to Use Clouds act as dynamic support/resistance zones. Price above the cloud signals bullish momentum, while price below the cloud signals bearish conditions. Crossover signals help identify potential trend reversals or entry points. Use multiple clouds (short, medium, long-term) for multi-timeframe confluence. ⚠️ Disclaimer This script is for educational purposes only and not financial advice. Always combine with your own research and risk management before trading.Wskaźnik Pine Script®od irishborninvestor24
INE-VISION-PRO🎯 PROFESSIONAL EMA200 RIBBON INDICATOR ✨ FEATURES: • Colored ribbon between EMA200 High and EMA200 Close • Automatic trend detection (price above/below) • Customizable sources (High/Close adjustable) • Fully configurable colors • Intuitive interface 🎨 SMART COLORS: • GREEN: Price above EMA200 (bullish trend) • RED: Price below EMA200 (bearish trend) • GRAY: Neutral position 🔧 PARAMETERS: • Adjustable EMA200 length • Customizable High/Close sources • Organized color group • Ribbon display on/off 💡 Perfect for visually identifying trend zones and potential reversals on all timeframes. 📈 Developed for inemployable.com communityWskaźnik Pine Script®od inemployable1
EMA 1/8 Cross - Fixed Pip TP/SLEMA 1/8 Cross – Fixed Pip TP/SL This strategy is based on the crossover between EMA 8 and EMA 14 as trading signals: Long entry → when EMA 1 crosses above EMA 8 Short entry → when EMA 1 crosses below EMA 8 Features: Fixed pip Take Profit (TP) and Stop Loss (SL), fully adjustable in the settings. Customizable EMA Fast/Slow lengths for optimization. Pip size input to match different broker definitions (e.g., XAUUSD often uses 0.10 as one pip). Suitable for testing scalping or swing trading across multiple timeframes. ⚠️ Disclaimer: This script is intended for backtesting and educational purposes only. Please optimize parameters and apply proper risk management before using it on live accounts.Strategia Pine Script®od milikgroupy_tv1154
Simple EMA IndicatorSimple EMA Indicator by Ashwin Kumar. Includes all prominent timeframe moving averages on a single indicator.Wskaźnik Pine Script®od its_ashwin_kumar0
AltCoin & MemeCoin Index Correlation [Eddie_Bitcoin]🧠 Philosophy of the Strategy The AltCoin & MemeCoin Index Correlation Strategy by Eddie_Bitcoin is a carefully engineered trend-following system built specifically for the highly volatile and sentiment-driven world of altcoins and memecoins. This strategy recognizes that crypto markets—especially niche sectors like memecoins—are not only influenced by individual price action but also by the relative strength or weakness of their broader sector. Hence, it attempts to improve the reliability of trading signals by requiring alignment between a specific coin’s trend and its sector-wide index trend. Rather than treating each crypto asset in isolation, this strategy dynamically incorporates real-time dominance metrics from custom indices (OTHERS.D and MEME.D) and combines them with local price action through dual exponential moving average (EMA) crossovers. Only when both the asset and its sector are moving in the same direction does it allow for trade entries—making it a confluence-based system rather than a single-signal strategy. It supports risk-aware capital allocation, partial exits, configurable stop loss and take profit levels, and a scalable equity-compounding model. ✅ Why did I choose OTHERS.D and MEME.D as reference indices? I selected OTHERS.D and MEME.D because they offer a sector-focused view of crypto market dynamics, especially relevant when trading altcoins and memecoins. 🔹 OTHERS.D tracks the market dominance of all cryptocurrencies outside the top 10 by market cap. This excludes not only BTC and ETH, but also major stablecoins like USDT and USDC, making it a cleaner indicator of risk appetite across true altcoins. 🔹 This is particularly useful for detecting "Altcoin Season"—periods where capital rotates away from Bitcoin and flows into smaller-cap coins. A rising OTHERS.D often signals the start of broader altcoin rallies. 🔹 MEME.D, on the other hand, captures the speculative behavior of memecoin segments, which are often driven by retail hype and social media activity. It's perfect for timing momentum shifts in high-risk, high-reward tokens. By using these indices, the strategy aligns entries with broader sector trends, filtering out noise and increasing the probability of catching true directional moves, especially in phases of capital rotation and altcoin risk-on behavior. 📐 How It Works — Core Logic and Execution Model At its heart, this strategy employs dual EMA crossover detection—one pair for the asset being traded and one pair for the selected market index. A trade is only executed when both EMA crossovers agree on the direction. For example: Long Entry: Coin's fast EMA > slow EMA and Index's fast EMA > slow EMA Short Entry: Coin's fast EMA < slow EMA and Index's fast EMA < slow EMA You can disable the index filter and trade solely based on the asset’s trend just to make a comparison and see if improves a classic EMA crossover strategy. Additionally, the strategy includes: - Adaptive position sizing, based on fixed capital or current equity (compound mode) - Take Profit and Stop Loss in percentage terms - Smart partial exits when trend momentum fades - Date filtering for precise backtesting over specific timeframes - Real-time performance stats, equity tracking, and visual cues on chart ⚙️ Parameters & Customization 🔁 EMA Settings Each EMA pair is customizable: Coin Fast EMA: Default = 47 Coin Slow EMA: Default = 50 Index Fast EMA: Default = 47 Index Slow EMA: Default = 50 These control the sensitivity of the trend detection. A wider spread gives smoother, slower entries; a narrower spread makes it more responsive. 🧭 Index Reference The correlation mechanism uses CryptoCap sector dominance indexes: OTHERS.D: Dominance of all coins EXCLUDING Top 10 ones MEME.D: Dominance of all Meme coins These are dynamically calculated using: OTHERS_D = OTHERS_cap / TOTAL_cap * 100 MEME_D = MEME_cap / TOTAL_cap * 100 You can select: Reference Index: OTHERS.D or MEME.D Or disable the index reference completely (Don't Use Index Reference) 💰 Position Sizing & Risk Management Two capital allocation models are supported: - Fixed % of initial capital (default) - Compound profits, which scales positions as equity grows Settings: - Compound profits?: true/false - % of equity: Between 1% and 200% (default = 10%) This is critical for users who want to balance growth with risk. 🎯 Take Profit / Stop Loss Customizable thresholds determine automatic exits: - TakeProfit: Default = 99999 (disabled) - StopLoss: Default = 5 (%) These exits are percentage-based and operate off the entry price vs. current close. 📉 Trend Weakening Exit (Scale Out) If the position is in profit but the trend weakens (e.g., EMA color signals trend loss), the strategy can partially close a configurable portion of the position: - Scale Position on Weak Trend?: true/false - Scaled Percentage: % to close (default = 65%) This feature is useful for preserving profits without exiting completely. 📆 Date Filter Useful for segmenting performance over specific timeframes (e.g., bull vs bear markets): - Filter Date Range of Backtest: ON/OFF - Start Date and End Date: Custom time range OTHER PARAMETERS EXPLANATION (Strategy "Properties" Tab): - Initial Capital is set to 100 USD - Commission is set to 0.055% (The ones I have on Bybit) - Slippage is set to 3 ticks - Margin (short and long) are set to 0.001% to avoid "overspending" your initial capital allocation 📊 Visual Feedback and Debug Tools 📈 EMA Trend Visualization The slow EMA line is dynamically color-coded to visually display the alignment between the asset trend and the index trend: Lime: Coin and index both bullish Teal: Only coin bullish Maroon: Only index bullish Red: Both bearish This allows for immediate visual confirmation of current trend strength. 💬 Real-Time PnL Labels When a trade closes, a label shows: Previous trade return in % (first value is the effective PL) Green background for profit, Red for losses. 📑 Summary Table Overlay This table appears in a corner of the chart (user-defined) and shows live performance data including: Trade direction (yellow long, purple short) Emojis: 💚 for current profit, 😡 for current loss Total number of trades Win rate Max drawdown Duration in days Current trade profit/loss (absolute and %) Cumulative PnL (absolute and %) APR (Annualized Percentage Return) Each metric is color-coded: Green for strong results Yellow/orange for average Red/maroon for poor performance You can select where this appears: Top Left Top Right Bottom Left Bottom Right (default) 📚 Interpretation of Key Metrics Equity Multiplier: How many times initial capital has grown (e.g., “1.75x”) Net Profit: Total gains including open positions Max Drawdown: Largest peak-to-valley drop in strategy equity APR: Annualized return calculated based on equity growth and days elapsed Win Rate: % of profitable trades PnL %: Percentage profit on the most recent trade 🧠 Advanced Logic & Safety Features 🛑 “Don’t Re-Enter” Filter If a trade is closed due to StopLoss without a confirmed reversal, the strategy avoids re-entering in that same direction until conditions improve. This prevents false reversals and repetitive losses in sideways markets. 🧷 Equity Protection No new trades are initiated if equity falls below initial_capital / 30. This avoids overleveraging or continuing to trade when capital preservation is critical. Keep in mind that past results in no way guarantee future performance. Eddie Bitcoin Strategia Pine Script®od Eddie_Bitcoin106
Altcoins % Above Weekly EMA21 Top50-550The indicator shows the percentage of altcoins trading above the weekly EMA21 within a selected group (Top50, Top150, Top550, or Personal). It helps assess overall altcoin market strength, identify overbought/oversold zones, and spot potential entry or exit points.Wskaźnik Pine Script®od pstrike703
Daily High/Low (15m) + EMA Pre-Market H/L + ORBStraightforward: I built a swing-trading indicator with ChatGPT that plots 15-minute highs and lows, draws pre-market high/low lines, and adds a 15-minute opening-range breakout feature. Technical: Using ChatGPT, I developed a swing-trade indicator that calculates 15-minute highs/lows, overlays pre-market high and low levels, and includes a 15-minute Opening Range Breakout (ORB) module. Promotional: I created a ChatGPT-powered swing-trading indicator that maps 15-minute highs/lows, marks pre-market levels, and features a 15-minute Opening Range Breakout for clearer entries.Wskaźnik Pine Script®od sheazadjiwani36
JeropasMG v17This bot uses a martingale strategy applied to simple moving average crossover signals. When a buy or sell signal is generated, it opens a position with the configured base size. If the trade is a loser, the bot increases the size of the next entry by multiplying it by the defined factor (for example, x2), repeating the process until the maximum number of steps allowed is reached.Strategia Pine Script®od miketrokeZaktualizowano 3
EMAS + SuperTrend+ Key Levels SpacemanBTC IDWMEma 200 800 supertrend and key levels. Thanks to spaceman for making the code available.Wskaźnik Pine Script®od FilRex2231
RCI Buy/Sell Signals RCI Buy/Sell Signals — Dual-RCI State Machine with EMA Bias (Protected) A purpose-built signal tool that combines two RCI horizons with a deterministic state machine and an EMA-based background bias. It is not a simple mashup: the components are designed to work together so that trend context, timing, and exits form a coherent workflow. The code remains closed-source to protect a proprietary implementation; this description explains what it does and how the pieces interact so traders can evaluate it. What it does On-chart signals: Marks potential BUY/SELL entries and EXITs directly on the chart (markers are drawn with a −1 bar offset for readability). Trend bias at a glance: Background shading reflects EMA context: Green when price is above both EMA1 and EMA2 Red when price is below both EMA1 and EMA2 No shading otherwise (EMA lengths and timeframes are user-configurable.) Deterministic state machine: Ensures only one active side at a time (flat → long/short → exit), so entries/exits do not overlap or contradict each other. How it works (conceptual) Two-horizon RCI framework: A MID-RCI monitors regime transitions using mid-range thresholds. A LONG-RCI acts as a slower directional filter/validator. Two timing modes (you can enable either or both): Steadily — MID-RCI transitions across mid-band thresholds (e.g., around −50/50) govern entries; LONG-RCI direction is used to confirm/align. Above — LONG-RCI crosses its pivotal level (around zero) with directional agreement. These modes are integrated—not stacked randomly—so that one provides timing, the other directional context. Exits & risk guard: Exits trigger on MID-RCI reaching extreme bands (e.g., ±85) or when price violates a simple N-bar extremum stop (default: 20-bar low/high), whichever comes first. This makes exits explicit rather than relying on a trailing overlay. Why this is not “just a merge” The EMAs are not a separate indicator pasted on top; they only provide a binary bias that gates background shading and helps filter entries visually. The RCI pair is functionally split (timing vs. confirmation) and then synchronized through a state machine that prevents conflicting signals and enforces clean transitions. The script ships with signal placement discipline (−1 offset markers for clarity) and built-in exit logic based on RCI extremes plus a simple context stop—an integrated design choice, not an ad-hoc mix. Inputs (overview) Display: Show Entry Signals / Show Exit Signals / Show Background Context: EMA1/EMA2 lengths & timeframes (background bias only) RCI: Long/Mid lengths and source How to use Apply the script on a clean chart (no other indicators unless you explain why). Use the background color as high-level bias, then use the on-chart signals for timing. Optionally set alerts with “Any alert() function call” to receive signal notifications. Confirm with your own risk management, liquidity checks, and higher-timeframe confluence. Notes on publication (for moderators & traders) Closed-source rationale: The specific RCI ranking/threshold scheme and the state-machine selection logic are part of ongoing proprietary research; the code is protected. This description details the concepts and interactions sufficiently to understand what the script does and how components work together, while preserving implementation specifics. Disclaimer For educational/informational purposes only; not financial advice. Test thoroughly before live use. Trading involves risk.Wskaźnik Pine Script®od toshival03435
Infinite EMA with Alpha Control♾️ Infinite EMA with Alpha Control What Makes This EMA "Infinite"? Unlike traditional EMA indicators that are limited to typical periods (1-5000), this Infinite EMA breaks all boundaries. You can create EMAs with periods of 1,000, 10,000, or even 1,000,000 bars - that's why it's called "infinite"! Also Infinite EMA starts working immediately from the very first bar on your chart Why This EMA is "Infinite": 1. Mathematically: When N → ∞, alpha → 0, meaning infinitely long "memory" 2. Practically: You can set any period - even 100,000 bars 3. Flexibility: Alpha allows precise control over the "forgetting speed" How Does It Work? The magic lies in the Alpha parameter. While regular EMAs use fixed formulas, this indicator gives you direct control over the EMA's "memory" through Alpha values: • High Alpha (0.1-0.2): Fast reaction, short memory • Medium Alpha (0.01-0.05): Balanced response • Low Alpha (0.0001-0.001): Extremely slow reaction, very long memory • Ultra-low Alpha (0.000001): Almost frozen in time The Mathematical Formula: Alpha = 2 / (Period + 1) This means you can achieve any EMA period by adjusting Alpha, giving you infinite flexibility! Expanded "Infinite EMA" Table: Period EMA (N) - Alpha (Rounded) - Alpha (Exact) - Description 10 - 0.1818 - 0.181818... - Fast EMA 20 - 0.0952 - 0.095238... - Short-term 50 - 0.0392 - 0.039215... - Medium-term 100 - 0.0198 - 0.019801... - Long-term 200 - 0.0100 - 0.009950... - Standard long-term 500 - 0.0040 - 0.003996... - Very long-term 1,000 - 0.0020 - 0.001998... - Super long-term 2,000 - 0.0010 - 0.000999... - Ultra long-term 5,000 - 0.0004 - 0.000399... - Mega long-term 10,000 - 0.0002 - 0.000199... - Giga long-term 25,000 - 0.00008 - 0.000079... - Century-scale EMA 50,000 - 0.00004 - 0.000039... - Practically motionless 100,000 - 0.00002 - 0.000019... - "Glacial" EMA 500,000 - 0.000004 - 0.000003... - Geological timescale 1,000,000 - 0.000002 - 0.000001... - Approaching constant 5,000,000 - 0.0000004 - 0.0000003... - Virtually static 10,000,000 - 0.0000002 - 0.0000001... - Nearly flat line 100,000,000 - 0.00000002 - 0.00000001... - Mathematical infinity Formula: Alpha = 2/(N+1) where N is the EMA period Key Features: Dual EMA System: Run fast and slow EMAs simultaneously Crossover Signals: Automatic buy/sell signals with customizable alerts Alpha Control: Direct mathematical control over EMA behavior Infinite Periods: From 1 to 100,000,000+ bars Visual Customization: Colors, fills, backgrounds, signal sizes Instant Start: Works accurately from the very first bar Update Intervals: Control calculation frequency for noise reduction Why Choose Infinite EMA? 1. Unlimited Flexibility: Any period you can imagine 2. Mathematical Precision: Direct alpha control for exact behavior 3. Professional Grade: Suitable for all trading styles 4. Easy to Use: Simple settings with powerful results 5. No Warm-up Period: Accurate values from bar #1 Simple Explanation: Think of EMA as a "memory system": • High Alpha = Short memory (forgets quickly, reacts fast) • Low Alpha = Long memory (remembers everything, moves slowly) With Infinite EMA, you can set the "memory length" to anything from seconds to centuries! ⚡ Instant Start Feature - EMA from First Bar Immediate Calculation from Bar #1 Unlike traditional EMA indicators that require a "warm-up period" of N bars before showing accurate values, Infinite EMA starts working immediately from the very first bar on your chart. How It Works: Traditional EMA Problem: • Standard 200-period EMA: Needs 200+ bars to become accurate • First 200 bars: Shows incorrect/unstable values • Result: Large portions of historical data are unusable Infinite EMA Solution: Bar #1: EMA = Current Price (perfect starting point) Bar #2: EMA = Alpha × Price + (1-Alpha) × Previous EMA Bar #3: EMA = Alpha × Price + (1-Alpha) × Previous EMA ...and so on Key Benefits: No Warm-up Period: Start trading signals from day one Full Chart Coverage: Every bar has a valid EMA value Historical Accuracy: Backtesting works on entire dataset New Markets: Works perfectly on newly listed assets Short Datasets: Effective even with limited historical data Practical Impact: Scenario Traditional EMA Infinite EMA New cryptocurrency Unusable for first 200 days ✅ Works from day 1 Limited data (< 200 bars) Inaccurate values ✅ Fully functional Backtesting Must skip first 200 bars ✅ Test entire history Real-time trading Wait for stabilization ✅ Trade immediately Technical Implementation: if barstate.isfirst EMA := currentPrice // Perfect initialization else EMA := alpha × currentPrice + (1-alpha) × previousEMA This smart initialization ensures mathematical accuracy from the very first calculation, eliminating the traditional EMA "ramp-up" problem. Why This Matters: For Backesters: Use 100% of available data For Live Trading: Get signals immediately on any timeframe For Researchers: Analyze complete datasets without gaps Bottom Line: Infinite EMA is ready to work the moment you add it to your chart - no waiting, no warm-up, no exceptions! Unlike traditional EMAs that require a "warm-up period" of 200+ bars before showing accurate values, Infinite EMA starts working immediately from bar #1. This breakthrough eliminates the common problem where the first portion of your chart shows unreliable EMA data. Whether you're analyzing a newly listed cryptocurrency, working with limited historical data, or backtesting strategies, every single bar provides mathematically accurate EMA values. No more waiting periods, no more unusable data sections - just instant, reliable trend analysis from the moment you apply the indicator to any chart. 🔄 Update Interval Bars Feature The Update Interval feature allows you to control how frequently the EMA recalculates, providing flexible noise filtering without changing the core mathematics. Set to 1 for standard behavior (updates every bar), or increase to 5-10 for smoother signals that update less frequently. Higher intervals reduce market noise and false signals but introduce slightly more lag. This is particularly useful on volatile timeframes where you want the EMA's directional bias without every minor price fluctuation affecting the calculation. Perfect for swing traders who prefer cleaner, more stable trend lines over hyper-responsive indicators. Conclusion The Infinite EMA transforms the traditional EMA from a fixed-period tool into a precision instrument with unlimited flexibility. By understanding the Alpha-Period relationship, traders can create custom EMAs that perfectly match their trading style, timeframe, and market conditions. The "infinite" nature comes from the ability to set any period imaginable - from ultra-fast 2-bar EMAs to glacially slow 10-million-bar EMAs, all controlled through a single Alpha parameter. ________________________________________ Whether you're a beginner looking for simple trend following or a professional researcher analyzing century-long patterns, Infinite EMA adapts to your needs. The power of infinite periods is now in your hands! 🚀 Go forward to the horizon. When you reach it, a new one will open up. - J. P. Morgan Wskaźnik Pine Script®od SesilyaZaktualizowano 22237
Script_Algo - High Low Range MA Crossover Strategy🎯 Core Concept This strategy uses modified moving averages crossover, built on maximum and minimum prices, to determine entry and exit points in the market. A key advantage of this strategy is that it avoids most false signals in trendless conditions, which is characteristic of traditional moving average crossover strategies. This makes it possible to improve the risk/reward ratio and, consequently, the strategy's profitability. 📊 How the Strategy Works Main Mechanism The strategy builds 4 moving averages: Two senior MAs (on high and low) with a longer period Two junior MAs (on high and low) with a shorter period Buy signal 🟢: when the junior MA of lows crosses above the senior MA of highs Sell signal 🔴: when the junior MA of highs crosses below the senior MA of lows As seen on the chart, it was potentially possible to make 9X on the WIFUSDT cryptocurrency pair in just a year and a half. However, be careful—such results may not necessarily be repeated in the future. Special Feature Position closing priority ❗: if an opposite signal arrives while a position is open, the strategy first closes the current position and only then opens a new one ⚙️ Indicator Settings Available Moving Average Types EMA - Exponential MA SMA - Simple MA SSMA - Smoothed MA WMA - Weighted MA VWMA - Volume Weighted MA RMA - Adaptive MA DEMA - Double EMA TEMA - Triple EMA Adjustable Parameters Senior MA Length - period for long-term moving averages Junior MA Length - period for short-term moving averages ✅ Advantages of the Strategy 🛡️ False Signal Protection - using two pairs of modified MAs reduces the number of false entries 🔄 Configuration Flexibility - ability to choose MA type and calculation periods ⚡ Automatic Switching - the strategy automatically closes the current position when receiving an opposite signal 📈 Visual Clarity - all MAs are displayed on the chart in different colors ⚠️ Disadvantages and Risks 📉 Signal Lag - like all MA-based strategies, it may provide delayed signals during sharp movements 🔁 Frequent Switching - in sideways markets, it may lead to multiple consecutive position openings/closings 📊 Requires Optimization - optimal parameters need to be selected for different instruments and timeframes 💡 Usage Recommendations Backtest - test the strategy's performance on historical data Optimize Parameters - select MA periods suitable for the specific trading instrument Use Filters - add additional filters to confirm signals Manage Risks - always use stop-loss and take-profit orders. You can safely connect to the exchange via webhook and enjoy trading. Good luck and profits to everyone!!Strategia Pine Script®od Script_Algo11120
EMA's Rainbow: 5/10/20/50/100/150/200/250All major EMA's color coded to look like a rainbow, and configurableWskaźnik Pine Script®od paradigmseo4