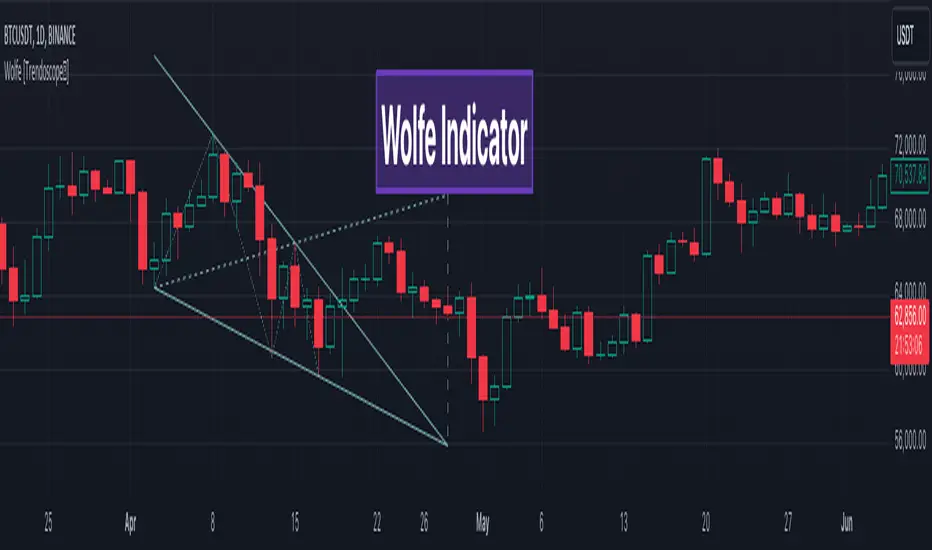
Wolfe Scanner (Multi - zigzag) [HeWhoMustNotBeNamed]Before getting into the script, I would like to explain bit of history around this project. Wolfe was in the back of my mind for some time and I had several attempts so far.
🎯Initial Attempt
When I first developed harmonic patterns, I got many requests from users to develop script to automatically detect Wolfe formation. I thought it would be easy and started boasting everywhere that I am going to attempt this next. However I miserably failed that time and started realising it is not as sim
Wskaźniki i strategie
TASC 2022.06 Ehlers Loops█ OVERVIEW
TASC's June 2022 edition Traders' Tips includes an article by John Ehlers titled "Ehlers Loops. Part 1". This is the code implementing the price-volume Ehlers Loops he introduced in the publication.
█ CONCEPTS
John Ehlers developed Ehlers loops as a tool to visualize the performance of one data stream versus another, both filtered and scaled. In this article, the author applies his concept to exploit and/or dispel the dogmatic principles of reliable price-volume relatio
Lowest / Highest From WidgetRecent events inspired me to create a small widget that allows you to spot from when current value is lowest / highest.
Just add it to chart and script will compute most recent day when price was higher / lower than current and it will display:
Line coming from that value to the current one
A table with previous low/high information
Thanks to @MUQWISHI to help me coding it.
Disclaimer
Please remember that past performance may not be indicative of future results.
Due to various fact
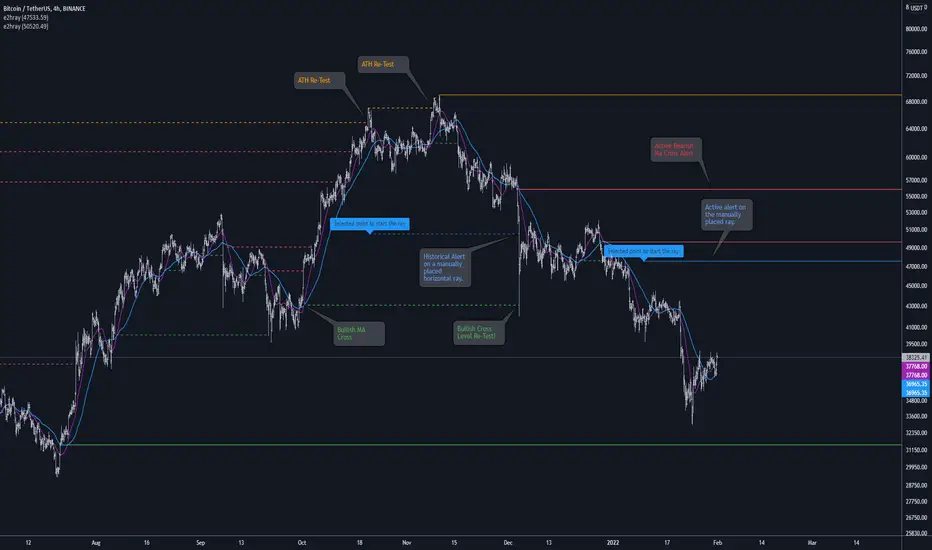
[e2] Drawing Library :: Horizontal Ray█ OVERVIEW
Library "e2hray"
A drawing library that contains the hray() function, which draws a horizontal ray/s with an initial point determined by a specified condition. It plots a ray until it reached the price. The function let you control the visibility of historical levels and setup the alerts.
█ HORIZONTAL RAY FUNCTION
hray(condition, level, color, extend, hist_lines, alert_message, alert_delay, style, hist_style, width, hist_width)
Parameters:
condition : Boolean condition th
Numbers RenkoRenko with Volume and Time in the box was developed by David Weis (Authority on Wyckoff method) and his student.
I like this style (I don't know what it is officially called) because it brings out the potential of Wyckoff method and Renko, and looks beautiful.
I can't find this style Indicator anywhere, so I made something like it, then I named "Numbers Renko" (数字 練行足 in Japanese).
Caution : This indicator only works exactly in Renko Chart.
////////// Numbers Renko General Settings /////////
3D Sine WaveIt's a 3D sine wave! Cool!
I made a cube follow a sine wave, it doesn't reflect any data on the chart, it just looks pretty. There are some settings to play around with, too.
You could plug the cube into any input you like, just replace the 'wave' variable with whatever you want.
Watch it on the 1 second timeframe!
HTF Liquidity Levels█ OVERVIEW
The indicator introduces a new representation of the previous days, weeks, and months highs & lows ( DWM HL ) with a focus on untapped levels.
█ CONCEPTS
Untapped Levels
It is popularly known that the liquidity is located behind swing points or beyond higher time frames highs/lows (in a sense, an intraday swing point is a day high/low). These key areas are said "liquid" because of the accumulation of resting orders, mainly in the form of stop-loss orders. And this more si
Portfolio Laboratory [Kioseff Trading]Hello!
This script looks to experiment with historical portfolio performance. However, a hypothetical cash balance is not used; weighted percentage increases and decreases are used.
You can select up to 10 assets to include in the portfolio. Long and short positions are possible.
Show in the image are the portfolio's weight, the total return of the portfolio and the total return of the asset on the chart over the selected timeframe.
Shown in the image above are the constituents of
Fair Value Gap█ OVERVIEW
This indicator displays the Fair Value Gap of the current timeframe and an additional higher timeframe. For each FVG the gaps act as targets creating bullish and bearish gaps that are often filled.
█ FEATURES
MTF Options
MidPoint FIll
Delete Old On Fill
Label FVG Timeframe
MTF Options
Enabling the MTF Options will allow the user to use the "MTF Timeframe" setting to choose what HTF Fair Value Gap to display
MidPoint FIll
A line plot at the Half way point will be i
Tick travel ⍗This script is a further exploration of 'ticks' (only on realtime - live bars), based on my previous script:
- www.tradingview.com -
What are 'ticks'?
... Once the script’s execution reaches the rightmost bar in the dataset, if trading is currently active on the chart’s symbol,
then Pine indicators will execute once every time an update occurs, i.e., price or volume changes ...
(www.tradingview.com)
This script has 2 parts:
1) Option: ' Tick up/down'
This is a further progression o
Rolling VWAP█ OVERVIEW
This indicator displays a Rolling Volume-Weighted Average Price. Contrary to VWAP indicators which reset at the beginning of a new time segment, RVWAP calculates using a moving window defined by a time period (not a simple number of bars), so it never resets.
█ CONCEPTS
If you are not already familiar with VWAP, our Help Center will get you started.
The typical VWAP is designed to be used on intraday charts, as it resets at the beginning of the day. Such VWAPs cann
Earnings Price Move Cheat Sheet [KT]Hello!
This script looks to distinguish replicable sequences and correlations between earnings releases and price. The indicator calculates the average 1-session to 20-session performance of an asset prior to an earnings release, and the 1-session to 20-session performance of an asset subsequent an earnings release.
You can select the number of sessions the script calculates for asset performance.
In the image above the script calculates the average 1-session performance following an
VIX Cheat SheetHello!
This indicator - "VIX Cheat Sheet" - performs several calculations for $VIX against the asset on your chart. However, using $VIX as a risk proxy or volatility metric often fails beyond large-cap U.S equities. To remedy this, the VixFix indicator is included in the script; you can select whether the script performs calculations for an asset against $VIX or against VixFix (i.e. Forex, Crypto)
Measured are: $VIX correlation to an asset's price fluctuations, the average close-to-close gain/
Wedge and Flag Finder (Multi - zigzag)Here is a small attempt to automatically identify wedges and flags.
Tradingview standard wedge checks for only 4 pivots. In this version, I have considered 5 pivots instead - which can help reduce noise as 4 pivots forming wedge can be quite common. In future, will also try to add more pivots in pattern recognition to make the signal more accurate.
If wedge comes with a tail, then it is marked as flag :)
Settings are quite simple and they are as shown below
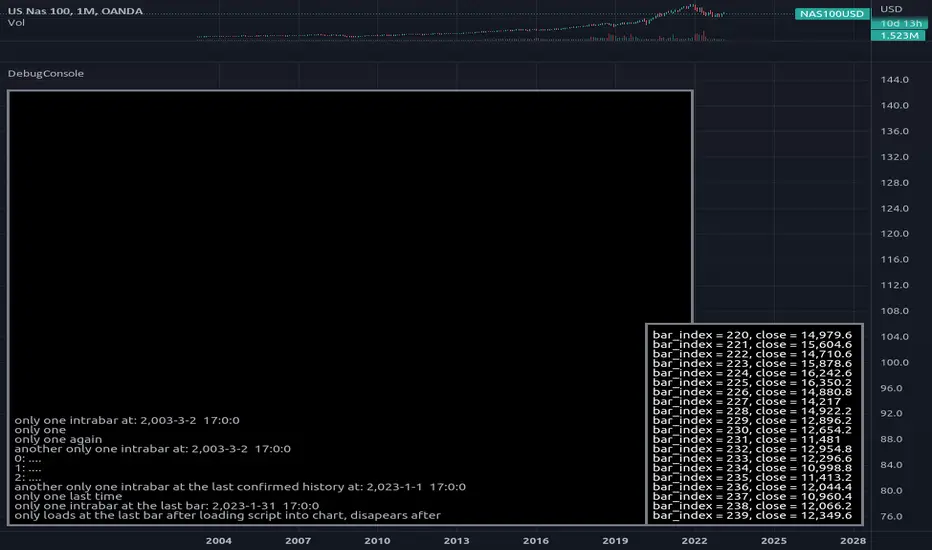
DebugConsoleLibrary "DebugConsole"
Methods for debuging/output into a table, console like style.
init(size) initiate property variables.
Parameters:
size : int, console line size.
Returns: tuple, table and string array.
queue(console_id, new_line) Regular Queue, will be called once every bar its called.
Parameters:
console_id : string array, console configuration array.
new_line : string, with contents for new line.
Returns: void.
queue_one(console_id, new_line) Queue only one time
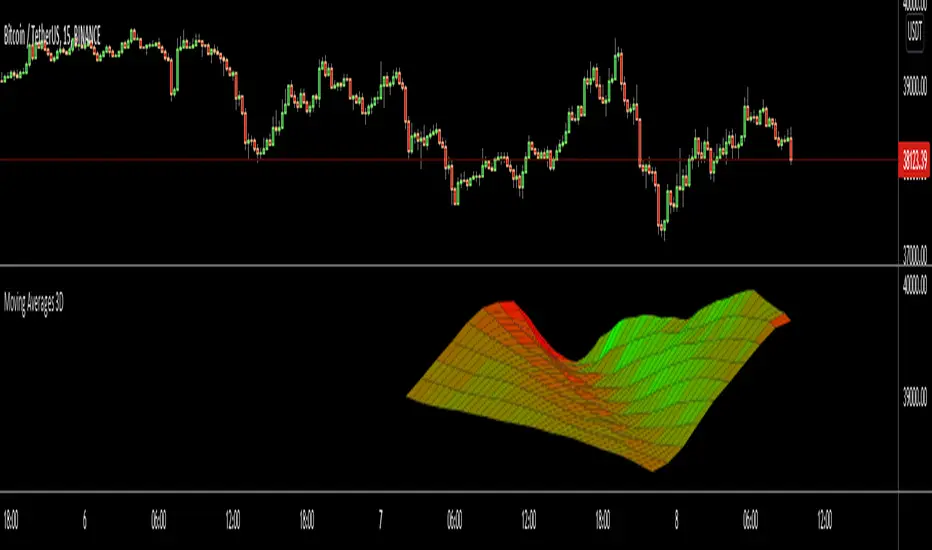
Moving Averages 3DHello All,
This is an experimental work to show 10 moving averages in 3D by using linefill.new() feature of the Pine language.
You can set moving average type as Simple (SMA) or Exponential (EMA)
You can set "Starting Length" and set the "Step" to calculate other lengths. For example; if "Starting Length" is 10 and "step" is 5 then the lengths are 10, 15, 20, 25...
You can set the colors as Red, Green, Blue for each direction. And you can change the width. you can see the examples below
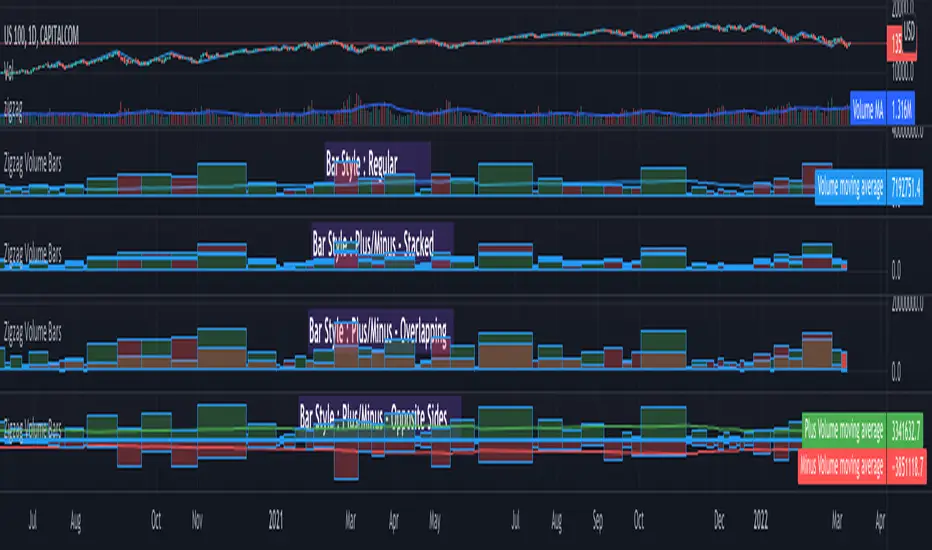
Zigzag Volume BarsBack to my favourite topic - Zigzags.
Here is an indicator which can help you visualise volume data on Zigzag swing highs and lows.
Settings are pretty simple and provides variety of display options
Display options are as demonstrated in the chart has following main types.
Regular
Plus/Minus - Stacked
Plus/Minus - Overlapping
Plus/Minus - Opposite Sides
Apart from the main display types, stacked display has several sub-types which determine whether to place green bar belo
MACD-X Overlay, More Than MACD by DGTMoving Average Convergence Divergence – MACD
The most popular indicator used in technical analysis , the moving average convergence divergence ( MACD ), created by Gerald Appel. MACD is a trend-following momentum indicator , designed to reveal changes in the strength, direction, momentum, and duration of a trend in a financial instrument’s price
Historical evolution of MACD ,
- Gerald Appel created the MACD line,
- Thomas Aspray added the histogram feature to MACD
- Giorgos E. Siligardos c
BjCandlePatternsLibrary "BjCandlePatterns"
Patterns is a Japanese candlestick pattern recognition Library for developers. Functions here within detect viable setups in a variety of popular patterns. Please note some patterns are without filters such as comparisons to average candle sizing, or trend detection to allow the author more freedom.
doji(dojiSize, dojiWickSize) Detects "Doji" candle patterns
Parameters:
dojiSize : (float) The relationship of body to candle size (ie. body is 5% of total
RedK Momentum Bars (RedK Mo_Bars)Momentum Bars (Mo_Bars) offers a different way to visualize (relative) momentum - and uses some simple TA concepts to provide a different perspective into how we read momentum changes and incorporate that in our trading.
The idea here (and the script itself) is really super simple, and is (very loosely) inspired by Elder's Impulse System (EIS) - then evolved to leverage some other concepts, and to become less cluttering and "easier to read".
The construction of the Mo_Bars
--------------------
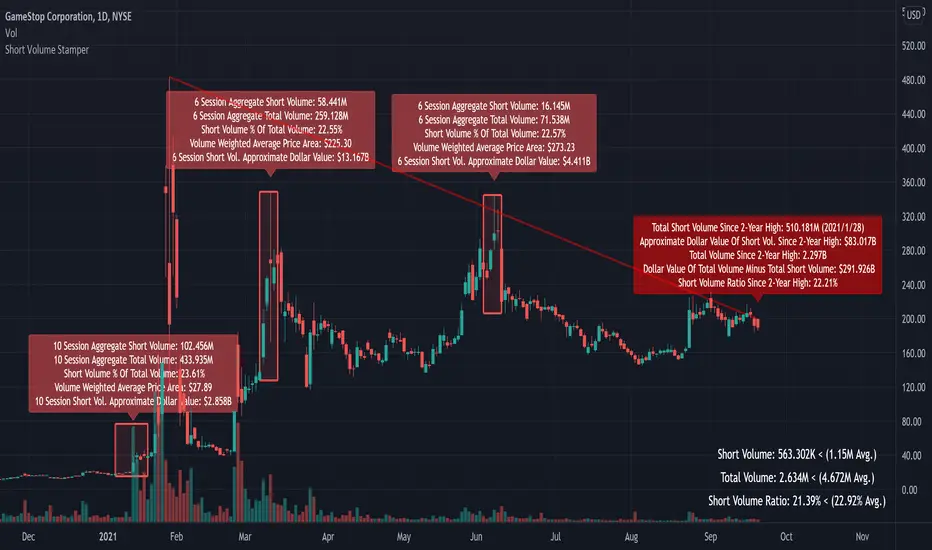
Short Volume StamperHello!
BE SURE TO RUN THE SCRIPT WITH BAR REPLAY TO SEE WHAT IT DOES! I hope you like it!
This script calculates the total short volume, total volume, and the short volume / total volume ratio since the 2-year high price. In addition, the approximate dollar value of all short volume since the 2-year high, and the approximate dollar value of all non-short sell volume since the 2-year high is calculated using VWAP. A red line (short interest ratio >= 20%) connects the 2-year high to current sess
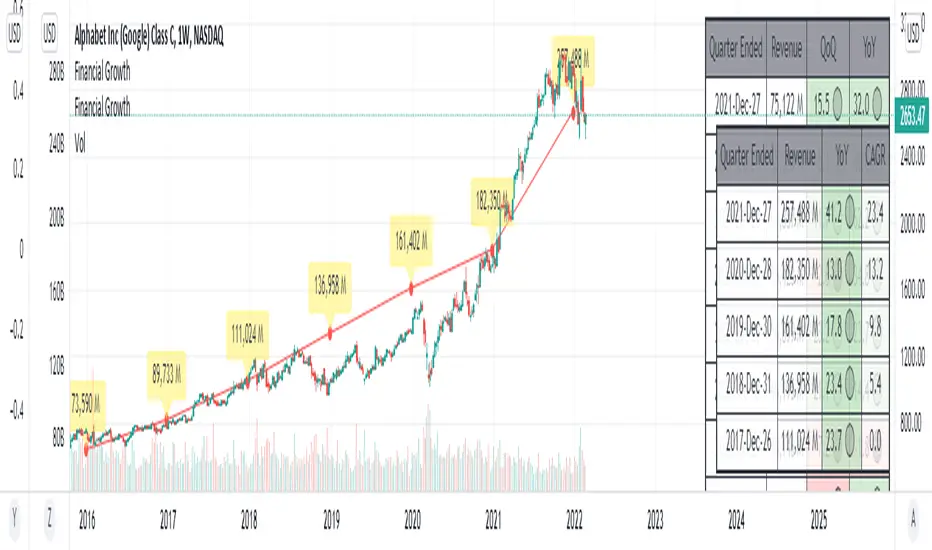
Financial GrowthThis indicator will acquire the financial data provided by Tradview.
the data is compare between Quarter, Annual and TTM in term of percent of growth.
YoY, QoQ and CAGR is also available by this script (The minimum is 4).
in addition, ploting of data, label and table also available (you can check the mark to toggle on / off).
Data : Revenue, Net Income, EBITDA, EPS, DVPS, Free Cash Flow and Forward PE .
How to use it.
just select the financial data, period and size of data to compare.
KCGmut“KCGmut” stands for “Mutations Of Keltner Center Of Gravity Channel”.
After adding the ‘KeltCOG Width’ label to the KeltCOG, I got the idea of creating a subpanel indicator to show the development of the width-percent in previous periods. After some more thinking, I decided that the development of the COG-width-percent should also be reported and somehow the indicator should report whether the close is over (momentum is up), in (momentum is sideways) or under (momentum is down) the COG ( This is
RedK Volume-Accelerated Directional Energy Ratio (RedK VADER)The Volume-Accelerated Directional Energy Ratio (VADER) makes use of price moves (displacement) and the associated volume (effort) to estimate the positive (buying) and negative (selling) "energy" behind the scenes, enabling traders to "read the market action" in more details and adjust their trading decisions accordingly.
How does VADER work?
------------------------------------
I have always been a fan of technical analysis concepts that are simple, and that integrate both price action and vo