DMT Autobot StrategyDMT its a Modified homemade Trend Reversal Indicator base on Volatility & Average true range
You have to have a defined trading plan and you also have to believe it. For this, it is necessary to have coordination and harmony between the conscious and subconscious part of the individual, That is why it is so difficult for most retail traders to be profitable
ĐΜŦ is designed to identify spots in the market that offer some of the most suitable buy and sell scalping trading opportunities plus swing trading over runs.
ĐΜŦ is comprised of three inputs, which are helping to identify the volatility of a security. To determine the level of volatility there are three ranges included in the equation
Input 1 - Current Day's Range
Input 2 - How High has the security risen from the previous day's close
Input 3 - How low has the security dropped from the previous day's close
One of the greatest challenges for new traders is avoiding drawdowns on their account. Drawdowns are what kills a trader's ability to consistently earn over the long haul and creates enormous emotional pain and turmoil.
Drawdowns are a result of two factors:
(1) over-leverage and
(2) extremely volatile stocks. One could argue that if you get to number 1 right, the volatility is irrelevant; however, these two elements are not always mutually exclusive.
HOW TO USE
Buy and sell signals for entry
and 1 take profit levels
1 adjustable stop loss level for each direction.
easy to set up with Autobot service and alert system trading
Dynamic

Support Resistance - DynamicThis is Dynamic Support / Resistance script.
How it Works?
It finds Pivot Points and creates channels for each Pivot Point. Channel size is calculated by (Highest - Lowest) * %Channel_size in Loopback Period. After creating channels it calculates that how many Pivot Points in the channels. more Pivot Points in channel means stronger Support/Resistance. in the option menu there is S/R Strength, this is the minimum number of Pivot Points that each channel must contain to be S/R. calculation starts from last pivot point and go back for "loopback period" which is 300 by default. so last Pivot Points have more priority. Finally after calculating Support/Resistance it draws lines.
Number of Support/Resistance line is Dynamic and up to 20 lines, that means number of lines changes dynamically. you can see how the script puts Suppport/Resistance lines dynamically by "Replay" button. (if I have time I will try to put a video)
Currently the scripts checks up to 40 pivot points in loopback period. it shows up to 20 S/Rs only for visible area in the chart.
There is option to Show S/R lines as Solid, Dotted or Dashed.
Enjoy!

ATR based Stop and Take-Profit levels in realtime Little tool to quickly identify stops and take-profit levels based on Average True Range. User can change ATR multipiers, as well as the ATR length used. Green and red lines show these levels; plot is visible over last 8 bars only to reduce clutter. Label showing the current ATR, up above the last bar

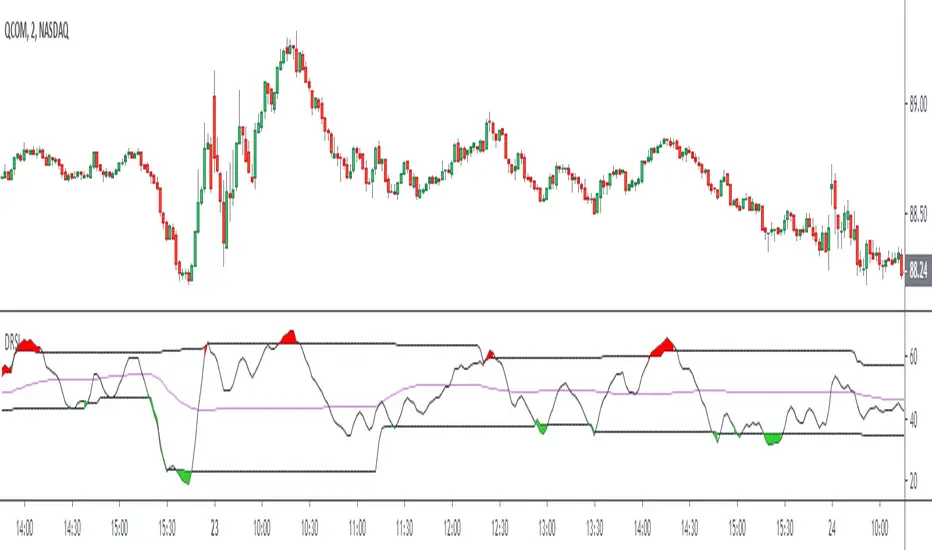
Dynamic RSIThe Dynamic RSI indicator is a kind of exponential RSI. The overbought and oversold levels (respectively HiLine and LoLine) are calculated according to the recent highest and lowest values of the Dynamic RSI line.
DMT AutobotYou have to have a defined trading plan and you also have to believe it. For this, it is necessary to have coordination and harmony between the conscious and subconscious part of the individual, That is why it is so difficult for most retail traders to be profitable
ĐΜŦ is designed to identify spots in the market that offer some of the most suitable buy and sell scalping trading opportunities.
ĐΜŦ is comprised of three inputs, which are helping to identify the volatility of a security. To determine the level of volatility there are three ranges included in the equation
Input 1 - Current Day's Range
Input 2 - How High has the security risen from the previous day's close
Input 3 - How low has the security dropped from the previous day's close
One of the greatest challenges for new traders is avoiding drawdowns on their account. Drawdowns are what kills a trader's ability to consistently earn over the long haul and creates enormous emotional pain and turmoil.
Drawdowns are a result of two factors:
(1) over leverage and
(2) extremely volatile stocks. One could argue that if you get to number 1 right, the volatility is irrelevant; however, these two elements are not always mutually exclusive.
HOW TO USE
Buy and sell signals for entry
and 7 take profit levels where you can set alerts for autobot trading or manual trading
also adjustable stop lost level for each direction .
easy to setup with autobot service and alert system trading .

TradingView Alerts to MT4 MT5 + dynamic variables NON-REPAINTINGAccidentally, I’m sharing open-source profitable Forex strategy. Accidentally, because this was aimed to be purely educational material. A few days ago TradingView released a very powerful feature of dynamic values from PineScript now being allowed to be passed in Alerts. And thanks to TradingConnector, they could be instantly executed in MT4 or MT5 platform of any broker in the world. So yeah - TradingConnector works with indices and commodities, too.
The logic of this EURUSD 6h strategy is very simple - it is based on Stochastic crossovers with stop-loss set under most recent pivot point. Setting stop-loss with surgical precision is possible exactly thanks to allowance of dynamic values in alerts. TradingConnector has been also upgraded to take advantage of these dynamic values and it now enables executing trades with pre-calculated stop-loss, take-profit, as well as stop and limit orders.
Another fresh feature of TradingConnector, is closing positions only partly - provided that the broker allows it, of course. A position needs to have trade_id specified at entry, referred to in further alerts with partial closing. Detailed spec of alerts syntax and functionalities can be found at TradingConnector website. How to include dynamic variables in alert messages can be seen at the very end of the script in alertcondition() calls.
The strategy also takes commission into consideration.
Slippage is intentionally left at 0. Due to shorter than 1 second delivery time of TradingConnector, slippage is practically non-existing. This can be achieved especially if you’re using VPS server, hosted in the same datacenter as your brokers’ servers. I am using such setup, it is doable. Small slippage and spread is already included in commission value.
This strategy is NON-REPAINTING and uses NO TRAILING-STOP or any other feature known to be faulty in TradingView backtester. Does it make this strategy bulletproof and 100% success-guaranteed? Hell no! Remember the no.1 rule of backtesting - no matter how profitable and good looking a script is, it only tells about the past. There is zero guarantee the same strategy will get similar results in the future.
To turn this script into study so that alerts can be produced, do 2 things:
1. comment “strategy” line at the beginning and uncomment “study” line
2. comment lines 54-59 and uncomment lines 62-65.
Then add script to the chart and configure alerts.
This script was build for educational purposes only.
Certainly this is not financial advice. Anybody using this script or any of its parts in any way, must be aware of high risks connected with trading.
Thanks @LucF and @a.tesla2018 for helping me with code fixes :)

🧬dRSI Signals Internal Beta Test by Cryptorthyhms🧬dRSI Signals Internal Beta Test by Cryptorthyhms
Test release, for internal testing only. Debut release soon!
Thank you all for your patience!

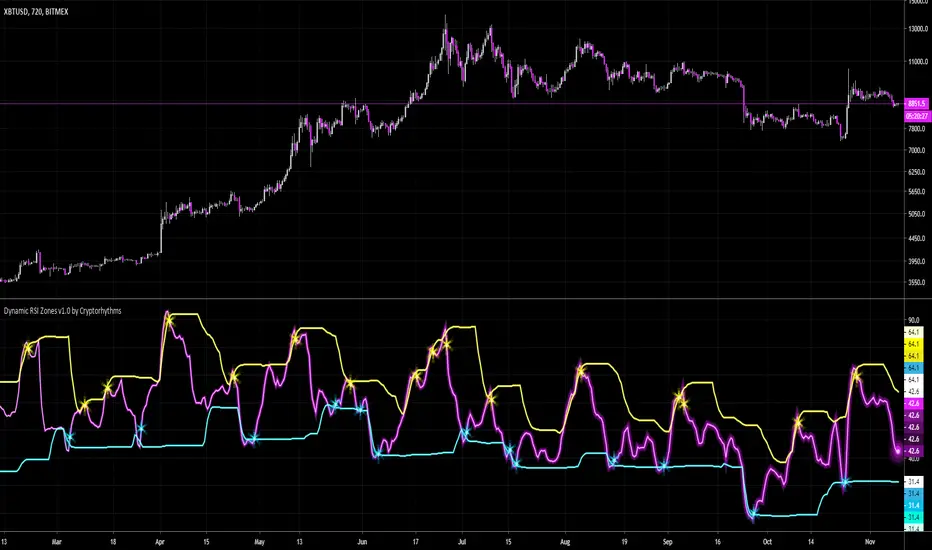
🧬Dynamic RSI Zones v1.0 by Cryptorhythms🧬Dynamic RSI Zones v1.0 by Cryptorhythms
Intro
There are a few adaptive RSI indicators already out there, and they got me thinking. They didn't really do what I desired, or do it profitably. So I had some hunches on how I could create my own and here it is!
Description
It is setup for all major timeframes, though for now its best on 30m or higher. Supported timeframes include: 1m, 3m, 5m, 15m, 30m, 1h, 2h, 4h, 12h, and daily. I am working on settings for 2 day, 3 day and weekly as well for a future update.
This way no more entering settings when changing timeframes, which can mean a lot when seconds matter.
You can however disable the automatic settings if you wish to experiment on a different timeframe or coin/market.
Instructions
Detailed instructions will follow in a separate post for brevity.
Future Updates
There will be many upcoming updates and improvements. These will include some graphical improvements, better performance on lower timeframes, additional timeframes added for XBTUSD, support for additional coins (ETH, LTC, XRP, etc are all coming).
Remember the settings are currently adapted for XBTUSD only!
👍 Enjoying this indicator or find it useful? Please give me a like and follow! I post crypto analysis, price action strategies and free indicators regularly.
💬 Questions? Comments? Want to get access to an entire suite of proven trading indicators? Come visit us on telegram and chat. We make timely posts about the market, news, and strategy everyday. Our community isn't open only to subscribers - everyone is welcome to join.
Dynamic VolumeDynamic Volume indicator for large mathematical calculations into the price action gives you the right information to be able to decide when to enter or exit the market base on Volume.

How To Use Dynamic ZonesExample of how to apply and use Dynamic Zones with an indicator by injecting it's source into my adaptation of the original idea by Leo Zamansky, Ph.D., and David Stendahl.
• Load your desired oscillating indicator on your chart (CCI, RSI, etc).
• Load my "How To Use Dynamic Zones" indicator on your chart.
• In the "How To Use Dynamic Zones" indicator settings choose your desired oscillating indicator as the Oscillator Source.
You will now have dynamic overbought and oversold levels. I have also included alerts which may be used to indicate when these conditions occur.
If desired you may repeat the above process by loading additional indicators along with additional copies of my indicator to use with each oscillator.
Oscillator Source: CLOSE uses your chosen indicator as a source or you may use price as a source
Sample Length: 70 uses number of previous values for evaluating
Hi is Above X% of Sample: 88 sets overbought zone
Lo is Below X% of Sample: 88 sets oversold zone
The simplest explanation of what these default settings are doing is that they take 70 previous values of your chosen indicator, then create an overbought level that is above 88% of those previous values and an oversold level that is below 88% of those previous values. As new bars form the levels are dynamically reevaluated and updated.
---
"This investing style follows a very simple form of logic: Enter the market only when an oscillator has moved far above or below traditional trading levels. However, these oscillator driven systems lack the ability to evolve with the market because they use fixed buy and sell zones. Traders typically use one set of buy and sell zones for a bull market and substantially different zones for a bear market. And therein lies the problem.
Once traders begin introducing their market opinions into trading equations, by changing the zones, they negate the system’s mechanical nature. The objective is to have a system automatically define its own buy and sell zones and thereby profitably trade in any market — bull or bear. Dynamic zones offer a solution to the problem of fixed buy and sell zones for any oscillator-driven system."
Reference: Stocks & Commodities V15:7 (306-310): Dynamic Zones by Leo Zamansky, Ph.D., and David Stendahl
---
NOTICE: This is an example script and not meant to be used as an actual strategy. By using this script or any portion thereof, you acknowledge that you have read and understood that this is for research purposes only and I am not responsible for any financial losses you may incur by using this script!

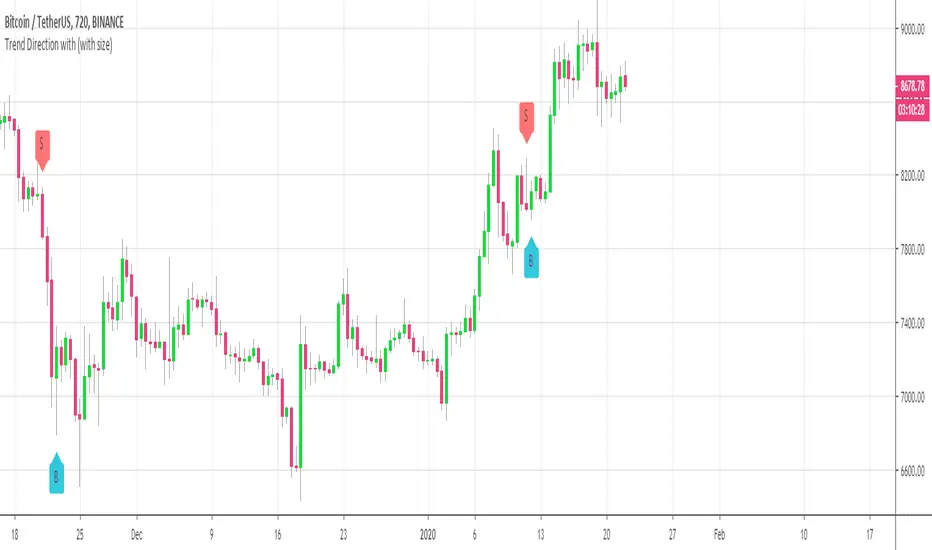
Customizable Trend Direction (Open-Source)Hello everyone
I received a ton of requests for this script so I decided to share it
I did it for a client who didn't want to pay (you can all blame... or even thank him for this script) in the end and I don't want to sell it on my website.
Not because it's not interesting but because my website will be a place to showcase and rent the Algorithm Builders mostly
What is it about?
Basically, it shows how you could convert a plotshape into a label.new object. Very interesting if you want someday to convert your V3 script into V4
With this script, it shows that you can in V4 ( but couldn't do in V3 ) do the followings :
- change dynamically the size (from tiny to huge) of any object
- change dynamically the text (from whatever to whatever) of any object
Screenshot of the user interface
imgur.com
Other use cases
I did it with the Trend Direction but could work with anything really.
- Any indicator with a visual signal. You can know personalized from a user interface the text, size and also the vertical shift. I didn't do it for that one but label.new takes a (x,y) coordinates so playing with y is fairly easy to achieve a dynamic vertical shift
- Even with this script Plotchar-How-to-draw-external-symbols-on-a-chart/ but would require to be updated with a label.new object and with a shape.none parameter so that we'll only see the icon/symbol displayed
- The colors also can be change dynamically using presets Presets-Selector-FRIDAY-NIGHT-CHALLENGE/ . If you have an indicator showing a BULLISH and a BEARISH signal, then you could, for instance, configure colors presets according to the timeframe of the chart or the indicator input, etc (sky is the limit ^^)
Be sure to hit the thumbs up at it motivates me to research what Pinescript can offer and share with the community
Dave
____________________________________________________________
- I'm an officially approved PineEditor/LUA/MT4 approved mentor on codementor. You can request a coaching with me if you want and I'll teach you how to build kick-ass indicators and strategies
Jump on a 1 to 1 coaching with me
- You can also hire for a custom dev of your indicator/strategy/bot/chrome extension/python
Function StochRSI Stochastic Relative Strength Index developed by Tushar Chande and Stanley Kroll.
This script has been written to eliminate the period variable.(Integer)
Thus, it can be used comfortably in adaptive period scripts ! (For example : Adaptive Moving Average , KAMA , FAMA .. etc. )
All efforts goes to ChaosTrader () ,
RicardoSantos () ,
Hpotter for barcolor codes (iff) ()
I hope it will help your new ideas . Best regards ! Noldo .

MarketSpy S/RMarketSpy trading suite was designed to sniff out momentum swings and allow you to profit riding the wave. No matter what market, no matter the timeframe - this is all you need, from here on out this is your trading desk.
It's made up of three main components (with future add-ons in development):
1. MarketSpy X - MSX is the ultimate entry and exit tool that is built using custom momentum algorithm to find exact moments of reversals - without a fail. It's the one on the bottom with "green pulse dot" buy signals and "blood diamond" sell indicators. With a little bit of common sense, this alone will turn your trades into profit instantly.
2. MarketSpy ARmageddon (Augmented Reality) - price action overlay that analyses trends and is a confirmation tool for MarketSpy X. Can show confluence from top 5 market indicators, gives signals of reversals or chop zones, predicts prices(!) and is fully dynamic that reacts to market conditions LIVE.
3. MarketSpy S/R - This thing sniffs out and draws support and resistance based on math, not human eye. This means that MarketSpy effectively can go head to head with bots and algorithms and see right through the market to give you incredibly accurate points of interest where machines and humans sell and buy - ride the way together with the whales. Sounds cliche until you try it.
For more - visit our discord.

Multi Bar OHLC Compare Panel (Floating Grid)Multi Bar OHLC Compare Panel by RagingRocketBull 2019
version 1.0
This indicator lets you compare OHLCV values from several specified bars. Bars can be dynamic/persistent.
You can also use it as an alternate OHLC panel if you don't like small font of the native TradingView panel.
It uses Pinescript v4 to output data dynamically as string labels in a horiz/vertical grid.
Features:
- Floating Panel with customizable horiz/vertical layout and grid spacing
- Support for up to 5 OHLC bars (highlighted with markers)
- Outputs Bar #/index, OHLCV, Bar Change Value/%, Exchange/Ticker, Timeframe, Timestamp strings
- Dynamic (fixed offset)/Persistent bars (fixed time)
- Show/Hide parts of strings
- Full output string customization, including text size, date/time format and delimiters
- 2 Anchor points for panel offset: cur bar high or range high
- Bar Change can change color
Usage:
- specify at least 1 bar index as OHLC source
- select anchor point to position the panel
- select horiz/vertical grid layout
- adjust horiz/vertical spacing
- customize output strings as needed
Notes:
- this indicator uses Pinescript v3 Compatibity Framework
- both bars 1,2 are required for log scale adjustment to work
- you can't attach the panel to screen's top/bottom and must use offset/anchor because, unlike plotshape, string labels don't support yloc=yloc.top/bottom, only yloc.above/belowbar
- you can't precisely align strings in a grid because there's no label.get_width/height to calculate mid/left points, only get_x/y/text. Alignment will break depending on string length, zoom and change color option on/off
- bar change is rendered as a separate label when change color is enabled (2 panels total) and merged into the main panel when disabled (single panel)
- you can't change the order of strings as playing with the natural order of things isn't the best of ideas
- you can modify the script to compare up to 50 OHLC bars, but do you need that much power? Of course, you do.
- you can't set color/style for string labels in Style UI, so a few extra settings were added.
- bar index is limited to 5000 for free accounts (10000 for paid), will show an error when exceeded, also when it exceeds the total number of bars in history
- in persistent bars mode all bars with index > 0 are considered persistent, bar 0 always remains a dynamic bar
- persistent bars' offset is reset: in replay mode on exit or when price reaches cur bar, or when panel layout is changed from h to v in both replay/realtime modes
- initial pos of each persistent bar relative to the first realtime bar anchor doesn't change during session - new persistent bars introduced during session are attached to the most recent cur bar anchor
P.S. Everything is proceeding as I have foreseen

Dynamic Momentum IndexThis indicator was originally developed by Tushar S. Chande and Stanley Kroll. They described it in their book The New Technical Trader (1994).
The period for DMI calculation depends on the market volatility. DMI uses a longer period as volatility decreases and a shorter period as volatility increases, making it more responsive to changing prices than RSI which uses a fixed period. That's why the indicator is called "dynamic". You can specify the DMI period bounds (defaults are 5 and 30) in the indicator settings.
The calculation is based on the standard deviation of prices. The authors used a custom volatility index to adjust RSI period - the similar concept was used in the original VIDYA (yes, it was based on the standard deviation).
Source code on request

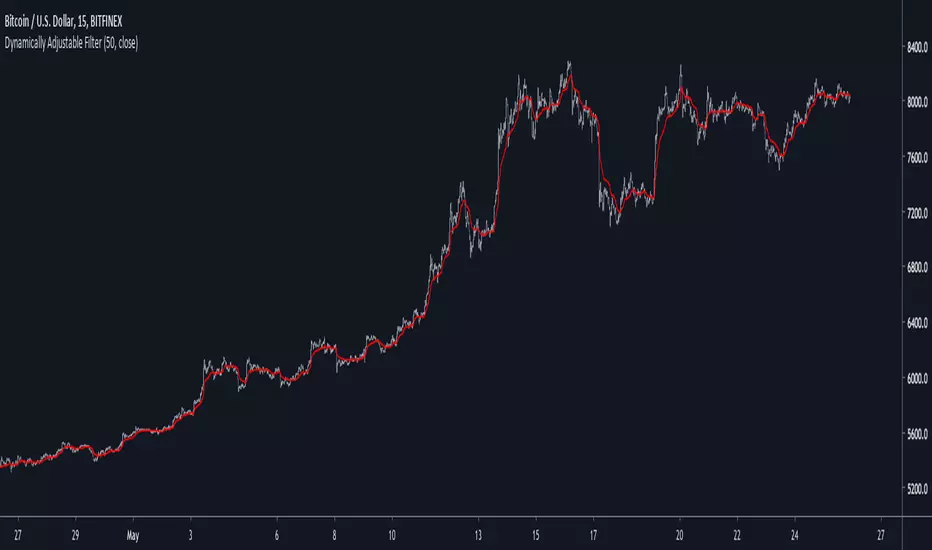
Dynamically Adjustable FilterIntroduction
Inspired from the Kalman filter this indicator aim to provide a good result in term of smoothness and reactivity while letting the user the option to increase/decrease smoothing.
Optimality And Dynamical Adjustment
This indicator is constructed in the same manner as many adaptive moving averages by using exponential averaging with a smoothing variable, this is described by :
x= x_1 + a(y - x_1)
where y is the input price (measurements) and a is the smoothing variable, with Kalman filters a is often replaced by K or Kalman Gain , this Gain is what adjust the estimate to the measurements. In the indicator K is calculated as follow :
K = Absolute Error of the estimate/(Absolute Error of the estimate + Measurements Dispersion * length)
The error of the estimate is just the absolute difference between the measurements and the estimate, the dispersion is the measurements standard deviation and length is a parameter controlling smoothness. K adjust to price volatility and try to provide a good estimate no matter the size of length . In order to increase reactivity the price input (measurements) has been summed with the estimate error.
Now this indicator use a fraction of what a Kalman filter use for its entire calculation, therefore the covariance update has been discarded as well as the extrapolation part.
About parameters length control the filter smoothness, the lag reduction option create more reactive results.
Conclusion
You can create smoothing variables for any adaptive indicator by using the : a/(a+b) form since this operation always return values between 0 and 1 as long as a and b are positive. Hope it help !
Thanks for reading !
Volume Supply and Demand ZonesDraws supply and demand zones of 3 types, based on 3 different volume threshold parameters.
The timeframe of the script is fixed (you can change it in the options), so for example it is possible to keep Daily S/D zones while looking at 1h chart.

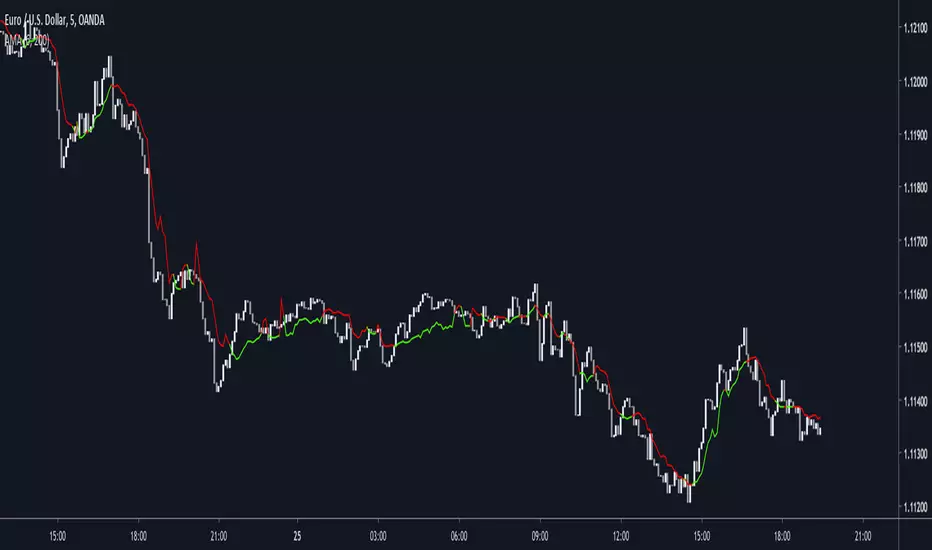
Dynamically Adjustable Moving AverageIntroduction
The Dynamically Adjustable Moving Average (AMA) is an adaptive moving average proposed by Jacinta Chan Phooi M’ng (1) originally provided to forecast Asian Tiger's futures markets. AMA adjust to market condition in order to avoid whipsaw trades as well as entering the trending market earlier. This moving average showed better results than classical methods (SMA20, EMA20, MAC, MACD, KAMA, OptSMA) using a classical crossover/under strategy in Asian Tiger's futures from 2014 to 2015.
Dynamically Adjustable Moving Average
AMA adjust to market condition using a non-exponential method, which in itself is not common, AMA is described as follow :
1/v * sum(close,v)
where v = σ/√σ
σ is the price standard deviation.
v is defined as the Efficacy Ratio (not be confounded with the Efficiency Ratio) . As you can see v determine the moving average period, you could resume the formula in pine with sma(close,v) but in pine its not possible to use the function sma with variables for length, however you can derive sma using cumulation.
sma ≈ d/length where d = c - c_length and c = cum(close)
So a moving average can be expressed as the difference of the cumulated price by the cumulated price length period back, this difference is then divided by length. The length period of the indicator should be short since rounded version of v tend to become less variables thus providing less adaptive results.
AMA in Forex Market
In 2014/2015 Major Forex currencies where more persistent than Asian Tiger's Futures (2) , also most traded currency pairs tend to have a strong long-term positive autocorrelation so AMA could have in theory provided good results if we only focus on the long term dependency. AMA has been tested with ASEAN-5 Currencies (3) and still showed good results, however forex is still a tricky market, also there is zero proof that switching to a long term moving average during ranging market avoid whipsaw trades (if you have a paper who prove it please pm me) .
Conclusion
An interesting indicator, however the idea behind it is far from being optimal, so far most adaptive methods tend to focus more in adapting themselves to market complexity than volatility. An interesting approach would have been to determine the validity of a signal by checking the efficacy ratio at time t . Backtesting could be a good way to see if the indicator is still performing well.
References
(1) J.C.P. M’ng, Dynamically adjustable moving average (AMA’) technical
analysis indicator to forecast Asian Tigers’ futures markets, Physica A (2018),
doi.org
(2) www.researchgate.net
(3) www.ncbi.nlm.nih.gov

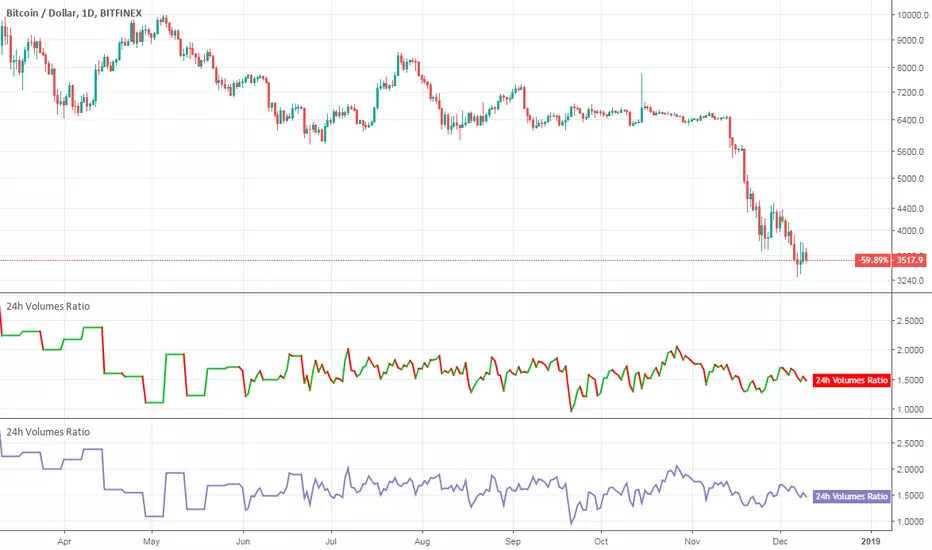
Crypto Mineable vs Not Mineable (24h Volumes Ratio)Hello traders!
This indicator shows you the dynamic ratio between 24h total volumes of the mineable and not mineable cryptocurrencies from TOP-40 according to coinmarketcap.com .
NOTE : The word "dynamic" means that I didn't have to hardcode 24h volumes from coinmarketcap.com for the presented cryptocurrencies - all values are updated automatically.
How to get access
You can buy it for only 30$ to get lifetime access
Happy Trading!
Crypto Mineable vs Not Mineable (24h Volumes)Hello traders!
This indicator shows you the dynamic 24h total volume charts of the mineable and not mineable cryptocurrencies from TOP-40 according to coinmarketcap.com .
NOTE : The word "dynamic" means that I didn't have to hardcode 24h volumes from coinmarketcap.com for the presented cryptocurrencies - all values are updated automatically.
How to get access
You can buy it for only 30$ to get lifetime access
Happy Trading!

Crypto Mineable vs Not Mineable (Market Caps Ratio)Hello traders!
This indicator shows you the ratio between market capitalizations of the mineable and not mineable cryptocurrencies from TOP-20 (excluding Bitcoin Cash).
NOTE : The market capitalizations are calculated dynamically . The word "dynamically" means that I did not hardcode supplies for presented cryptocurrencies.
What else is included
Alert for the specified positive % change
Alert for the specified negative % change
How to get access
Buy for only 25$ to get lifetime access to this indicator
Like and follow for more cool indicators!
Happy Trading!

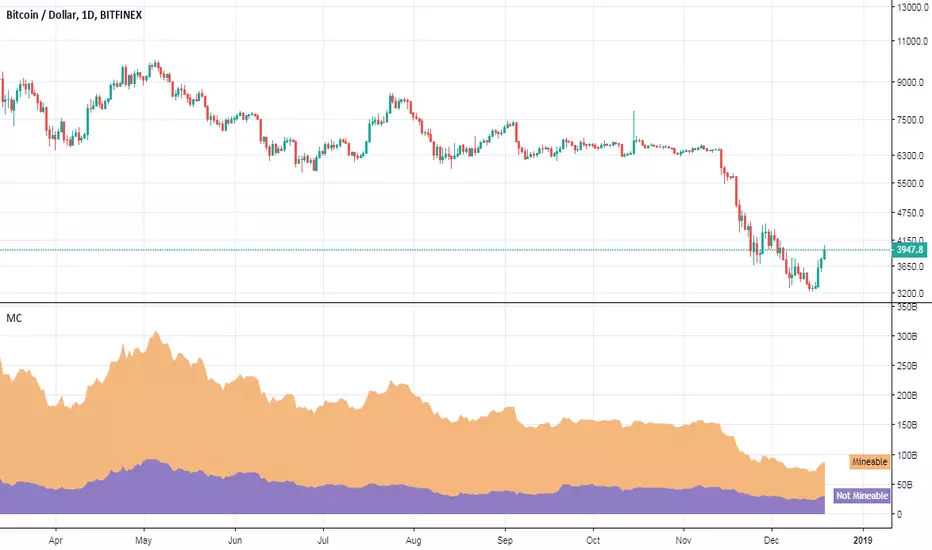
Crypto Mineable vs Not Mineable (Market Caps)Hello traders!
This indicator shows you the dynamic market capitalization charts of the mineable and not mineable cryptocurrencies from TOP-20 (excluding Bitcoin Cash).
NOTE : The word "dynamic" means that I did not hardcode supplies for the presented cryptocurrencies.
How to get access
Buy for only 25$ to get lifetime access to this indicator
Like and follow for more cool indicators!
Happy Trading!