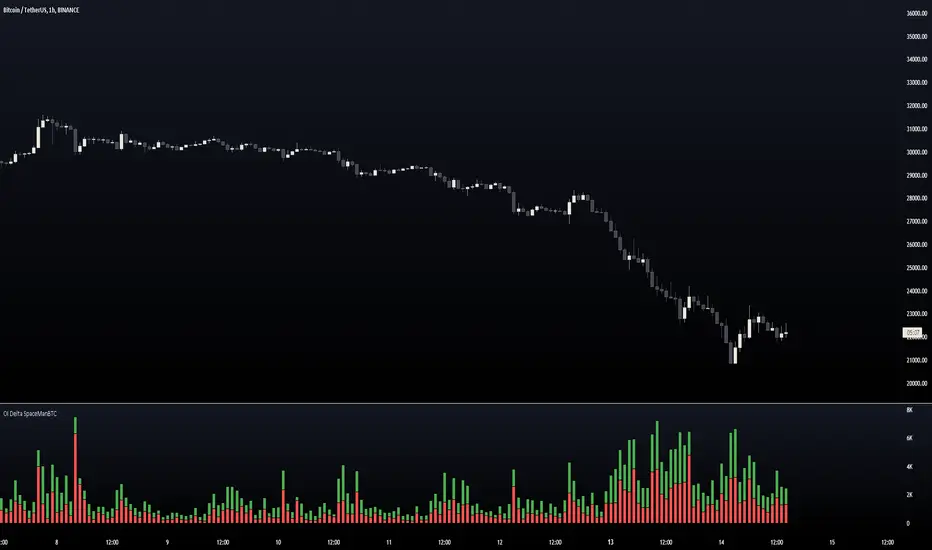
Open Interest Delta OI Delta
This indicator aims to provide users an idea for OI changes intrabar referencing the LTF data, there will be some limitations as its limited to the LTF of 1minute maximum,
however there can be some insight provided regardless.
Below we can see an additional 2 modes,
Split:
Delta
The difference between the 3 modes include:
Split is a separation of the initial mode "Singular" it divides the 2 into separate axis positioning to allow for a different perspective of the same data.
Delta: Takes the difference of the 2 and makes it easier for users to see which side was in control, personally delta makes it easier to see DIVS in momentum and where exhaustion is occuring.
-Dev note, this was made alongside many other things so less testing was done do dm me anytime if theres any issues that need solving.
Delta
[VC] Cumulative Delta Histogram V1.0The V.C Cumulative Delta Histogram shows the market's ongoing Buying/Selling pressure. It helps to determine whether Supply or Demand is dominating and in control.
➤If the Cumulative Delta Increases, the buyers are in control.➚
➤If the Cumulative Delta Decreases, the sellers are in control.➘
The use cases for this Indicator are vast and correlated with our other Delta Indicators. The following examples will explain how to use this Indicator.
Example 1 EUR / USD
In the above example, Negative Cumulative Delta Decreased & Turned into Positive Cumulative Delta. That indicates that sellers are losing control & buyers are getting power.
As a confirmation on the ' 'Box Chart Histogram'' it is evident that Demand is also increasing.
And on ''Wave Chart Index'' as a 3rd confirmation, you can see that the Delta has also increased compared to previous waves.
Example 2
Positive Delta on Cumulative Delta Histogram is decreasing & Negative Delta started increasing.
On the Box Chart Histogram , Demand is decreasing & Supply is increasing.
Additionally, on the Wave Chart Index , the Delta of the wave is also decreasing.
(in short, besides ''Cumulative Delta Histogram," Box chart Histogram & Wave Chart Index is also adding additional confirmation)
Note: Two types of Delta sources are included in this Cumulative Delta Indicator.
Type A: Simple Delta
Type B: Delta %
Simple Delta is the difference between Net Buying - Selling pressure.
Delta % also works in the same calculation, but a Volume weighted algorithm is applied on it.
You may use any of them that suits your analysis.
VC Cumulative Delta Histogram Settings & Inputs
Source:
Allows you to choose the source, Between Simple Delta & Delta %.
Cumulative Length:
Allows you to Change the cumulative length.
Positive & Negative Color:
It allows you to change the colors.
Style Menue
Allows you to change the style & color of the histogram.
Disclaimer Note:
V.C Cumulative Delta Histogram It is purely Volume , Delta, Demand & Supply imbalance and comparative analysis-based tool. Before applying this Indicator to your study, you should know about Volume , Delta & Spread, Demand & Supply, and Aggressive & Passive behaviour of buyers/sellers.
Some basic understanding of Sir Richerd Wyckoff's Theory can also be helpful.

Educational LTF -> HTF volume deltaThis script shows 1 of several technique to gather volume delta
-> more explanation can be found in the script itself,
Cheers!
Delta Volume by SiddWolfDelta Volume is Difference between Buying Volume and Selling Volume. This indicator gives the Delta Volume based on Lower TimeFrame Candles. It utilizes security_lower_tf() function, a function that provides Lower TF candle data in Higher TF Chart.
security_lower_tf() is a new function provided by TradingView yesterday. If you are a PineScript Programmer, I suggest you to read about it, as it is a very powerful function that can extremely improve your trading strategy.
How this indicator works:
This indicator checks volume data on lower TimeFrame Candles and Shows it's delta in the current Chart Timeframe. For example: If you open 4 hours chart, this indicator checks volume of 1 minute chart and separates Buying-Selling volume. Then it subtracts Candle's Selling volume from Candle's Buying volume, finally calculating the Delta Volume.
This indicator also provides a Smooth Delta Volume, which is moving average of Delta Volume. As Delta Volume changes a lot, Smooth Delta Volume can be very helpful for identifying Trends . Goto settings and in "Show" section select "Smooth Delta Volume" to lay it on the chart.
Settings is the Key:
Settings are key to all of my indicators. Play around with it a bit. You can change what to show on the chart from settings. Smooth Delta Volume moving average length can be changed from the settings. You can also select "Show as Percentage", which shows Delta Volume as Percentage of Overall Candle's Volume. If you use Weekly or Monthly Timeframe, change increase lower timeframe from settings. Read the tooltips to understand what each settings mean. Tooltips are the (i) button in-front of each settings.
FAQs:
Q. Does the indicator Repaint ?
--- No. None of my indicators repaints. What you see now is what's drawn in real time.
Q. What TimeFrame is Best for this Indicator ?
--- It can be used on timeframes from 5 minutes to higher. But I would prefer to use it from timeframes higher than 30 minutes, as it gathers data from 1 minute TF.
Q. Indicator doesn't show anything ?
--- This indicator only works on security with Volume data. Also use it from higher timeframe than specified in Settings, because Volume Delta is calculated using Data from Lower TimeFrame.
Q. Delta volume is not provided by TradingView, So how exactly does this indicator work?
--- This indicator takes advantage of new pinescript function security_lower_tf(), and calculates volume for smaller timeframe data and calculates delta on higher timeframe.
Q. Does this indicator give financial advice?
--- No. Nope. Nein. Não. नहीं.
Conclusion:
This indicator is very basic but if used correctly it can be very powerful. If you have any questions or suggestions feel free to comment below. I'd love to connect with you. Thank you.
~ @SiddWolf

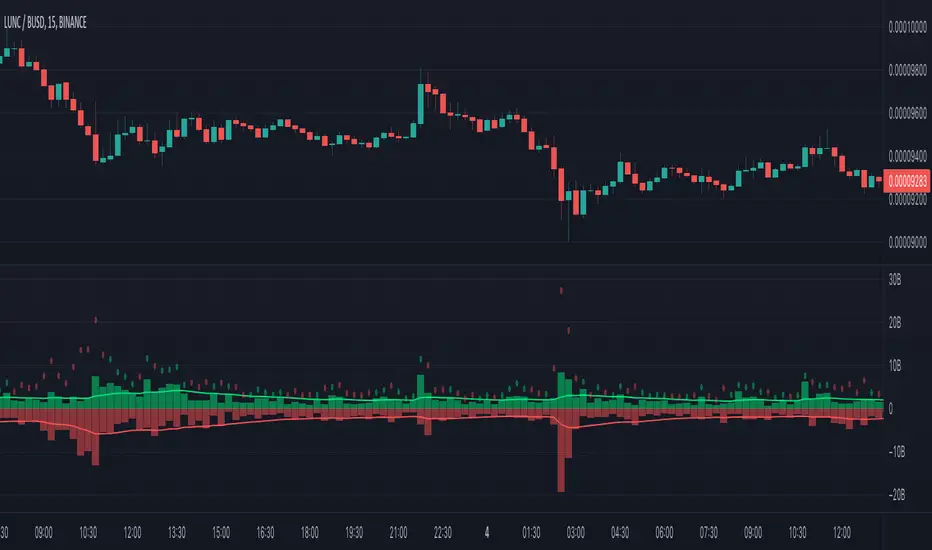
Volume DeltaVolume Delta
This indicator aims to provide users an idea for momentum and exhaustion, via differentiating between the buy delta and sell delta.
The purpose of this indicator is to give a deeper dive into the data provided by tradingviews volume indicator with greater granularity intrabar from a HTF perspective! (suitable for 30min and up but will work as low as 5m)
Below we can see an additional 2 modes,
Split:
Delta:
The difference between the 3 modes include:
Split is a separation of the initial mode "Singular" it divides the 2 into separate axis positioning to allow for a different perspective of the same data.
Delta: Takes the difference of the 2 and makes it easier for users to see which side was in control, personally delta makes it easier to see DIVS in momentum and where exhaustion is occuring.
Heikin Ashi OscillatorThis indicator plots a delta between the Heiken Ashi close price and the regular candlestick closing price as a histogram, which allows you to quickly analyse changes in trend
direction.
It also provides a reverse-engineered closing price for regular candlesticks, to reach in order to maintain the momentum, which allows you to be forewarned of potential pivot points to change in bias in direction.
Feel free to use this indicator to modify and add to your charts as you wish.

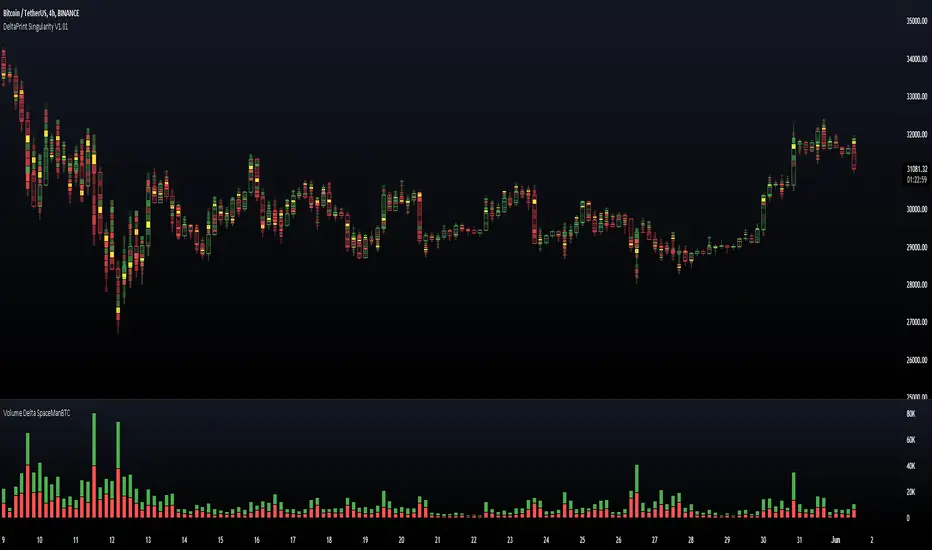
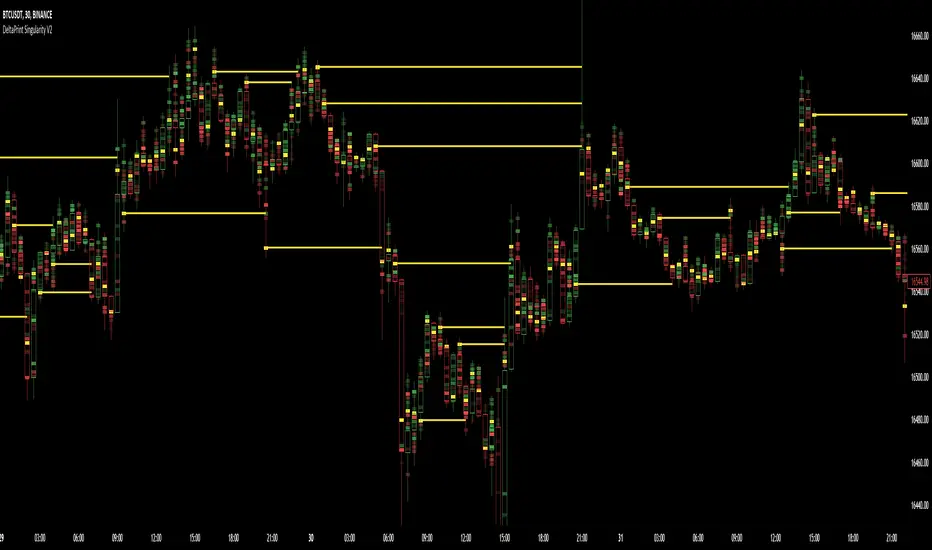
DeltaPrint SingularityDeltaPrint Singularity
DeltaPrint Singularity is a method of bringing a previous DeltaPrint Candles with less granularity but greater historical reference.
The advantages is the ease of use with existing charts and indicators without adjusting for low tf chart for UI Space this is all handled on the same timeframe using intrabar data.
The benefit of such candles is providing users additional data as to location of potentially trapped traders via late entry into positions e.g. late longing a range high or VAH.
Or to provide credence to traders who look for momentum plays seeing momentum drop off likely leading to a period of consolidation or pull back.
The logic used here is different to the previous rendition of the indicator but works well with any and all charts that allow some reference to volume.
This indicator aims to provide users the insight into how traders are positioning and where they are positioning. The indicator comes with a few initial features:
Singular Coloring
Delta Coloring
POC Highlighting
Singular Coloring is useful by providing a minimalist view into volume execution points.
Delta Coloring breaks this down further by providing an estimate into ask:bid (although delta print will be stronger at this)
POC highlighting provides only the volume POC and not Delta POC.
Planned Updates
Delta Weighting
POC Level Extensions
Alerts
[VC] Effort & Result Index V1.0V.C. Effort & Result Index draws the Price change, Volume, Delta & Delta % as a histogram. On the positive side of the histogram, it marks the price change & on the negative side of the histogram, it marks volume, delta & delta %. And the best part of the indicator is that it allows you to see all the mentioned data types simultaneously.
See the below chart for a comprehensive understanding.
Before moving further, understand the below analogy first.
Volume & Delta = Fule or Effort
Price Movement = Result
Think of Volume & Delta as FULE or EFFORT and Price Movement as Result.
If the price travels a significant distance with less fule & effort, it indicates that no barriers or inverse forces are stopping the price movement.
On the other hand, if the price is travelling a less distance & consuming comparatively more fule & effort, it indicates some barriers or inverse forces stopping the price movement.
V.C. Effort & Result Index empowers you to read, compare & analyse Volume, Delta & Price effortlessly. It helps to measure the relative price change in different combinations. Such as, you can compare the price change with total volume, delta volume & delta percentage.
See the below relative comparison analysis by using Price Change, Volume Change & Delta Change.
In the above example, you can see that on candle A, there is a very significant price move with a small volume & delta. But on the next candle B, there is a minor price move compared to the previous candle A, but the volume is relatively high & delta is almost the same. In simple words, the same effort was applied to candle B but got fewer results than candle A. It indicates that buyers applied the same effort but failed to get the same results. It reveals that sellers are taking control, leading to a trend reversal.
This comparative analysis method & approach can add an extra edge to your analysis spacially on key levels & breakouts.
V.C Effort & Result Index Settings & Inputs
Price Change:
Allow you to show/hide the price change bars on the positive side of the histogram.
Volume:
Allow you to show/hide the total volume on the negative side of the histogram.
Delta%:
Allow you to show/hide the delta % on the negative side of the histogram.
Delta:
Allow you to show/hide the delta on the negative side of the histogram.
Style Settings
The Style section allows you to change the colors & the view format of all data types.
Disclaimer Note:
V.C Effort & Result Index is not a BUY/SELL signal based indicator or a holy grail trading system.
It is purely Volume, Delta, Demand & Supply imbalance and comparative analysis based tool kit. Before applying this indicator to your analysis, you should know about Volume, Delta & Spread, and Demand & Supply.
Some basic understanding of Sir Richerd Wyckoff's Theory can also be helpful.

[VC] Box Chart Index V1.0The ''V.C Box Chart Index'' shows the shortest possible wave. It graphically shows the continuous up movement or continuous down movement in the form of a box. As soon as the direction changes, the box changes as well.
It is an effortless way to show the price change that occurred in the box visually. It also correlates to what Wyckoff said about as the buying waves increase in volume, time, and length & the selling waves shorten, lookout for a change in the prevailing trend.
The example below shows more big green boxes than red, and the price change caused by the green box has made the uptrend.
Important Note:
V.C Box Chart Index also correlates to another indicator named V.C Box Chart Histogram
V.C Box Chart Histogram draws the cumulative delta based on each box as a histogram. Combining these two indicators empowers you to see the cumulative demand & supply and buying & selling quantity of each box.
See the Example Blow:
The above example shows that supply is decreasing on down boxes, indicating that fewer sellers are left to pull the market down.
On the other hand, demand increases on the up boxes, indicating that more buyers are coming into the market. As a result, every green box is breaking the previous high & price is moving upside.
For a more comprehensive understanding of the co-relation of these two indicators, read the description from the link below.
V.C Box Chart Index Settings & Properties Explained
Border of Box:
Allow you to show/hide the border of the box
Positive Box & Negative Box Borders:
Allow you to change the border color & opacity
Positive Box & Negative Box:
Allow you to change the color & opacity of the box
Disclaimer Note:
V.C Box Chart Index is not a BUY/SELL signal based indicator or a holy grail trading system.
It is purely Volume, Delta, Orderflow, Demand & Supply imbalance and comparative analysis based indicator tool kit. Before applying this indicator to your analysis, you should know about Volume, Delta & Spread, and Demand & Supply.
Some basic understanding of Sir Richerd Wyckoff's Theory can also be helpful.

[VC] Box Chart Histogram V1.0V.C Box Chart Histogram draws the cumulative delta that correlates to another indicator named ''V.C Box Chart Index'' .
(In other words, ''V.C Box Chart Histogram'' & ''V.C Box Chart Index'' are correlated.)
V.C Box Chart Histogram draws the cumulative delta as histogram based on ''V.C Box Chart Index''. Combining these two indicators empowers you to see the cumulative demand & supply / cumulative buying & selling quantity of each box.
You can also switch from cumulative delta mode to cumulative delta % from input settings. See the difference between simple delta & delta % mode from these examples.
Simple Delta Mode (Cumulative Demand & Supply)
In the above example, green & red boxes on the histogram show the cumulative delta of each box from the main chart. In simple words, these boxes show the cumulative net demand & supply of the corresponding box from the main chart. In this example, Big green boxes indicate demand is increasing, whereas small red boxes indicate that supply is decreasing.
Delta % Mode (Cumulative Volume-Weighted Demand & Supply)
Similar to the simple delta mode, in the above example, blue & red boxes on the histogram show the cumulative delta % of each box from the main chart. In simple words, these boxes show the cumulative & volume-weighted demand & supply of the corresponding box from the main chart.
In this example, Big blue boxes indicate that demand is increasing, whereas small red boxes indicate that supply is decreasing.
V.C Box Chart Histogram Properties & Settings
Inputs
Choose Your Source:
Allow you to switch from simple delta to delta %
Choose color of the box on simple delta:
Allow you to change the color of the box
Choose color of the box on delta %:
Allow you to change the color of the box
Style
Positive & Negative Simple Delta:
Allow you to see the simple delta in the column format.
Positive & Negative Delta %:
Allow you to see the delta % in the column format.
Boxes:
Allow you to show/hide the boxes
NOTE: You can also see both delta formats in dual view mode. (in column & box at the same time to have a more precise & detailed look)
See Below Example
Disclaimer Note:
V.C Box Chart Histogram is not a Buy/Sell signal based indicator or a holy grail trading system. It is purely a leading indicator that can help you to analyse demand & supply and buying & selling forces of the market in a smart & effortless way. Before applying this indicator to your analysis, you should have some basic knowledge about volume, delta, & supply & demand. Some basic understanding of Sir Richerd Wyckoff's Theory can also be helpful.

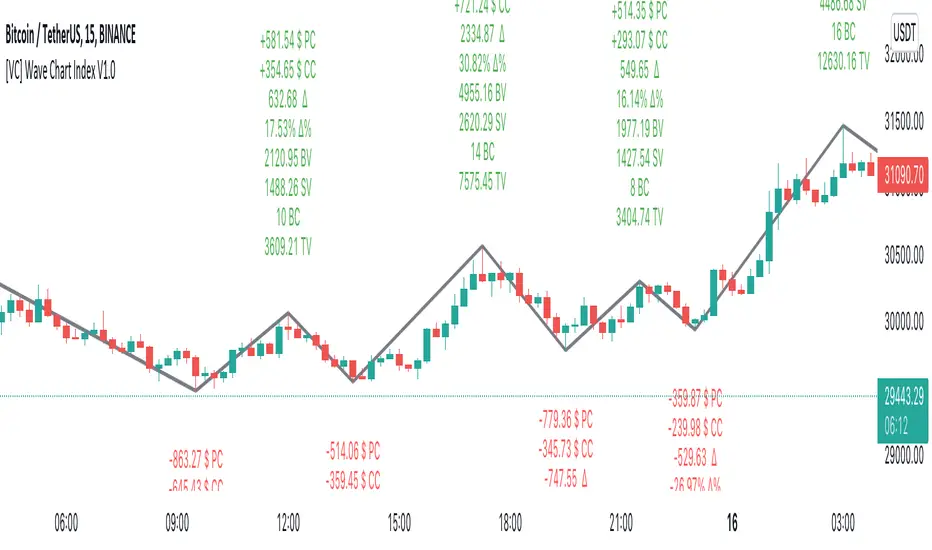
[VC] Wave Chart Index V1.0V.C Wave Chart Index
Richard D. Wyckoff created the first wave chart, and he instructed students to think in waves. He was an early 20th-century pioneer in the technical approach to studying the stock market and is considered one of the five "titans" of technical analysis, along with Dow, Gann, Elliott and Merrill.
V.C Wave Chart Index is the most comprehensive version of Wyckoff's theory. It is used to measure the strength & weakness of each market move by comparative data analysis. It draws waves on the chart based on Gann Swing theory. At the end of each wave, a label shows all the cumulative data & information of the wave.
With the help of this indicator, You can measure each swing or high/low movement of the market by comparing it with previous high/low price movements. The comparison can be made by using the following data of each wave.
Price Change
Volume Change
Delta Change
Delta % Change
Buy Volume
Sell Volume
Time Spent (Bar Counter)
V.C Wave Chart Index is not only an indicator but itself a unique & comprehensive tool kit to measure & compare each move of the market. This tool enables you to see deep inside each movement of the market. It allows you to observe the nitty-gritty data of each wave at the micro-level with your nacked eyes. With the help of Delta & (C.C) Close to Close Price Change, it is now easy to apply effort & result and cause & effect theory to your analysis. (total volume, buy volume, sell volume & delta % can also be used for comparative analysis)
V.C Wave Chart Index Properties
Price Change or (P.C): Shows the price Change of the Wave
Buy Volume (B.V): Shows the Cumulative Buy Volume of the Wave
Sell Volume (S.V): Shows the Cumulative Sell Volume of the Wave
Delta Volume (∆): Shows the Cumulative Buy - Sell Volume of the Wave
Delta % ∆ : Shows the Cumulative Delta % of the wave
Total Volume (T.V): Shows the Cumulative Total Volume of the Wave
Bar Count (B.C): Shows how much time it took to Complete the Wave
Swing Price: Shows the Reversal Price of the Wave
V.C Wave Chart Index Settings & Inputs Explained
Sensitivity (%): This input helps you adjust to the wave's steepness. 0.001 is my recommended value for all time frames.
Cumulation: This input helps you to control the length & formation of the wave: ( the fewer values = more wave formations & vice versa)
Wave Color: Allow you to change the color of the wave
Draw to Latest Candle: Allow you to show/hide the latest or real-time wave & data.
Divisor: Allow you to divide extensive numeric data into small numbers to read it easily.
Align Text: Allow you to align the text.
Size Text: Allow you to change the size of the text.
Display Toal Delta: Allow you to show or hide total Delta (∆).
Display Percentage Delta (%): Allow you to show or hide Delta (∆) %.
Color Wave Buy: Allow you to change the color.
Color Wave Sell: Allow you to change the color.
Display Total Volume (T.V): Allow you to show/hide total volume
Display Buy Volume (B.V): Allow you to show/hide buy volume
Display Sell Volume (S.V): Allow you to show/hide sell volume
Display Swing Price: Allow you to show/hide swing price
Display Swing Price Change (P.C): Allow you to show/hide price change
Display Close to Close Price Change (C.C): Allow you to show/hide close to close price changes. (previous wave close to current wave close) (recommended for comparative analysis)
P.C Format: Allow you to select the price formate
C.C Format: Allow you to select the price formate
Display Bar Counter (B.C): Allow you to show/hide the bar counter
Comparative Data Analysis Example in the light of Effort & Result Theory
A short explanation of the above analysis
On Wave A , the close to close price change (C.C) is $354 . (its the distance of price that price travelled from the low of the previous wave)
and price travelled this distance with 632 Delta (Delta is an effort which is used to travel the price)
On Wave B , close to close price change (C.C) is -$359 , almost the same distance as the previous wave. But for this distance price used 47% more Delta than the last wave. ( previous Delta is 632 , but current Delta is 931 that is 47% extra)
It indicates that sellers have put more effort in Wave B than Wave A . However, they got similar results as the previous wave. In other words
More Effort & Less Result = Reversal Sign
(that's why in the above example price reversed from a support level)
* Notice that Wave B is also on a key support area/level. And on key support or resistance area, this kind of comparative analysis can give an extra edge in your analysis.
Disclaimer Note:
V.C Wave Chart Index is not a BUY/SELL signal based indicator or a holy grail trading system.
It is purely Volume, Delta and comparative analysis based indicator. Before applying this indicator to your analysis, you should know about V.S.A, Volume, Delta & Spread.
Some basic understanding of Sir Richerd Wyckoff's Theory can also be helpful.
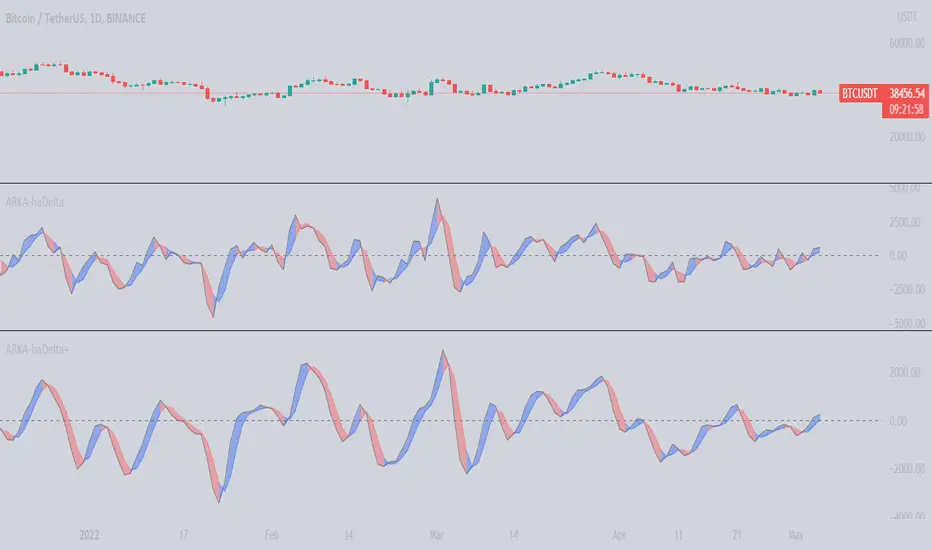
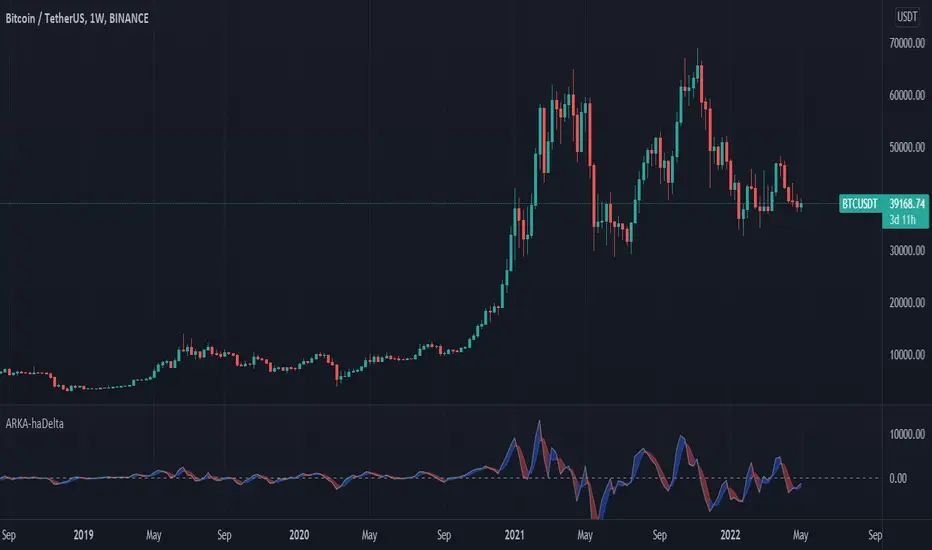
ARKA-haDelta+This Indicator is based on Mr. Dan Valcu ideas.
Bodies of candles(open-close) are the main component used to indicate and assess trend direction, strength, and reversals.
The indicator measures difference between Heikin Ashi close and open.
Measuring the height of candle bodies leads to extreme values that point to trend slowdowns. Thus quantifies Heikin Ashi to get earlier signals.
I used this indicator on Heiken Ashi charts but, it's possible to choose to calculate Body size based on Heiken Ashi or Candles.
haDelta can be smoothed with a simple moving average .
We see that crossings between the haDelta and SMA confirm trend changes with an anticipated delay introduced by each average. Crossings between the indicator and its average are better
confirmations of trend changes.
When Delta crosses above SMA it is an uptrend.
When Delta crosses below SMA it is a downtrend.
Default haDelta smoothed value is by applying 3 periods SMA .
Also, it is possible to deactivate SMA and see just The Delta Values.
In this indicator can choose the MA period and type.
This version has an option that makes it possible to draw dynamic levels. By choosing Dynamic from levels Type and set your preferred length.
The Length value is the max value in the past candles that are used to draw the levels.
In this version, I added the Z-score level. By choosing z-score areas the z-score is above 2 or below -2 shown by colors. I also added Alert ability into the indicator. The alert has two modes. First, when level type equals Z-Score it shows signals where delta cross ma and Z-Score are below or above high and low levels.
The second mode is when the level type is not Z-Score it shows delta cross ma.
So far, this is the description of the indicator(haDelta), which has been written separately and published for the public. In this indicator, we intend to smooth the value of haDelta we get using moving averages.
A simple three-day moving average has been applied to the Delta(3) and its MA to reduce the number of false signals generated by haDelta.
haDelta+=SMA(haDelta,3)
SMA(haDelta+,3)=SMA(haDelta+,3)
Realtime FootprintThe purpose of this script is to gain a better understanding of the order flow by the footprint. To that end, i have added unusual features in addition to the standard features.
I use "Real Time 5D Profile by LucF" main engine to create basic footprint(profile type) and added some popular features and my favorites.
This script can only be used in realtime, because tradingview doesn't provide historical Bid/Ask date.
Bid/Ask date used this script are up/down ticks.
This script can only be used by time based chart (1m, 5m , 60m and daily etc)
This script use many labels and these are limited max 500, so you can't display many bars.
If you want to display foot print bars longer, turn off the unused sub-display function.
Default setting is footprint is 25 labels, IB count is 1, COT high and Ratio high is 1, COT low and Ratio low is 1 and Delta Box Ratio Volume is 1 , total 29.
plus UA , IB stripes , ladder fading mark use several labels.
///////// General Setting ///////////
Resets on Volume / Range bar
: If you want to use simple time based Resets on, please set Total Volume is 0.
Your timeframe is always the first condition. So if you set Total Volume is 1000, both conditions(Volume >= 1000 and your timeframe start next bar) must be met. (that is, new footprint bar doesn't start at when total volume = exactly 1000).
Ticks per row and Maximum row of Bar
: 1 is minimum size(tick). "Maximum row of Bar" decide the number of rows used in one footprint. 1 row is created from 1 label, so you need to reduce this number to display many footprints (Max label is 500).
Volume Filter and For Calculation and Display
: "Volume Filter" decide minimum size of using volume for this script.
"For Calculation and Display" is used to convert volume to an integer.
This script only use integer to make profile look better (I contained Bid number and Ask number in one row( one label) to saving labels. This require to make no difference in width by the number of digits and this script corresponds integers from 0 to 3 digits).
ex) Symbol average volume size is from 0.0001 to 0.001. You decide only use Volume >= 0.0005 by "Volume Filter".
Next, you convert volume to integer, by setting "For Calculation and Display" is 1000 (0.0005 * 1000 = 5).
If 0.00052 → 5.2 → 5, 0.00058 → 5.8 → 6 (Decimal numbers are rounded off)
This integer is used to all calculation in this script.
//////// Main Display ///////
Footprint, Total, Row Delta, Diagonal Delta and Profile
: "Footprint" display Ask and Bid per row. "Total" display Ask + Bid per row.
"Row Delta" display Ask - Bid per row. "Diagonal Delta" display Ask(row N) - Bid(row N -1) per row.
Profile display Total Volume(Ask + Bid) per row by using Block. Profile Block coloring are decided by Row Delta value(default: positive Row Delta (Ask > Bid) is greenish colors and negative Row Delta (Ask < Bid) is reddish colors.)
Volume per Profile Block, Row Imbalance Ratio and Delta Bull/Bear/Neutral Colors
: "Volume per Profile Block" decide one block contain how many total volume.
ex) When you set 20, Total volume 70 display 3 block.
The maximum number of blocks that can be used per low is 20.
So if you set 20, Total volume 400 is 20 blocks. total volume 800 is 20 blocks too.
"Row Imbalance Ratio" decide block coloring. The row imbalance is that the difference between Ask and Bid (row delta) is large.
default is x3, x2 and x1. The larger the difference, the brighter the color.
ex) Ask 30 Bid 10 is light green. Ask 20 Bid 10 is green. Ask 11 Bid 10 is dark green.
Ask 0 Bid 1 is light red. Ask 1 Bid 2 is red. ask 30 Bid 59 is dark green.
Ask 10 Bid 10 is neutral color(gray)
profile coloring is reflected same row's other elements(Ask, Bid, Total and Delta) too.
It's because one label can only use one text color.
/////// Sub Display ///////
Delta, total and Commitment of Traders
: "Delta" is total Ask - total Bid in one footprint bar. Total is total Ask + total Bid in one footprint bar.
"Commitment of traders" is variation of "Delta". COT High is reset to 0 when current highest is touched. COT Low is opposite.
Basic concept of Delta is to compare price with Delta. Ordinary, when price move up, delta is positive. Price move down is negative delta.
This is because market orders move price and market orders are counted by Delta (although this description is not exactly correct).
But, sometimes prices do not move even though many market orders are putting pressure on price , or conversely, price move strongly without many market orders.
This is key point. Big player absorb market orders by iceberg order(Subdivide large orders and pretend to be small limit orders.
Small limit orders look weak in the order book, but they are added each time you fill, so they are more powerful than they look.), so price don't move.
On the other hand, when the price is moving easily, smart players may be aiming to attract and counterattack to a better price for them.
It's more of a sport than science, and there's always no right response. Pay attention to the relationship between price, volume and delta.
ex) If COT Low is large negative value, it means many sell market orders is coming, but iceberg order is absorbing their attack at limit order.
you should not do buy entry, only this clue. but this is one of the hints.
"Delta, Box Ratio and Total texts is contained same label and its color are "Delta" coloring. Positive Delta is Delta Bull color(green),Negative Delta is Delta Bear Color
and Delta = 0 is Neutral Color(gray). When Delta direction and price direction are opposite is Delta Divergence Color(yellow).
I didn't add the cumulative volume delta because I prefer to display the CVD line on the price chart rather than the number.
Box Ratio , Box Ratio Divisor and Heavy Box Ratio Ratio
: This is not ordinary footprint features, but I like this concept so I added.
Box Ratio by Richard W. Arms is simple but useful tool. calculation is "total volume (one bar) divided by Bar range (highest - lowest)."
When Bull and bear are fighting fiercely this number become large, and then important price move happen.
I made average BR from something like 5 SMA and if current BR exceeds average BR x (Heavy Box Ratio Ratio), BR box mark will be filled.
Box Ratio Divisor is used to good looking display(BR multiplied by Box Ratio Divisor is rounded off and displayed as an integer)
Diagonal Imbalance Count , D IB Mark and D IB Stripes
: Diagonal Imbalance is defined by "Diagonal Imbalance Ratio".
ex) You set 2. When Ask(row N) 30 Bid(row N -1)10, it's 30 > 10*2, so positive Diagonal Imbalance.
When Ask(row N) 4 Bid(row N -1)9, it's 4*2 < 9, so negative Diagonal Imbalance.
This calculation does not use equals to avoid Ask(row N) 0 Bid(row N -1)0 became Diagonal Imbalance.
Ask(row N) 0 Bid(row N -1)0, it's 0 = 0*2, not Diagonal Imbalance. Ask(row N) 10 Bid(row N -1)5, it's 10 = 5*2, not Diagonal Imbalance.
"D IB Mark" emphasize Ask or Bid number which is dominant side(Winner of Diagonal Imbalance calculation), by under line.
"Diagonal Imbalance Count" compare Ask side D IB Mark to Bid side D IB Mark in one footprint.
Coloring depend on which is more aggressive side (it has many IB Mark) and When Aggressive direction and price direction are opposite is Delta Divergence Color(yellow).
"D IB Stripes" is a function that further emphasizes with an arrow Mark, when a DIB mark is added on the same side for three consecutive row. Three consecutive arrow is added at third row.
Unfinished Auction, Ratio Bounds and Ladder fading Mark
: "Unfinished Auction" emphasize highest or lowest row which has both Ask and Bid, by Delta Divergence Color(yellow) XXXXXX mark.
Unfinished Auction sometimes has magnet effect, price may touch and breakout at UA side in the future.
This concept is famous as profit taking target than entry decision.
But, I'm interested in the case that Big player make fake breakout at UA side and trapped retail traders, and then do reversal with retail traders stop-loss hunt.
Anyway, it's not stand alone signal.
"Ratio Bounds" gauge decrease of pressure at extreme price. Ratio Bounds High is number which second highest ask is divided by highest ask.
Ratio Bounds Low is number which second lowest bid is divided by lowest bid. The larger the number, the less momentum the price has.
ex)first footprint bar has Ratio Bounds Low 2, second footprint bar has RBL 4, third footprint bar has RBL 20.
This indicates that the bear's power is gradually diminishing.
"Ladder fading mark" emphasizes the decrease of the value in 3 consecutive row at extreme price. I added two type Marks.
Ask/Bid type(triangle Mark) is Ask/Bid values are decreasing of three consecutive row at extreme price.
Row Imbalance type(Diamond Mark) are row Imbalance values are decreasing of three consecutive row at extreme price.
ex)Third lowest Bid 40, second lowest Bid 10 and lowest Bid 5 have triangle up Mark. That is bear's power is gradually diminishing.
(This Mark only check Bid value at lowest price and Ask value at highest price).
Third highest row delta + 60, second highest row delta + 5, highest delta - 20 have diamond Mark. That is Bull's power is gradually diminishing.
Sub display use Delta colors at bottom of Sub display section.
////// Candle & POC /////////
candle and POC
: Ordinary, "POC" Point of Control is row of largest total volume, but this script'POC is volume weighted average.
This is because the regular POC was visually displayed by the profile ,and I was influenced LucF's ideas.
POC coloring is decided in relation to the previous POC. When current POC is higher than previous POC, color is UP Bar Color(green).
In the opposite case, Down Bar color is used.
POC Divergence Color is used when Current POC is up but current bar close is lower than open (Down price Bar),or in the opposite case.
POC coloring has option also highlight background by Delta Divergence Color(yellow). but bg color is displayed at your time frame current price bar not current footprint bar.
The basic explanation is over.
I add some image to promote understanding basic ideas.

JMF_Buy/Sell Delta Pressuredrive.google.com
A lower histogram study showing Buy and sell pressure within the users time frame current candle, along with relative "Delta", the current difference between Bid and Ask volume.
Main histogram is a display of the current chart resolutions buy vs sell volume.
smaller (Thinner) positive and negative histogram that you see extending below the zero line is our current "Relative Delta" the current difference between the buy and sell volume. Sometimes you will see price rising on a negative delta, or vice versa. This can clue us in on underlying buy or sell pressure we may not immediately see.
User has the choice to color the candles with the Relative delta to match the histogram for easier identification of trend shift or change in delta values.
behind the histograms you will see a Bollinger band background. This is simply used to visualize when volatility is expanding and when volume or delta is over extended and we could possibly expect a shift to the opposite side. The default settings on the Bands are set fairly long to have a more consistent benchmark, but user can change the average value (midline simple moving average/volume moving average) to a shorter length to see immediate shifts in volatility and volume.
User has a table included in the subgraph that thoroughly outline all the current metrics that are shown on the histogram, as well as some additional values traders might find useful. Including Relative volume, Daily Volume, Current candle volume, Up (buy) volume, Dn (sell) volume, current bar delta, avg bar delta, Avg 30bar volume, current bars volume vs avg volume, % of Avg, current bars sell % and lastly Premarket volume with user defined time for start and end of Pre market.
As always, the creator of this code is NOT a licensed investment advisor. No output of this tool is to be taken as investment advice or a recommendation to buy or sell any security. Trading is risky, any one using this tool acknowledges they may lose some if not all of their initial investment. User assumes ALL responsibility when using this tool in their technical analysis.

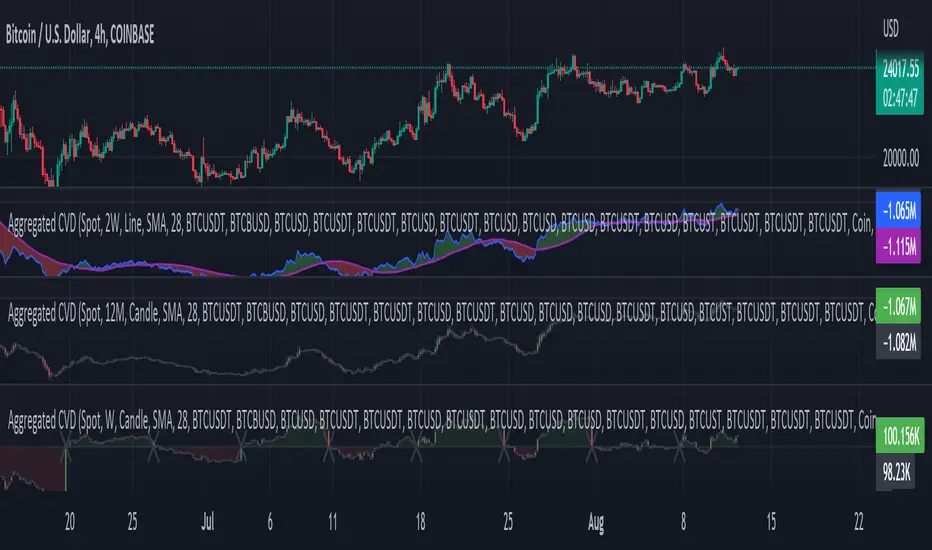
Aggr. CDV / Delta Volume - InFinitoModified & Updated script from MARKET VOLUME by Ricardo M Arjona @XeL_Arjona that Includes Aggregated Volume, Delta Volume, Volume by Side
Aggregation code originally from Crypt0rus
Candle Plotting code from LonesomeTheBlue
***The indicator can be used for any coin/symbol to aggregate volume , but it has to be set up manually***
***The indicator can be used with specific symbol data only by disabling the aggregation option, which allows for it to be used on any symbol***
- Calculated based on Aggregated Volume instead of by symbol volume . Using aggregated data makes it more accurate and allows to compare volume flow between different kinds of markets (Spot, Futures , Perpetuals, Futures+Perpetuals and All Volume ).
- As well, in order to make the data as accurate as possible, the data from each exchange aggregated is normalized to report always in terms of 1 BTC . In case this indicator is used for another symbol, the calculations can be adjusted manually to make it always report data in terms of 1 contract/coin.
All Aggregated Volume By Side: Based of Xel_Arjona's calculation, buy and sell volume is estimated each period. This indicators can display both Buy Volume and Sell Volume for each period.
Aggregated Delta Volume By Side: Displays the difference between Buy & Sell Volume as Delta (Down if Sell Vol - Up if Buy Vol)
Aggregated Cumulative Delta Volume: Displays the sum of Delta Volume as a line, candles or Heiken Aishi Candles. Great for observing Volume Flow and spotting divergences
- It is Possible to add an MA to the CVD and to color fill in between the indicator and the MA
- It is possible to reset the indicators basis to 0 periodically
Volume DeltaVolume Delta is the difference between buying and selling power. Volume Delta is calculated by taking the difference of the volume that traded at the offer price and the volume that traded at the bid price. If delta is greater than 0 you have more buying than selling pressure. If delta is less than 0, you have more selling than buying pressure. This indicator also has a pivots and alarms. Before i create this indicator i'd try all off them on market but all off them seems doing wrong calculation. Price - Some people say "Price Action is King but actually DELTA is King!
By default, this indicator displays “Delta Volume and can be set to:
Plot Levels
Volume
Default TF:
1M
Strategy:
If you get 3 gren delta in a row its buying signal and visa versa for short. You can also use more confirmation with overbought\oversold level.

haDeltaThis Indicator is based on Mr. Dan Valcu ideas.
Bodies of candles(open-close) are the main component used to indicate and assess trend direction, strength, and reversals.
The indicator measures difference between Heikin Ashi close and open.
Measuring the height of candle bodies leads to extreme values that point to trend slowdowns. Thus quantifies Heikin Ashi to get earlier signals.
I used this indicator on Heiken Ashi charts but, it's possible to choose to calculate Body size based on Heiken Ashi or Candles.
haDelta can be smoothed with a simple moving average.
We see that crossings between the haDelta and SMA confirm trend
changes with an anticipated delay introduced by each average. Crossings between the indicator and its average are better
confirmations of trend changes.
When Delta crosses above SMA it is an uptrend.
When Delta crosses below SMA it is a downtrend.
Default haDelta smoothed value is by applying 3 periods SMA.
Also, it is possible to deactivate SMA and see just The Delta Values.
In this indicator can choose the MA period and type.
[UPRIGHT] Awesome DMI+Hello Traders,
Today I'm releasing a spin on an 'oldie but goodie'; the Directional Movement Index (DMI).
DMI is a combination of 3 different indicators developed by the famous J. Welles Wilder. DMI has 3 different plots: the ADX, +DI, and -DI. The first is the ADX (Average Directional Index), which Wilder created in 1978 to show the strength of a trend by comparing the current price with the previous price range. The other two are the +DI (positive directional indicator) and the -DI show up as two separate lines, +DI is the difference between the highest price of the current day and the highest price of the day before, and -DI does the same calculation with the current and previous day's lows.
How does it work?
When the ADX line is above 25 (as a general rule, some traders use a different threshold, +/- 5), the trend is strong. When the +DI line is above the -DI line, the asset (stock) is moving in an uptrend, and the opposite means the asset is in a downtrend.
How is this different?
Uses multiple calculations to produce signals for an indicator than normally doesn't have any.
Multiple ADX's, +DI's, and -DI's for better accuracy and clearer direction changes.
Ability to use 2 different background highlight signals and several buy/sell signals.
Fully customizable (as always), ability to turn on or off any signals, change any of the colors to suit your needs.
Added pre-filled Alerts.
The ribbons created by the fill make it easier to see the change in direction of each plot.
The chart should look like:
Cheers,
Mike
(UPRIGHT TRADING)

Delta Bar Stats SpaceManBTCDelta Bar Stats SpaceManBTC
This is a supplementary tool to DeltaPrint Candles SpaceManBTC, Hence why its inclusion in the chart above. Orderflow traders have access to the bar statistics in a seperate,
container to the candles themselves. This aims to tackle that disparity by providing a solution to tradingview.
Using a calculation that is found in the DeltaPrint Candles SpaceManBTC the data reflected as you can see is the same in the TVOL and DVOL
parameters matching the Total Volume and Delta Volume parameters.
The tool Delta Bar Stats SpaceManBTC also provides access to extra information, Delta Price, Buy Volume, Sell volume.
The Delta price highlighting the DVPOC (delta volume point of control) and the 2 following
refrencing the total buy volume and sell volume in the candle respectively.
Additionally you can see on load 2 settings:
Dynamic Coloring Delta Volume,
changes color based on whether the Total Delta for the candle was positive or negative.
Dynamic Coloring Delta Price,
changes color based on whether price closed above or below the DeltaVPOC
Ticksize is used to determine the amount of data generated, the lower the more information will be provided on the current candle. Using AutoTickSize will do this automatically accounting for recent volatility .
Therefore when using and new, use auto, to switch between charts with ease. On charts that you always keep open it is recommended to manually tune ticksize to your choosing.

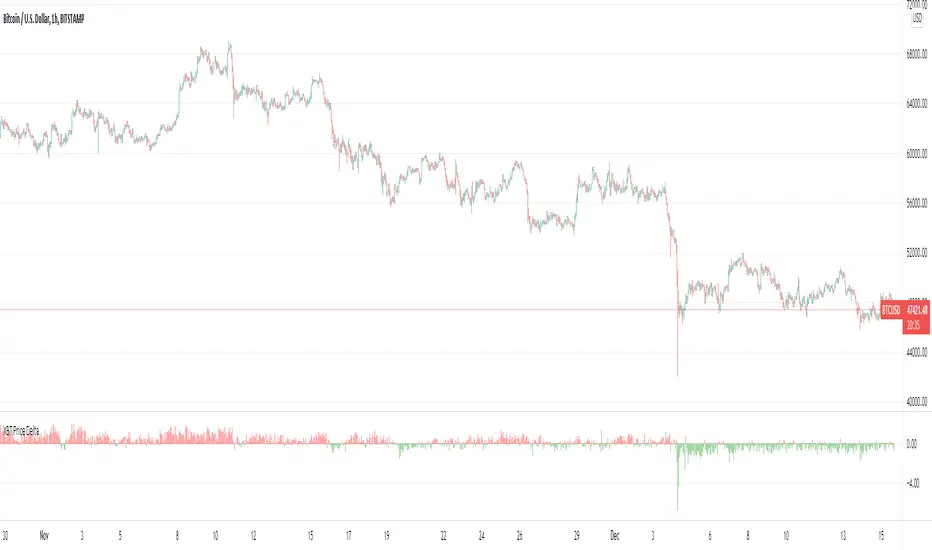
XBT Price DeltaCoinbase spot versus Bybit Perps Indicator
Red = Perps price above Spot price-Perps leading
Green = Spot price above Perps price-Spot Leading
OmegaDeltaExperimental:
- calculates the trajectory of every price change at each bar accordingly to the delta change on the next and so forth,
- the name is just a *pun* at the code☺☺☺

SMART4TRADER-US STOCKSThe indicator is intended to evaluate the stock market , as it takes into account the data on the BUY and SELL of all US shares. In the indicator, you can select various methods for providing data.
Priority = (BUY - SELL) with a intraday cumulative effect.
Ratio = (BUY / SELL) with a intraday cumulative effect.
Delta = (BUY - SELL) on each candle.
Volume = (BUY + SELL) on each candle.
Cumulative = (BUY - SELL) with cumulative for all available history.
------------------------------
Индикатор предназначен для оценки фондового рынка , так как в себе учитывает данные о покупка и продажах всех акций США. В индикаторе можно выбрать различные методы предоставления данных.
PRIORITY = (BUY - SELL) с накопительным эффектом внутри дня.
RATIO= (BUY / SELL) с накопительным эффектом внутри дня.
DELTA= (BUY - SELL) на каждой свече.
VOLUME= (BUY + SELL) на каждой свече.
CUMULATIVE= (BUY - SELL) с накопительным за всю доступную историю на графике.

Delta Continuum SpaceManBTCDelta Continuum SpaceManBTC
This is a tool that ive made with a brand new code base, to assist traders of all timeframes.
The new version of this tool makes use of the intra data to collect the tick for tick data that can be provided, this allows the provisioning of orderflow on tradingview.
Using a calculation of pure tick data and volume calculations, the display is created allowing the means to display a bid and ask seperation functionality to show the trades taking place in a market.
Taking account for this real time data it can show the exact moments a market participant is taking a trade.
This tool is an advanced way of determining the levels of which point is being interacted with to display the points at which a seller has stepped in to interact with a level, providing additional confluences when taking a trade.
Typically the best use case for this indicator is to see when their is a point of trapped traders in the trade, e.g. late longing resistance or late shorting support. Works best on futures contracts due to the high levels of execution volume in comparison.
Highly recommend dialing the ticksize manually. The ticksize for this indicator is best used manually as it allows for greater consistency when seeing who is participating at what level, as auto ticksize,
focuses on the volatility of the previous candle to display some data for the current candle. Now this will make it easier to use, it can reduce the consistency of the indicator when providing data.
Autoticksize will still be useful and will provide some confluence to the new flow traders.
to generate the data the candle must be the realtime candle and will not generate for historical candles, however this data for the real time candle will be only generated from the exact point in time to which the candle is loaded.
The indicator can show both the bid/ask split but alternatively the user can choose to just show the delta instead for ease of viewing.
TO DO:
Release the ticksize candles, to allow for tickbased charts and not just time based.
