Seasonal Performance for Stocks & CryptoThe Seasonal Performance indicator quickly allows you to see if you are in a bullish or bearish time of year for an underlying security and where the current performance stacks up compared to the same time of year historically. Table is fully customizable from colors to what data to see.
Table Displays
Average Performance
Best Performance
Worst Performance
Last Performance
Current Performance
Note this indicator will only work with Stocks, ETF's, Index's or Crypto.
DATA

XAUXXXThis simple script is meant to get around the limitations some data providers have, in terms of the length of historical data they choose to provide traders. Inspired by OANDA's XAUCAD pair only having data as far back as 2005, whereas XAUUSD has data back to to the 19th century.
By taking the OHLC data from XAUUSD and multiplying it by the price of USD in a desired currency you are able to see further back in time, the limitation now being the length of FX data available instead of the price of Precious metal / currency pair. As shown in the chart you can now see the price of Gold in CAD as far back as the late 1960s, a nearly half century of data uncovered for all to see!

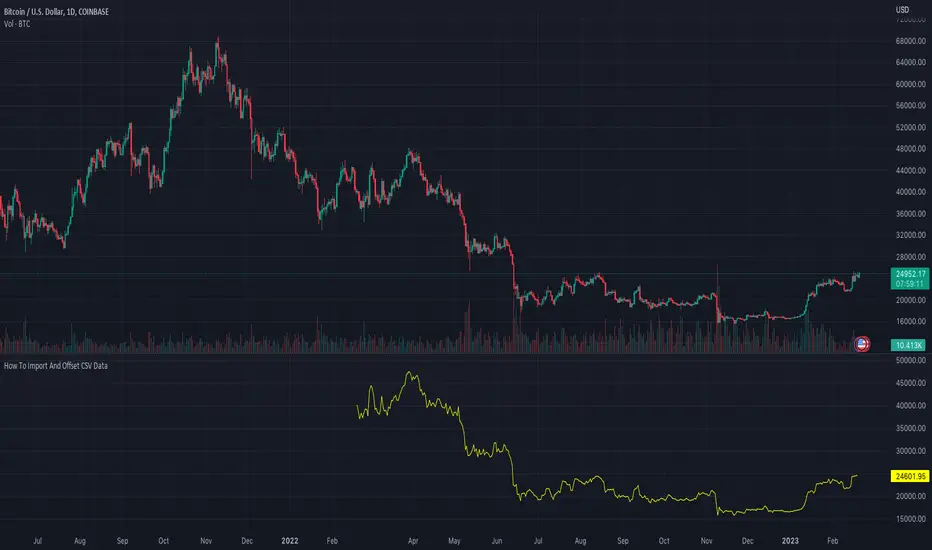
How To Import And Offset CSV DataExample method of how to import, offset, and plot CSV data using an array.
NOTICE: This is an example script and not meant to be used as an actual strategy. By using this script or any portion thereof, you acknowledge that you have read and understood that this is for research purposes only and I am not responsible for any financial losses you may incur by using this script!
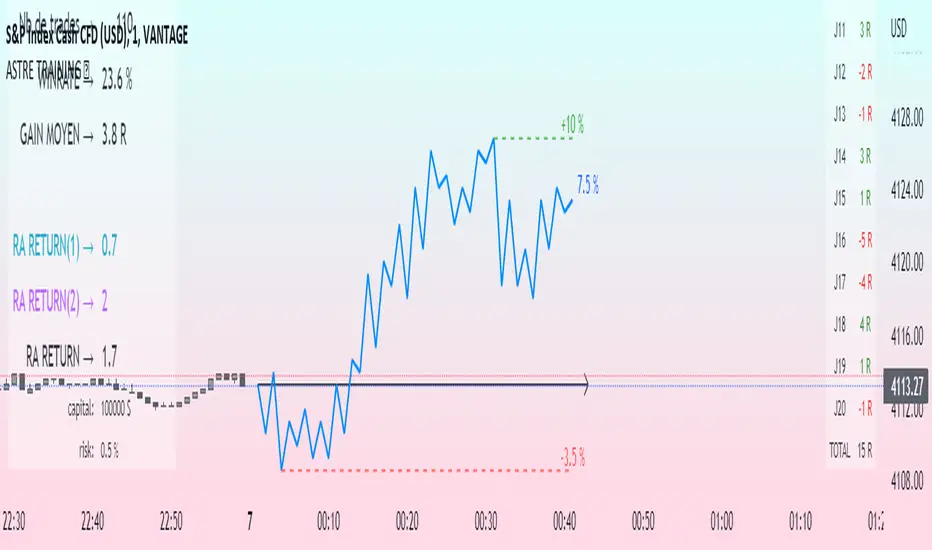
Challenge training (journal)Dynamic trading journal with equity curve display. Detailed results with prop firm objectives, editable, $/month estimation, possibility to compare two strategies.
one line in parameter = one trading day. 20 days max.
For each trading day, specify : The number of trades, the number of SL, the number of total winning RR.
A table at the bottom right summarizes the days and performances during the backtest in order to have an idea of the current performance.
The bottom left table summarizes the overall performance with some key information.
Depending on the number of days traded, a monthly "salary" is deducted, taking into account the prop firm commission.
there is the possibility to define a "Type" for each trading day, 1 or 2. It allows to compare in a binary way, example for type 1: when the high time frame structure is doing well and I am confident for scalping, otherwise type 2.
Again: type 1: SL shorter by 50%, type 2: normal SL etc..
the button "separate 1 and 2" allows to display two additional equity curves : type 1 and type 2. It allows to have a quick visual comparison on the impact of our parameter studied in our backtest on our performance. at the scale of the main equity curve
All the conditions to succeed in the challenge are adjustable in the parameters. The drawdown calculation has been simplified - in order not to have to put 80 trades in the parameters window, I have gathered them by "day", and pessimistically, we consider first the stoplosses and then the take profits, simplifying the performances of the day into "one losing trade" and "one winning trade" (graphically). It is a good compromise between quantity and quality.
Use "A random day trading" indicator to spice up your training.
I hope this will be useful for you to track your performance !
Triangulation : Statistically Approved ReversalsA lot of calculation, but a simple and effective result displayed on the chart.
It automatically identifies a very favorable period for a price reversal, by analyzing the daily and intraday price action statistics from the maximum of the most recent bars from the historical data. No repainting. Alerts can be set.
The statistical study is done in real time for each instrument. The probabilities therefore vary over time and adapt to the latest information collected by the indicator.
The time range of the data study can be changed by simply changing the UT :
- 30m = 3.5 last months feed statistics
- 15m = 52 last days feed statistics
- 5m = 17 last days feed statistics (recommanded)
HOW TO USE
This indicator informs when we are in a time period strongly favorable to reversal.
==> Crossing probabilities of different kinds, in price and in time => Triangulation of top and bottom !
HOW It WORK :
fractal statistics on high and low formation.
hour's probabilities of making the high/low of the day are crossed with day's probabilities of making the high/low of the week.
First for the day, we study:
- value of the probability compared to the average probabilities
- value of the coefficient between the high probability and the low probability
which we then refine for the hour, with the same calculation.
Result: bright color for a day + hour with high probability, weak color if the probability is low but remains the only possible bias. Between these two possibilities, intermediate colors are possible - just like looking for shorts if the day is bullish, if it is a high probability hour!
This color is displayed in the background, only if we are forming the high of the day for tops, and the low of the day for bottoms - detected with a stochastic.
All probabilities are studied in real time for the current asset.
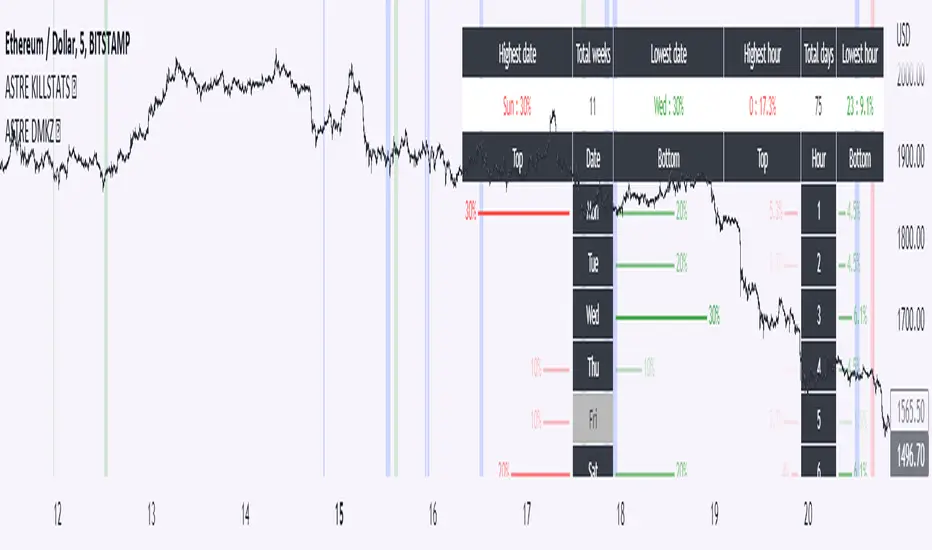
We will call this signal "killstats", for "killzones statistics"
fractal statistics on the probability of closure under specific predefined levels according to 36 cycles.
the probabilities of several cycles are studied, for example:
NY session versus London and Asian sessions, London session compared to its opening, NY session compared to its opening, "algorithmic cycles" ( 1h30), Opening of NY compared to its intersection with London..
Each cycle producing a probability of closing with respect to the opening price of each period. The periods are : (Etc/UTC)
15-18h / 15-16h / 9-13h / 14-17h / 18-22h / 10-12h / 9-10h30 / 10h30-12h / 12-13h30 / 13h30-15h / 15h-16h30 / 16h30-18h
The cycles can be superimposed, which allows to support or attenuate a signal for the key periods of the day: 9am-12pm, and 3pm-6pm. The period of the day covered by the study of cycles is 9h-22h.
Result : ==> a straight line with a half bell. Colors = almost transparent for 53% probability (low), and very intense for a high probability (75%). The line displayed corresponds to the opening price, which we are supposed to close within the time limit - before the end of the period, where the line stops.
If the price goes in the opposite direction to the one predicted by the statistics, then a background connects the price to the close level to be respected.
if direction and close is respected, nothing is displayed : there is no opportunity, no divergence between statistics and actual price moves.
By unchecking the "light mode", you can see each close level displayed on the chart, with the corresponding probability and the number of times the cycle was detected. The color varies from intense for a high probability (75%), to light for a low probability (53%)
We will call this signal "cyclic anomalies"
By default, as shown in the indicator presentation image, the "intersection only" option is checked: only the intersection between 1) killstats and 2) cyclic anomalies is displayed. (filter +-30% of killstats signals)
MORE INFORMATIONS
/!\ : during a backtest, it is necessary to refresh the studied data to benefit from the real time signals, and for that you have to use the replay mode. if "Backtesting informations?"is checked, labels are displayed on the graph to warn of the % distortion of the signals. I recommend using the replay mode every 250 candles, and every 1000 candles for premium accounts, to have real signals.
- Alerts can be set for killzone, or intersections ( As in presentation picture)
- The ideal use is in m5. It can trigger several times a day, sometimes in opposite directions, and sometimes not trigger for several days.
- Premium account have 20k candles data, and not 5k => signals may vary depending on your tradingview subscription.

Probabilities Module - The Quant Science This module can be integrate in your code strategy or indicator and will help you to calculate the percentage probability on specific event inside your strategy. The main goal is improve and simplify the workflow if you are trying to build a quantitative strategy or indicator based on statistics or reinforcement model.
Logic
The script made a simulation inside your code based on a single event. For single event mean a trading logic composed by three different objects: entry, take profit, stop loss.
The script scrape in the past through a look back function and return the positive percentage probability about the positive event inside the data sample. In this way you are able to understand and calculate how many time (in percentage term) the conditions inside the single event are positive, helping to create your statistical edge.
You can adjust the look back period in you user interface.
How can set up the module for your use case
At the top of the script you can find:
1. entry_condition : replace the default condition with your specific entry condition.
2. TPcondition_exit : replace the default condition with your specific take profit condition.
3. SLcondition_exit : replace the default condition with your specific stop loss condition.

Daily Manual KILLZONESThis indicator is to be used with "KILLSTATS", our indicator allowing to backtest on hundreds of days at which time, and which day the top/low of the day and week is formed.
"Manual Killzone" allows to define our statistical killzones by day of the week manually: you define your own rules according to your interpretation of our Killstats indicator.
It integrates a daily price action filter according to the ICT concept:
It will only display bullish probabilities (green) defined if and only if we are in discount and out of the daily range 25/75%.
Same for bearish probabilities (red)
The blue color is to be applied in case of reversal with high contradictory probability (Example: to be used for Tuesday from 2pm to 3pm, if Tuesday is a day with high probability to form a top, but 2pm/15pm is the time with high probability to form a bottom AND a top. Indecision => blue)
WARNING : Calculated according to Etc/UTC time : put "0" in the Timezone parameter of killstats.
It is necessary to use the replay mode regularly during the backtesting to update the data!
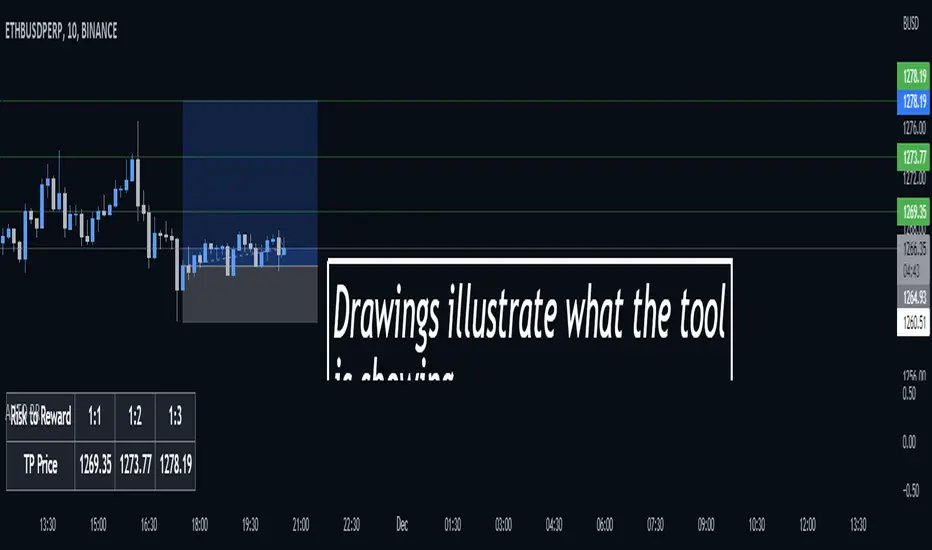
Auto Risk Reward CalculatorAuto RR Calculator
Gives you the price of certain risk to rewards based on your entry and stop loss inputs.
The information given by this tool does not constitute as financial advice.
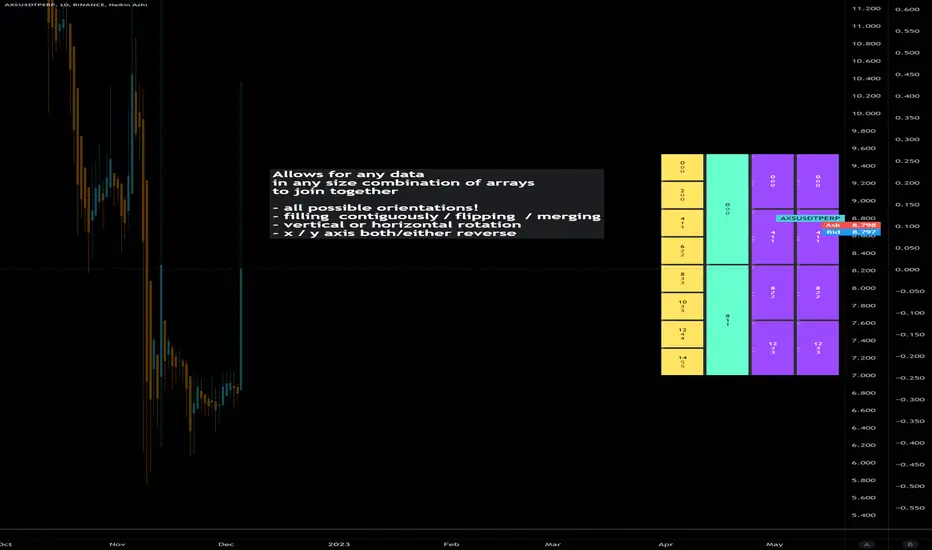
Dynamic Array Table (versatile display methods)Library "datTable"
Dynamic Array Table.... Configurable Shape/Size Table from Arrays
Allows for any data in any size combination of arrays to join together
with:
all possible orientations!
filling all cells contiguously and/or flipping at boundaries
vertical or horizontal rotation
x/y axis direction swapping
all types array inputs for data.
please notify of any bugs. thanks
init(_posit)
Get Table (otional gapping cells)
Parameters:
_posit : String or Int (1-9 3x3 grid L to R)
Returns: Table
coords()
Req'd coords Seperate for VARIP table, non-varip coords
add
Add arrays to display table. coords reset each calc
uses displaytable object, string titles, and color optional array, and second line optional data array.
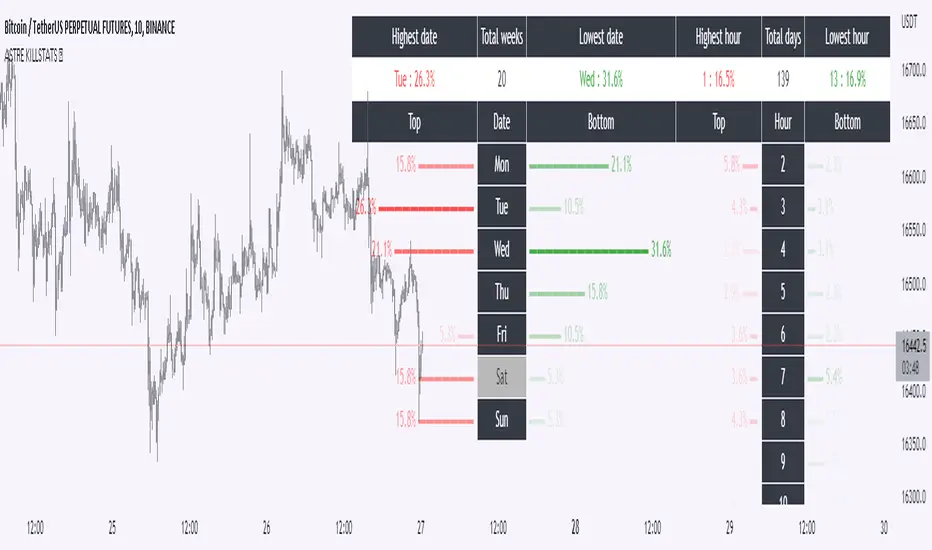
KillstatsBacktest and identify at what times/days the high/low were formed. The periods are shown on the graph along with detailed statistics.
Exemple with "days : 600" and "13h : top 12%" : we understand that over 600 days, in 12% of the cases we have formed the top of the day at 13h.
up to 1000+ days studied to find favorable reversal time slots: killstats! The data presented can sometimes be... surprising.
Increasing/decreasing the timeframe on chart = increase/decrease the studied period.
A period of 1000 days ( UT : h1) allows to have solid but not exact statistics.
A period of 30 days allows to have current statistics but too little sample to know if the data is relevant.
I recommend looking for intersections of killstats over several periods: If over 1000 days AND 30 days, 3pm was a time with a high probability of forming a top, it is interesting to look for short positions between 3pm and 4pm.
The data is displayed in the form of a diagram whose visual allows to identify effective time slots.
Caution. Timeframe: h1 maximum for the study of the day's high/low to be correct - and daily maximum for the study of the week's high/low.
Caution2. Match the timezone with the input (by default set to GMT+1). So if you are at GMT+2, you must put "2" in timezone.
I recommend using this as part of an aggressive high frequency scalping strategy to make the most of your trading session - with the aim of quickly moving to TP1/BE and leaving your winning position open.
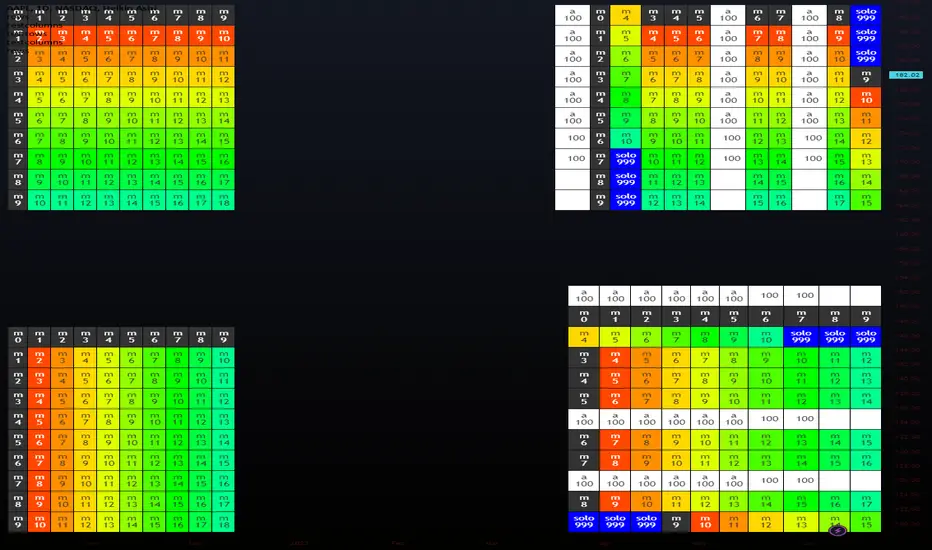
columnsLibrary "columns"
Error Tolerant Matrix Setter/Getter Operations. Easy ways to add/remove items into start and end of Columns as well as arrays to grow and shrink matrix.
if mismatched sizes occur the typified NA value will be there to prevent catastrophic crashing.
Rows and Columns are split into 2 libraries due to limitations on number of exports as well as ease of style (columns.shift(), rows.pop() )
pop(_matrix)
do pop last Column off of matrix
Parameters:
_matrix : Matrix To Edit
Returns: Array of Last Column, removing it from matrix
shift(_matrix)
do shift the first Column off of matrix
Parameters:
_matrix : Matrix To Edit
Returns: Array of First Column, removing it from matrix
get(_matrix, _clmnNum)
retrieve specific Column of matrix
Parameters:
_matrix : Matrix To Edit
_clmnNum : Column being Targeted
Returns: Array of selected Column number, leaving in place
push(_matrix, _clmnNum, _item)
add single item onto end of Column
Parameters:
_matrix : Matrix To Edit
_clmnNum : Column being Targeted
_item : Item to Push on Column
Returns: shifted item from Column start
push(_matrix, _array)
add single item onto end of matrix
Parameters:
_matrix : Matrix To Edit
_array : Array to Push on Matrix
Returns: Void
unshift(_matrix, _clmnNum, _item)
slide single item into start of Column remove last
Parameters:
_matrix : Matrix To Edit
_clmnNum : Column being Targeted
_item : Item to Unshift on Column
Returns: popped item from Column end
unshift(_matrix, _array)
add single item into first Column of matrix
Parameters:
_matrix : Matrix To Edit
_array : Array to unshift into Matrix
Returns: Void
set(_matrix, _clmnNum, _array)
replace an array to an existing Column
Parameters:
_matrix : Matrix To Edit
_clmnNum : Column being Targeted
_array : Array to place in Matrix
Returns: Column that was replaced
insert(_matrix, _clmnNum, _array)
insert an array to a new Column
Parameters:
_matrix : Matrix To Edit
_clmnNum : Column being Targeted
_array : Array to place in Matrix
Returns: void
slideDown(_matrix, _array)
add single item onto end of Column
Parameters:
_matrix : Matrix To Edit
_array : Array to push to Matrix
Returns: shifted first Column
slideUp(_matrix, _array)
add single item onto end of Column
Parameters:
_matrix : Matrix To Edit
_array : Array to unshift to Matrix
Returns: poppeed last Column
pullOut(_matrix, _clmnNum)
add single item onto end of Column
Parameters:
_matrix : Matrix To Edit
_clmnNum : Column being Targeted
Returns: removed selected Column

rowsLibrary "rows"
Error Tolerant Matrix Setter/Getter Operations. Easy ways to add/remove items into start and end of rows as well as arrays to grow and shrink matrix.
if mismatched sizes occur the typified NA value will be there to prevent catastrophic crashing.
columns and rows are split into 2 libraries due to limitations on number of exports as well as ease of style (columns.shift(), rows.pop() )
pop(_matrix)
do pop last row off of matrix
Parameters:
_matrix : Matrix To Edit
Returns: Array of Last row, removing it from matrix
shift(_matrix)
do shift the first row off of matrix
Parameters:
_matrix : Matrix To Edit
Returns: Array of First row, removing it from matrix
get(_matrix, _rowNum)
retrieve specific row of matrix
Parameters:
_matrix : Matrix To Edit
_rowNum : Row being Targeted
Returns: Array of selected row number, leaving in place
push(_matrix, _rowNum, _item)
add single item onto end of row
Parameters:
_matrix : Matrix To Edit
_rowNum : Row being Targeted
_item : Item to Push on Row
Returns: shifted item from row start
push(_matrix, _array)
add single item onto end of matrix
Parameters:
_matrix : Matrix To Edit
_array : Array to Push on Matrix
Returns: Void
unshift(_matrix, _rowNum, _item)
slide single item into start of row remove last
Parameters:
_matrix : Matrix To Edit
_rowNum : Row being Targeted
_item : Item to Unshift on Row
Returns: popped item from row end
unshift(_matrix, _array)
add single item into first row of matrix
Parameters:
_matrix : Matrix To Edit
_array : Array to unshift into Matrix
Returns: Void
set(_matrix, _rowNum, _array)
replace an array to an existing row
Parameters:
_matrix : Matrix To Edit
_rowNum : Row being Targeted
_array : Array to place in Matrix
Returns: row that was replaced
insert(_matrix, _rowNum, _array)
insert an array to a new row
Parameters:
_matrix : Matrix To Edit
_rowNum : Row being Targeted
_array : Array to place in Matrix
Returns: void
slideDown(_matrix, _array)
add single item onto end of row
Parameters:
_matrix : Matrix To Edit
_array : Array to push to Matrix
Returns: shifted first row
slideUp(_matrix, _array)
add single item onto end of row
Parameters:
_matrix : Matrix To Edit
_array : Array to unshift to Matrix
Returns: popped last row
pullOut(_matrix, _rowNum)
add single item onto end of row
Parameters:
_matrix : Matrix To Edit
_rowNum : Row being Targeted
Returns: removed selected row
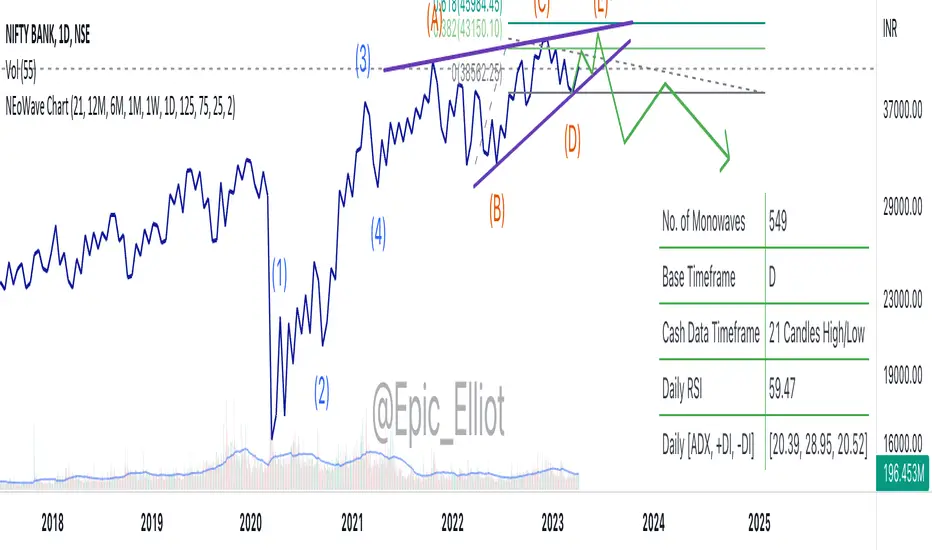
NEoWave Chart This is the indicator used to plot cash data chart for NEoWave analysis.
How to use:
Apply the indicator on the chart.
Select timeframe on your chart.
The indicator will automatically select default cash data timeframe and will plot chart accordingly. If you like to change the cash data timeframe, these is an option to select from dropdown.
FUNCTION: Limited Historical Data WorkaroundFUNCTION: Limited Historical Data Workaround
If you are working with bitcoin weekly charts, or any other ticker with a low amount of price history this function may help you out. For example you want to apply indicators to some shitcoin that just launched? This can help you.
It can be frustrating to use certain built-ins since they will only give an output once the full lookback length is available. This function allows you to avoid that situation and start plotting things with almost no history whatsoever!
In this example code we do it by utilizing a replacement for the built in pine SMA function. This function allows us to pass a series instead of just a simple int to the length variable of the SMA. This can be achieved with all the pine built ins and I believe @pinecoders has a publication already detailing many of them with full coded examples.
Then we replace the length of the SMA with the custom history function. It checks to see if the current bar index is less than the length of the function. Then if it is, it changes the length to the bar index allowing us to get plots and series earlier than otherwise possible.

TradingCube : Moving Average : Data tablePlots moving average both EMA as well as SMA on Multiple timeframes at once in a Tabular Format
for rapid indication of momentum shift as well as slower-moving confirmations.
Displays EMA/SMA 5 8, 13, 21,34,55,89,100,200,400 by default as well as provide the users the flexibility to choose the timeframe as per their set up.

(Subak)Multi timeframe datagridEn)
A table that displays the current data value by time frame.
Indicators show when rsi is oversold (default 27) or overbought (default 73).
The background color indicates that the current price is high or low based on 20mA. When the current price and profit are different from the set value (default 100), the text color is highlighted.
Displays the values of the upper and lower lines of the Bollinger Bands. It is displayed in the background color when it is out of the Bollinger band.
It is designed for monitoring purposes so that you can see the chart when the desired value is found at the time.
-Subak-
Kor)
현재 데이터 값을 시간대별로 표시하는 테이블입니다.
Rsi 가 과매도(기본값 27) 또는 과매수(기본값 73)일 때 배경색을 통해 표시됩니다.
20mA를 기준으로 현재 가격이 높거나 낮음을 배경색으로 표시됩니다. 현재 가격과 설정 값(기본값 100)이 다를 경우 텍스트 색상이 강조 표시됩니다.
볼린저 밴드의 상단 및 하단 라인 값을 표시합니다. 볼린저 밴드를 벗어나면 배경색으로 표시됩니다.
해당 시간에 해당 보조지표의 값을 기준으로 챠트를 볼 수 있도록 모니터링용으로 개발되었습니다.
-Subak-

Bitcoin OnChain & Other MetricsHi all,
In these troubled times, going back to fundamentals can sometimes be a good idea 😊
I put this one up using data retrieved from “Nasdaq Data Link” and their “Blockchain.com” database.
Here is a good place to analyses some Bitcoin data “outside” its price action with 25 different data sets.
Just go to the settings menu and display the ones you are interested in.
If you want me to add more metrics, feel free to DM or comment below!
Hope you enjoy 😉

NEoWave Cash Data Pro by ArshiaRahimiNEoWave Cash Data Pro by ArshiaRahimi (Cash Data Display Indicator)
By using this indicator, you can see cash data in the Trading View Charts. Cash Data is NEoWave approach data and is used for wave counting of this type. Analysts of Elliot Wave approach can also benefit from this data.
In Cash Data, the state of high and low of the candles or in other words their chronology will be determined and the path of price movement will be indicated clearly.
You will have no limit to view cash data using this indicator and you will be able to view the cash data of any part of the chart you would like with a 100 percent precision. By default, Indicator shows MonoWave 500 in the ending part of the chart but in order to view the cash data of other parts, you only need to activate the option “ Custom Start” and by adjusting the date of drawing the cash data, you can make the cash data of the part you want to be displayed.
The cash data of each chart is displayed in 20 different timeframes including:
• Annual timeframe
• Monthly, 3month, 6 month timeframe
• weekly, 2 week timeframe
• daily, 2 day, 3 day timeframe
• 6 hour, 12 hour timeframe
• 4 hour, 8 hour timeframe
• 1 hour, 2 hour, 3 hour timeframe
• 5 minute, 10 minute, 15 minute, 30 minute timeframe
Other features are also incorporated in this indicator including:
• determination of cash data thickness
• determination of ascending MonoWaves color
• determination of descending MonoWaves color
• determination of connecting MonoWaves color
• displaying the MonoWaves which might be in question (when high and low occur in a candle)
• determination of the questionable MonoWaves color
• determination of the date and starting time of cash data drawing
• Drawing of the last cash data live and the possibility of determining its drawing delay.
• Displaying time slot separator lines
• Determination of separator lines color and transparency
• Displaying Fade Chart behind cash data
• determination of fade chart candles color and transparency
• displaying information table of cash data in the corner of the chart which include displaying time frame of the cash data and the number of MonoWaves that exist in the chart.
This indicator is designed by Arshia Rahimi of Iran NEoWave Institute. You can be in touch through “ArshiaRahimi” ID.
The Indicator will continuously receive its new updates. after publishing, each update will replace the previous version by trading view.

Neowave Chart PlotterThis Indicator is applicable to plot wave charts as per the NeoWave method (Neely Extension of Wave Theory). NeoWave is a scientific, objective and revolutionary style of Elliott Wave Theory that was invented by Glenn Neely in 1990 in the “Mastering Elliott Wave” book.
To start analyzing with this method, we need a particular chart called the Wave Chart or Cash Data chart. This is the first step for a good wave analysis. To draw this chart, Highs and Lows should be plotted in the order that they occurred. This could be a very challenging and time-consuming task to do for any symbol on any Timeframe.
This Indicator can accurately Find High and low in each Period and draw them in the order that they occurred. for any Symbol on any Timeframe automatically and in real-time.
For example on Monthly timeframe, indicator separates each year and find high and low on the period. Then it recognizes which occurred early and plot them in order that occurred. this called "Yearly Wave Chart" and you can start to analysis it, base on Neowave method.
Important : This Indicator Works on All Type of Accounts
Some features of this Expert Adviser are:
- Draw Wave Chart on yearly, monthly, weekly, daily, hourly and minutely timeframes
- Draw Wave Chart on any integer multiples of above timeframes
- Switch between Wave Chart and Candlestick Chart simultaneously
- Online auto updating Wave Charts
- Possibility of putting watermarks
- Show Monowaves count
- Show Suspicions Monowave (where high and low occur on same Bar)
- Show Triple Monowave (where high or low occur twice on a period)
- Show Monowaves count
- plotting wave chart base on Calendar and bar count
- Show Monowaves count
- plotting wave chart on Equal distances

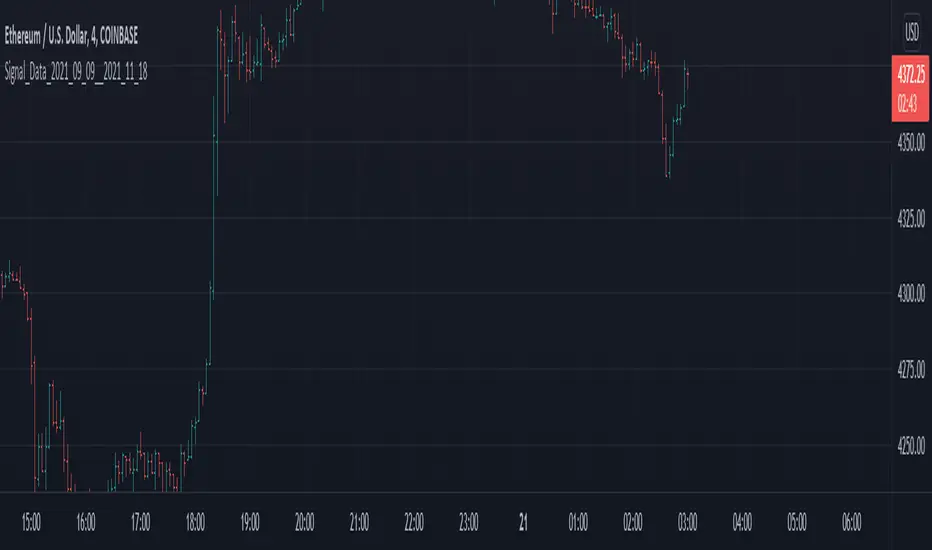
Signal_Data_2021_09_09__2021_11_18Library "Signal_Data_2021_09_09__2021_11_18"
Functions to support my timing signals system
import_start_time(harmonic) get the start time for each harmonic signal
Parameters:
harmonic : is an integer identifying the harmonic
Returns: the starting timestamp of the harmonic data
import_signal(index, harmonic) access point for pre-processed data imported here by copy paste
Parameters:
index : is the current data index, use 0 to initialize
harmonic : is the data set to index, use 0 to initialize
Returns: the data from the indicated harmonic array starting at index, and the starting timestamp of that data
DataCleanerLibrary "DataCleaner"
Functions for acquiring outlier levels and acquiring a cleaned version of a series.
outlierLevel(src, len, level) Gets the (standard deviation) outlier level for a given series.
Parameters:
src : The series to average and add a multiple of the standard deviation to.
len : The The number of bars to measure.
level : The positive or negative multiple of the standard deviation to apply to the average. A positive number will be the upper boundary and a negative number will be the lower boundary.
Returns: The average of the series plus the multiple of the standard deviation.
cleanUsing(src, result, len, maxDeviation) Returns an array representing the result series with (outliers provided by the source) removed.
Parameters:
src : The source series to read from.
result : The result series.
len : The maximum size of the resultant array.
maxDeviation : The positive or negative multiple of the standard deviation to apply to the average. A positive number will be the upper boundary and a negative number will be the lower boundary.
Returns: An array containing the cleaned series.
clean(src, len, maxDeviation) Returns an array representing the source series with outliers removed.
Parameters:
src : The source series to read from.
len : The maximum size of the resultant array.
maxDeviation : The positive or negative multiple of the standard deviation to apply to the average. A positive number will be the upper boundary and a negative number will be the lower boundary.
Returns: An array containing the cleaned series.
outlierLevelAdjusted(src, level, len, maxDeviation) Gets the (standard deviation) outlier level for a given series after a single pass of removing any outliers.
Parameters:
src : The series to average and add a multiple of the standard deviation to.
level : The positive or negative multiple of the standard deviation to apply to the average. A positive number will be the upper boundary and a negative number will be the lower boundary.
len : The The number of bars to measure.
maxDeviation : The optional standard deviation level to use when cleaning the series. The default is the value of the provided level.
Returns: The average of the series plus the multiple of the standard deviation.

Function - Sequence From SeriesFunction to create a array from a sample taken from a series (ex:. close, hlc3...).

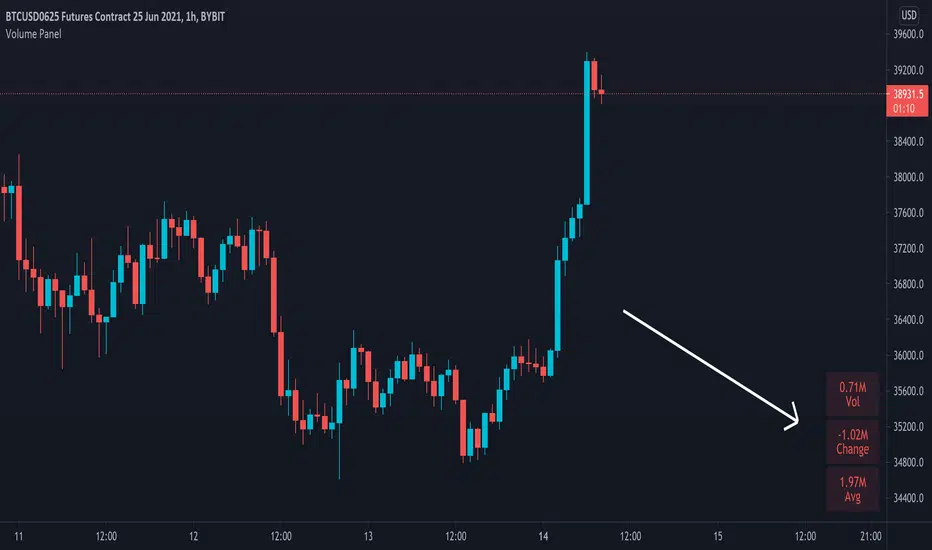
Volume PanelDisplays volume data in panel on bottom right of screen. Shows current bar, change from last bar and average of last 20 bars. This number can be changed in settings if you wish to have the average calculated on a different amount of bars.