BTC Confluence Score + Confirmed Signals (12m/1h)This script combines 7 different signals across multiple timeframes (12 min + 1 hour + BTC dominance), then only gives you a BUY or SELL when everything aligns.
It’s designed to filter out fake-outs and help you catch momentum reversals that stick.
WHAT IT’S DOING UNDER THE HOOD
Timeframes
12 min (fast) → short-term trigger (RSI, Stoch RSI, volatility)
1 hour (slow) → trend confirmation (EMA structure, RSI, MACD)
BTC Dominance (1 h) → strength/flow confirmation (is capital rotating into BTC or alts?)
This gives you a multi-timeframe confluence, which is what professional traders look for before entering a trade.
2. The 7 “Score” Ingredients
Each bar gets a “score” from –7 (super bearish) to +7 (super bullish) based on:
# Condition Bullish signal (+1) Bearish signal (–1)
1 RSI (12m) RSI > 50 RSI < 50
2 RSI (1h) RSI > 50 RSI < 50
3 MACD Histogram > 0 Histogram < 0
4 BTC Dominance level > 59.8 % < 59.8 %
5 BTC Dominance trend 3 EMA > 8 EMA 3 EMA < 8 EMA
6 1h EMAs trend 50 EMA > 200 EMA and price > 50 EMA 50 EMA < 200 EMA and price < 50 EMA
7 Volatility (ATR) Current ATR > average (momentum increasing) —
The Confluence Score bar at the bottom shows this numerically:
💚 +5 to +7 → Strong bullish conditions
❤️ –5 to –7 → Strong bearish conditions
🩶 Between –2 and +2 → Choppy / neutral
3️⃣ Confirmed Entry Logic (the clear triangles you see now)
You’ll now see only two real actionable markers:
✅ BUY (Green Triangle Up)
Triggered when:
Stoch RSI crosses upward on 12 min
RSI > 50 (momentum confirmation)
MACD histogram > 0 (trend shift)
Confluence score ≥ 4 (default threshold)
This means momentum + trend + structure + volume all agree on an upward move.
→ Ideal for going long or closing shorts.
🚨 SELL (Red Triangle Down)
Triggered when:
Stoch RSI crosses downward
RSI < 50
MACD histogram < 0
Confluence score ≥ 4 bearish
That’s your exit / short confirmation.
4️⃣ Color Bars (Score Strength)
At the bottom of the chart:
💚 Green Bars = full bullish confluence (+5 or more)
💛 Lime/Orange Bars = moderate bullish or early reversal
❤️ Red Bars = strong bearish confluence (–5 or less)
🩶 Gray Bars = chop/no edge
If you prefer visual simplicity, just use:
BUY = Green Triangle appears on green bars
SELL = Red Triangle appears on red bars
That’s your “double confirmation.”
🎯 HOW TO TRADE IT
⏱ Timeframes
Use 12 min for entries (fast scalps or 1–2 hr setups).
Confirm direction with the 1 hour timeframe — only trade in that direction.
💰 Entry Playbook
Signal What to Do
✅ Green Triangle appears Enter long or scale in. Set stop below recent swing low.
🚨 Red Triangle appears Exit long / enter short / scale out.
Bars gray or alternating Stay out — market is undecided.
🧮 Min Score Setting
Default = 4 (balanced).
Raise to 5 for cleaner, fewer signals.
Lower to 3 for more aggressive, frequent trades.
📲 Alerts
You can now create TradingView alerts using:
BUY Confirmed
SELL Confirmed
Set alert type:
“Once per bar close” — so you only get notified after confirmation, not mid-bar noise.
Y ou now have your own BTC AI Confluence System:
Filters all noise from RSI, MACD, EMAs, volatility, and BTC dominance
Waits for perfect alignment across multiple timeframes
Gives you one simple green (BUY) or red (SELL) signal
Lets you scalp 1–2 % moves safely or swing trade confirmations
Cykle

Relative Valuation OscillatorRelative Valuation Oscillator (RVO) Description
The Valuation_OTC.pine script is a Relative Valuation Oscillator for TradingView that compares the current asset against a reference asset (like Bitcoin, S&P 500, or Gold) to determine if it's relatively overvalued or undervalued.
Key Features:
1. Multiple Calculation Methods:
Simple Ratio - Compares price ratio deviation from average
Percentage Difference - Direct percentage comparison between assets
Ratio Z-Score - Statistical measure (standard deviations from mean)
Rate of Change Comparison - Compares momentum/performance
Normalized Ratio - 0-100 scale centered at zero
2. Customizable Settings:
Reference asset selection (default: BTC/USDT)
Adjustable lookback period (10-500 bars)
Optional smoothing with configurable period
Overbought/oversold level thresholds (default: ±1.5)
3. Trading Signals:
Overvalued - Oscillator above overbought level (red zone)
Undervalued - Oscillator below oversold level (green zone)
Neutral - Between thresholds
Crossover alerts for key levels
Divergence detection (bullish/bearish)
4. Visual Components:
Color-coded oscillator line (green when positive, red when negative)
Optional signal line for additional smoothing
Background shading for valuation zones
Information table showing current metrics and status
Shape markers for crossovers and divergences
5. Alert Conditions:
Overvalued/undervalued alerts
Zero-line crossovers
Divergence signals
This indicator is useful for pairs trading, relative strength analysis, and identifying when an asset is trading at extremes relative to a benchmark asset.

BTC Confluence Alert 1 Overall Purpose
This script is a custom TradingView indicator that scans for confluence (agreement) between:
BTC’s short-term and medium-term momentum (12-minute and 1-hour RSIs),
The MACD histogram (trend direction and momentum strength),
Bitcoin dominance (money flowing back into BTC).
When all three are bullish, it flashes green and triggers a single alert.

Session Anchor Lines (Asia, London, NY)it draws a line at each session open ( in relative to the 4 HR candle )
Buy vs Sell Liquidity + Difference (Bottom Right)Script Summary (Short Notes)
⚙️ Purpose
Tracks and displays Buy Volume vs Sell Volume difference during the day, based on candle direction.
Useful for spotting liquidity imbalance between buyers and sellers.
📊 How It Works
Volume Classification
If close > open → counts volume as Buy Volume
If close < open → counts volume as Sell Volume
Aggregation Timeframe
You can select a timeframe (1, 2, 3, 5, 15, 30 mins)
Script recalculates data from that aggregation level.
Daily Reset
At the start of a new trading day, totals reset to zero.
Cumulative Calculation
Adds all buy/sell volumes as the day progresses.
Calculates:
Total Volume
Difference (BUY − SELL)
Percentages (%)

SPX / Silver (XAGUSD) RatioThis script visualizes the S&P 500 Index to Silver ratio (SPX/Silver) — a powerful tool for monitoring the relative strength of equities vs. precious metals over time.
📊 Use Case:
Helps traders assess macro sentiment shifts between risk-on (equities) and risk-off (commodities).
A rising ratio indicates equity outperformance vs Silver, often in growth-driven bull markets.
A falling ratio suggests Silver is outperforming — potentially due to inflation, geopolitical risk, or weakening equities.
⚙️ Data & Calculation:
SPX: SP:SPX (S&P 500 Index)
Silver: TVC:SILVER
Formula:
SPX / Silver
(Both are spot/index prices, updated on daily timeframe)
📈 Interpretation:
📈 Ratio Rising → SPX outperforming Silver → Risk-on sentiment
📉 Ratio Falling → Silver outperforming SPX → Possible flight to safety or inflation hedge
🧠 Ideal For:
Macro trend analysis
Intermarket strategy development
Asset rotation decision-making
Spotting Silver bottoms during SPX/Silver peak zones

Bitcoin Cycles Halvins/Tops/Bottoms By CrBeThis Script shows you the actual Bitcoin tops and bottoms dates.

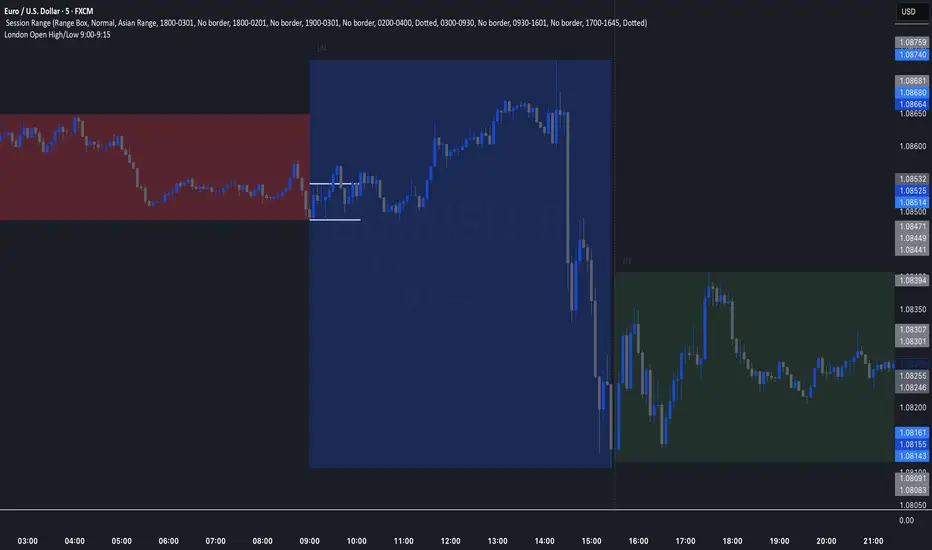
London Open High/Low 9:00-9:15indicator marks out high and low of the first 15 minutes of the London session.
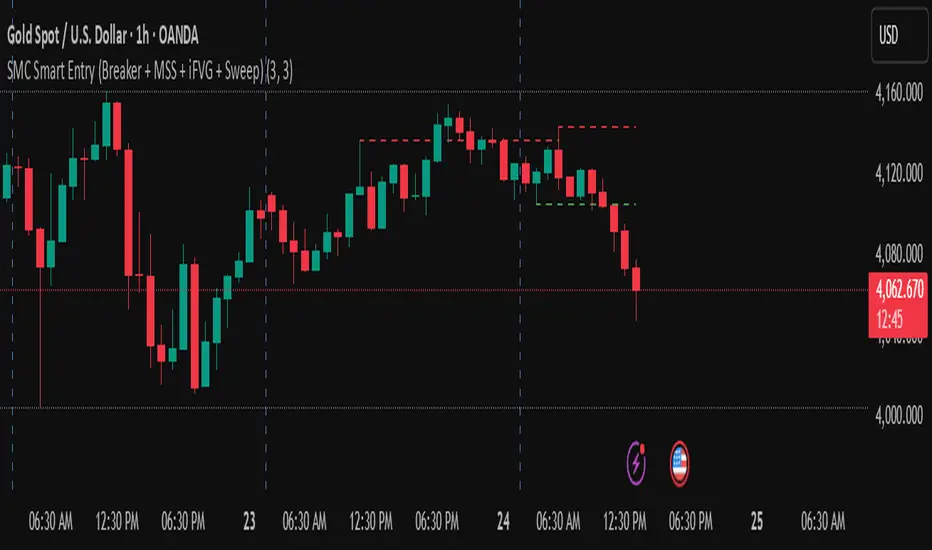
golden smart entrySmart Money Concepts (SMC) is a trading methodology that focuses on understanding and following the behavior of institutional investors—often referred to as "smart money." The goal is to identify high-probability trade setups by analyzing how these large players move the market.
First X Days Of A YearFirst X-Day Indicator
Overview
The "First X-Day Indicator" is a powerful tool to visualize and analyze market sentiment during the crucial first trading days of each new year. It provides immediate visual feedback on whether the year is starting with positive or negative momentum compared to the previous year's close, a concept often related to market theories like the "January Effect" or the "First Five Days Rule."
The indicator is designed to be clean, intuitive, and fully customizable to fit your charting style.
Key Features
Yearly Baseline: Automatically draws a horizontal line at the previous year's closing price. This line serves as a clear 0% reference for the current year's performance.
Dynamic Background Coloring: For a user-defined number of days at the start of the year, the chart background is colored daily. Green indicates the close is above the previous year's close, while red indicates it's below.
Final Performance Symbol: At the end of the analysis period (e.g., on the 5th day), a single summary symbol (like 👍 or 👎) appears. This symbol represents the final performance outcome of the initial trading period.
Settings & Customization
You have full control over all visual elements:
Analysis Period: Define exactly how many days at the start of the year you want to analyze (e.g., 3, 5, or 10 days).
Line Customization: Fully control the yearly baseline's appearance. You can change its color, width, and style (Solid, Dashed, or Dotted) or hide it completely.
Symbol Customization: Choose any character or emoji for the positive and negative performance symbols. You can also adjust their size (Small, Normal, Large) or hide them.
Background Control: Enable or disable the daily background coloring and select your preferred custom colors for positive and negative days.

mean reversion Spread Z-Score Your main "actor" is the Blue Line 🔵 (the Z-Score). It tells you if your spread is "expensive" or "cheap" compared to its average.
The other lines are your action zones.
Here is how to read the signals:
Scenario 1: SELL the Spread (The spread is TOO EXPENSIVE)
• ENTRY Signal: The Blue Line 🔵 moves up and crosses the Red Line 🔴 (at +1.8).
• Meaning: MNQ has become far too expensive compared to MES. The rubber band is stretched too far upwards.
• Your Action (Sell):
• ✅ SELL MNQ
• ✅ BUY MES
• EXIT Signal: The Blue Line 🔵 comes back down and crosses the Dotted Red Line (at +0.5).
• Meaning: The rubber band is back to normal. It's time to take your profits.
• Your Action (Close):
• ✅ BUY BACK your MNQ
• ✅ SELL your MES
Scenario 2: BUY the Spread (The spread is TOO CHEAP)
• ENTRY Signal: The Blue Line 🔵 moves down and crosses the Green Line 🟢 (at -1.8).
• Meaning: MNQ has become far too cheap compared to MES. The rubber band is stretched too far downwards.
• Your Action (Buy):
• ✅ BUY MNQ
• ✅ SELL MES
• EXIT Signal: The Blue Line 🔵 moves back up and crosses the Dotted Green Line (at -0.5).
• Meaning: The rubber band is back to normal. It's time to take your profits.
• Your Action (Close):
• ✅ SELL your MNQ
• ✅ BUY BACK your MES
In summary:
• Blue Line 🔵 touches Red Line 🔴 = Sell the spread.
• Blue Line 🔵 touches Green Line 🟢 = Buy the spread.

Previous session High/Low – Asia London USA Overview
This indicator automatically plots the Previous Day’s (PD) session Highs and Lows for the Asia (Tokyo), London, and USA (New York) trading sessions.
Each session is color-coded for clarity:
🟩 Asia (Green)
🟥 London (Red)
🟦 USA (Blue)
At the close of each session, the indicator records that session’s high and low, draws horizontal lines across the chart, and labels them neatly in the center of each range — above the high and below the low for perfect visual balance.
⚙️ How It Works
The script continuously tracks the current high and low within each session.
When a session closes, those values are locked in as the PD High and PD Low.
Clean lines and centered labels are drawn immediately.
The labels automatically offset slightly above or below the line to avoid overlap, with user-controlled spacing.
This helps traders quickly identify where price interacts with the previous session’s structure, a core concept for many session-based and liquidity-based strategies.
🧭 Sessions and Timezones
Each market session runs in its native timezone, so you can align them perfectly to your chart or your preferred trading hours:
Asia Session: Default 08:30 – 11:00 (Australia/Adelaide time)
London Session: Default 08:00 – 10:00 (Europe/London)
USA Session: Default 09:30 – 16:00 (America/New_York)
You can change each session’s hours and timezone from the Inputs panel.
🎨 Customization
In the Inputs menu you can:
Toggle each session on or off
Choose line color and thickness
Enable or disable labels
Adjust vertical offset (ticks) for label spacing
“High label offset” – moves label further above the high line
“Low label offset” – moves label further below the low line
These adjustments make it easy to keep charts clean and readable on any instrument or timeframe.
📈 Practical Use
This indicator is ideal for:
Session traders who mark PD Highs/Lows as liquidity zones
London or NY session scalpers who watch for breakouts, fakeouts, or reversals
ICT / Smart Money Concepts users wanting automatic session reference levels
Anyone wanting a quick visual map of inter-session structure

PM Range Breaker [CHE] PM Range Breaker — Premarket bias with first-five range breaks, optional SWDEMA regime latch, and simple two-times-range targets
Summary
This indicator sets a once-per-day directional bias during New York premarket and then tracks a strict first-five-minutes range from the session open. After the first five complete, it marks clean breakouts and can project targets at two times the measured range. A second mode latches an EMA-based regime to inform the bias and optional background tinting. A compact panel reports live state, first-five levels, and rolling hit rates of both bias modes using a user-defined midday close for statistics.
Motivation: Why this design?
Intraday traders often get whipsawed by early noise or by fast flips in trend filters. This script commits to a bias at a single premarket minute and then waits for the market to present an objective structure: the first-five range. Breaks after that window are clearer and easier to manage. The alternative SWDEMA regime gives a slower, latched context for users who prefer a trend scaffold rather than a midpoint reference.
What’s different vs. standard approaches?
Baseline: Typical open-range-breakout lines or a single moving-average filter without daily commitment.
Architecture differences:
Bias decision at a fixed New York time using either a midpoint lookback (“Classic”) or a two-EMA regime latch (“SWDEMA”).
Strict five-minute window from session open; breakout shapes print only after that window.
Single-shot breakout direction per session (debounce) and optional two-times-range targets.
On-chart panel with hit rates using a configurable midday close for statistics.
Practical effect: Cleaner visuals, fewer repeated signals, and a traceable daily decision that can be evaluated over time.
How it works (technical)
Time handling uses New York session times for premarket decision, open, first-five end, and a midday statistics checkpoint.
Classic bias: A midpoint is computed from the highest and lowest over a user period; at the premarket minute, the bias is set long when the close is above the midpoint, short otherwise.
SWDEMA bias: Two EMAs define a regime score that requires price and trend agreement; when both agree on a confirmed bar, the regime latches. At the premarket minute, the daily bias is set from the current regime.
The first-five range captures high and low from open until the end minute, then freezes. Breakouts are detected after that window using close-based cross logic.
The script draws range lines and optional targets at two times the frozen range. A session break direction latch prevents duplicate break markers.
Statistics compare daily open and a configurable midday close to record if the chosen bias aligned with the move.
Optional elements include EMA lines, midpoint line, latched-regime background, and regime switch markers.
Data aggregation for day logic and the first-five window is sampled on one-minute data with explicit lookahead off. On charts above one minute, values update intra-bar until the underlying minute closes.
Parameter Guide
Premarket Start (NY) — Minute when the bias is decided — Default: 08:30 — Move earlier for more stability; later for recency.
Market Open (NY) — Session start used for the first-five window — Default: 09:30 — Align to instrument’s RTH if different.
First-5 End (NY) — End of the first-five window — Default: 09:35 — Extend slightly to capture wider opening ranges.
Day End (NY) for Stats — Midday checkpoint for hit rate — Default: 12:00 — Use a later time for a longer evaluation window.
Show First-5 Lines — Draw the frozen range lines — Default: On — Turn off if your chart is crowded.
Show Bias Background (Session) — Tint by daily bias during session — Default: On — Useful for directional context.
Show Break Shapes — Print breakout triangles — Default: On — Disable if you only want lines and alerts.
Show 2R Targets (Optional) — Plot targets at two times the range — Default: On — Switch off if you manage exits differently.
Line Length Right — Extension length of drawn lines — Default: 20 (bars) — Increase for slower timeframes.
High/Low Line Colors — Visual colors for range levels — Defaults: Green/Red — Adjust to your theme.
Long/Short Bias Colors — Background tints — Defaults: Green/Red with high transparency — Lower transparency for stronger emphasis.
Show Corner Panel — Enable the info panel — Default: On — Centralizes status and numbers.
Show Hit Rates in Panel — Include success rates — Default: On — Turn off to reduce panel rows.
Panel Position — Anchor on chart — Default: Top right — Move to avoid overlap.
Panel Size — Text size in panel — Default: Small — Increase on high-resolution displays.
Dark Panel — Dark theme for the panel — Default: On — Match your chart background.
Show EMA Lines — Plot blue and red EMAs — Default: Off — Enable for SWDEMA context.
Show Midpoint Line — Plot the midpoint — Default: Off — Useful for Classic mode visualization.
Midpoint Lookback Period — Bars for high-low midpoint — Default: 300 — Larger values stabilize; smaller values respond faster.
Midpoint Line Color — Color for midpoint — Default: Gray — A neutral line works best.
SWDEMA Lengths (Blue/Red) — Periods for the two EMAs — Defaults: 144 and 312 — Longer values reduce flips.
Sources (Blue/Red) — Price sources — Defaults: Close and HLC3 — Adjust if you prefer consistency.
Offsets (Blue/Red) — Pixel offsets for EMA plots — Defaults: zero — Use only for visual shift.
Show Latched Regime Background — Background by SWDEMA regime — Default: Off — Separate from session bias.
Latched Background Transparency — Opacity of regime background — Default: eighty-eight — Lower value for stronger tint.
Show Latch Switch Markers — Plot regime change markers — Default: Off — For auditing regime changes.
Bias Mode — Classic midpoint or SWDEMA latch — Default: Classic — Choose per your style.
Background Mode — Session bias or SWDEMA regime — Default: Session — Decide which background narrative you want.
Reading & Interpretation
Panel: Shows the active bias, first-five high and low, and a state that reads Building during the window, Ready once frozen, and Break arrows when a breakout occurs. Hit rates show the percentage of days where each bias mode aligned with the midday move.
Colors and shapes: Green background implies long bias; red implies short bias. Triangle markers denote the first valid breakout after the first-five window. Optional regime markers flag regime changes.
Lines: First-five high and low form the core structure. Optional targets mark a level at two times the frozen range from the breakout side.
Practical Workflows & Combinations
Trend following: Choose a bias mode. Wait for the first clean breakout after the first-five window in the direction of the bias. Confirm with structure such as higher highs and higher lows or lower highs and lower lows.
Exits and risk: Conservative users can trail behind the opposite side of the first-five range. Aggressive users can scale near the two-times-range target.
Multi-asset and multi-TF: Works well on intraday timeframes from one minute upward. For non-US sessions, adjust the time inputs to the instrument’s regular trading hours.
Behavior, Constraints & Performance
Repaint and confirmation: Bias and regime decisions use confirmed bars. Breakout signals evaluate on bar close at the chart timeframe. On higher timeframes, minute-based sources update within the live bar until the minute closes.
security and HTF: The script samples one-minute data. Lookahead is off. Values stabilize once the source minute closes.
Resources: `max_bars_back` is five thousand. Drawing objects and the panel update efficiently, with position extensions handled on the last bar.
Known limits: Midday statistics use the configured time, not the official daily close. Session logic assumes New York session timing. Targets are simple multiples of the first-five range and do not adapt to volatility beyond that structure.
Sensible Defaults & Quick Tuning
Start with Classic bias, midpoint lookback at three hundred, and all visuals on.
Too many flips in context → switch to SWDEMA mode or increase EMA lengths.
Breakouts feel noisy → extend the first-five end by a minute or two, or wait for a retest by your own rules.
Too sluggish → reduce midpoint lookback or shorten EMA lengths.
Chart cluttered → hide EMA or midpoint lines and keep only range levels and breakout shapes.
What this indicator is—and isn’t
This is a visualization and signal layer for session bias and first-five structure. It does not manage orders, position sizing, or risk. It is not predictive. Use it alongside market structure, execution rules, and independent risk controls.
Disclaimer
The content provided, including all code and materials, is strictly for educational and informational purposes only. It is not intended as, and should not be interpreted as, financial advice, a recommendation to buy or sell any financial instrument, or an offer of any financial product or service. All strategies, tools, and examples discussed are provided for illustrative purposes to demonstrate coding techniques and the functionality of Pine Script within a trading context.
Any results from strategies or tools provided are hypothetical, and past performance is not indicative of future results. Trading and investing involve high risk, including the potential loss of principal, and may not be suitable for all individuals. Before making any trading decisions, please consult with a qualified financial professional to understand the risks involved.
By using this script, you acknowledge and agree that any trading decisions are made solely at your discretion and risk.
Do not use this indicator on Heikin-Ashi, Renko, Kagi, Point-and-Figure, or Range charts, as these chart types can produce unrealistic results for signal markers and alerts.
Best regards and happy trading
Chervolino
Many thanks to LonesomeTheBlue
for the original work. I adapted the midpoint calculation for this script. www.tradingview.com

Indian Gold Festival Dates HistoricalIndian Gold Festival Dates (1975-2025)
Marks 8 major Indian festivals associated with gold buying over 50 years of historical data. Essential for analyzing seasonal patterns and cultural demand cycles in gold markets.
Festivals Included:
Dhanteras (Gold) - Most auspicious gold buying day
Diwali (Orange) - Festival of Lights
Akshaya Tritiya (Green) - "Never-ending" prosperity
Dussehra (Red) - Victory and success
Makar Sankranti (Cyan) - Solar new year
Gudi Padwa (Magenta) - Hindu New Year (Maharashtra)
Ugadi (Purple) - Hindu New Year (South India)
Navratri (Yellow) - 9-day festival
Features:
✓ 408 exact historical dates (1975-2025)
✓ Color-coded vertical lines for easy identification
✓ Toggle individual festivals on/off
✓ Adjustable line width and labels
✓ Works on all timeframes (best on daily/weekly)
Perfect for traders analyzing gold seasonality, Indian market sentiment, and cultural demand patterns. Use on XAUUSD, GC1!, or Indian gold futures.

Traffic Light MA — Trend IndicatorThis script displays a simple “traffic light” circle that reflects the market trend based on two moving averages (MA).
-Green: Price > Fast MA > Slow MA → Uptrend confirmation
-Yellow: Mixed conditions (transition zone)
-Red: Slow MA > Fast MA > Price → Downtrend confirmation
You can customize:
-MA type (SMA or EMA)
-Lengths of both MAs
-Timeframe used for evaluation (e.g. Daily, 4H, Weekly)
This tool is designed for traders who prefer a minimalistic chart, showing only a clean color signal instead of multiple lines.
Recommendation:
For small MAs (8,15,21) use EMA, for big MAs (50,100,200) use SMA

6am Candle High/Low Indicator with Highlight6am Candle High/Low Indicator with Highlight
6am Candle High/Low Indicator with Highlight
6am Candle High/Low Indicator with Highlight
6am Candle High/Low Indicator with Highlight 6am Candle High/Low Indicator with Highlight

Alerts Killzones + PD/WL/ML Levels (No Labels)This indicator automatically highlights the London and New York killzones and triggers alerts at key price levels — without adding any labels or text clutter to the chart.
Features:
Highlights London (10:00–13:00) and New York (15:00–17:00) sessions (GMT+3, Romania).
Draws and updates key levels automatically:
PDH / PDL – Previous Day High & Low
WH / WL – Previous Week High & Low
MH / ML – Previous Month High & Low
Alerts when price touches any of these levels.
Alerts at session opens and closes for both London and New York.
Clean interface – no labels or extra markers on chart.
Ideal for:
Traders who follow ICT concepts, session-based setups, or liquidity sweeps and want precise alerts without chart noise.

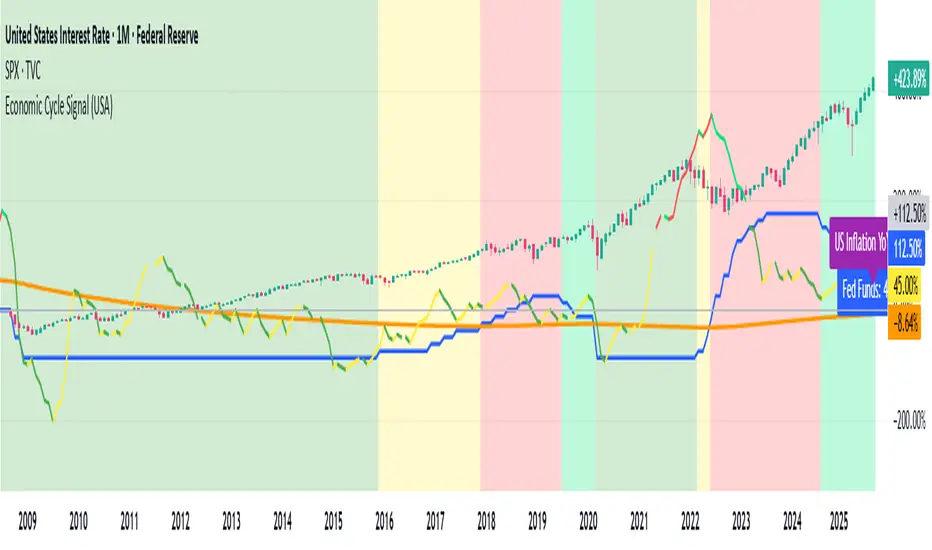
Economic Cycle Signal (USA)📊 Economic Cycle Signal (USA)
This indicator overlays both the U.S. Federal Reserve Funds Rate (Fed Funds) and the U.S. Inflation Rate YoY directly onto your stock market chart (e.g., S&P 500). It visually connects monetary policy and inflation dynamics with equity market performance, helping traders and analysts understand how macroeconomic shifts impact risk assets.
🔹 Key Features
• Plots the monthly U.S. Fed Funds Rate alongside your chart.
• Overlays the U.S. Inflation Rate YoY, offering a direct and realistic view of inflation pressure instead of CPI.
• Shades the background to reflect different economic cycle phases (recovery, recession, expansion, late cycle).
• Highlights how the stock market reacts during shifting monetary and inflationary conditions.
• Provides a clear traffic-light style signal for quick macro interpretation.
• Now includes dynamic inflation color logic based on the Fed’s 2% target and 5% threshold (explained below).
🔹 Inflation Line Color Logic (New)
The inflation line now changes color dynamically to show whether inflation is within or outside the Federal Reserve’s comfort zone, and whether it’s rising or falling:
Inflation Condition Interpretation Line Color
Inflation > 5% and Rising Inflation overheating (well above target) 🔴 Red
Inflation > 5% and Falling Cooling off from high levels 💚 Lime
Inflation < 5% and Falling Disinflation / stable price environment 🟢 Green
Inflation < 5% and Rising Early inflation rebound 🟡 Yellow
This color-coded logic mirrors the interest rate phase colors, giving traders an instant visual cue about inflationary pressure and possible policy turning points.
🔹 How Traders & Analysts Can Use It
• Visualize the interaction between U.S. monetary policy and inflation cycles in real time.
• Identify historically supportive phases when low or easing rates follow moderate inflation.
• Detect tightening cycles when inflation spikes first and the Fed reacts, signaling potential equity headwinds.
• Use as a macro compass to anticipate inflation pressure, policy changes, and market regime shifts.
• Combine with technical analysis, fundamentals, or leading indicators for deeper macro insights.
🔹 Color Legend (Economic Phases)
🟩 Light Green → Recovery (Early Cycle)
• Rates: low or falling
• Inflation: low/stable
🟩 Green → Recession (Down Cycle)
• Rates: cut aggressively
• Inflation: falling
🟨 Yellow → Expansion (Mid Cycle)
• Rates: rising gradually
• Inflation: moderate
🟥 Red → Overheating (Late Cycle)
• Rates: high / rising fast
• Inflation: high
🔹 Inflation Context
• Inflation typically leads the policy rate cycle, offering early insight into future Fed actions.
• The U.S. Inflation Rate YoY provides a direct measure of consumer price changes compared to the same month last year — a clearer gauge of inflation pressure than CPI.
• The new color logic helps visualize whether inflation is accelerating or cooling, relative to the Fed’s 2% target and 5% upper threshold.
• This dual-overlay makes it easy to interpret the cause (inflation) and effect (interest rate policy) in one synchronized chart.
⚠️ Disclaimer
This script is for educational and informational purposes only. It does not provide financial advice or trading signals. Always combine it with your own research, proper risk management, and professional judgment.
Economic Cycle Signal (Pakistan)📊 Economic Cycle Signal (Pakistan)
This indicator overlays both the Pakistan Policy Rate (PKINTR) and the Pakistan Inflation Rate YoY (PKIRYY) directly onto your KSE or Pakistan market chart. It visually connects monetary policy and inflation dynamics with market performance, helping traders and analysts understand how shifts in economic conditions impact risk assets in Pakistan.
🔹 Key Features
• Plots the monthly Pakistan Policy Rate alongside your chart.
• Overlays the Pakistan Inflation Rate YoY to track how price pressures evolve before policy rate adjustments.
• Shades the background to reflect different economic cycle phases (recovery, recession, expansion, late cycle).
• Highlights how equities and other risk assets react during shifting monetary and inflationary conditions.
• Provides a clear traffic-light style signal for quick macro interpretation.
• Now includes dynamic inflation color logic based on the State Bank of Pakistan’s (SBP) 5–7% target range and thresholds for overheating or cooling inflation.
🔹 Inflation Line Color Logic (New)
The inflation line color dynamically reflects whether inflation is within or outside SBP’s target range, and whether it’s rising or falling:
Inflation Condition Interpretation Line Color
Inflation > 7% and Rising Inflation overheating (well above SBP target) 🔴 Red
Inflation > 7% and Falling Cooling off from high levels 💚 Lime
Inflation < 5% and Falling Disinflation / stable price environment 🟢 Green
Inflation < 5% and Rising Early inflation rebound 🟡 Yellow
This adaptive color logic mirrors the interest rate cycle signals, helping traders instantly interpret Pakistan’s inflation trajectory and anticipate potential monetary policy turning points.
🔹 How Traders & Analysts Can Use It
• Visualize Pakistan’s monetary policy cycles and inflation trends in real time.
• Identify supportive phases when rate cuts or low policy rates follow controlled inflation.
• Detect tightening cycles when inflation spikes and the SBP reacts with rate hikes, often creating headwinds for equities.
• Use as a macro compass to anticipate inflation pressure, potential policy actions, and shifts in market risk appetite.
• Combine with technical analysis, fundamentals, or macro indicators for deeper insights into Pakistan’s economic conditions.
🔹 Color Legend (Economic Phases)
🟩 Light Green → Recovery (Early Cycle)
• Rates: low or falling
• Inflation: low/stable
🟩 Green → Recession (Down Cycle)
• Rates: cut aggressively
• Inflation: falling
🟨 Yellow → Expansion (Mid Cycle)
• Rates: rising gradually
• Inflation: moderate
🟥 Red → Overheating (Late Cycle)
• Rates: high / rising fast
• Inflation: high
🔹 Inflation Context
• SBP’s medium-term inflation target range is 5–7%, aimed at balancing growth and price stability.
• The script applies the same visual logic used in the U.S. version, now calibrated to Pakistan’s macro environment.
• The Pakistan Inflation Rate YoY (PKIRYY) line color shifts dynamically — clearly showing when inflation is rising above target, cooling, or stabilizing.
• This dual-overlay helps interpret both the cause (inflation) and effect (policy response) within Pakistan’s economic cycle, giving investors a clear macro perspective.
⚠️ Disclaimer
This script is for educational and informational purposes only. It does not provide financial advice or trading signals. Always combine it with your own research, proper risk management, and professional judgment.

RSI Colored by Relative StrengthThis indicator enhances the traditional RSI by combining it with Relative Strength (RS) — the ratio of an asset’s price to a chosen benchmark (e.g., SPY, QQQ, BTCUSD) — to create a more accurate, powerful, and dynamic momentum confirmation tool.
Instead of relying solely on RSI’s internal momentum, this version color-codes RSI values and backgrounds based on whether the asset is outperforming, underperforming, or neutral relative to the benchmark, not only identifying the RSI value, but color codes it in relation to the overall market to give more accurate confirmations.
• RS > 1 → The asset is outperforming the benchmark (relative strength).
• RS < 1 → The asset is underperforming.
• RS ≈ 1 → Neutral or moving in sync with the benchmark.
Gradient background zones:
• Green tones = outperformance (RS > 1).
• Red tones = underperformance (RS < 1).
• Gray neutral band = parity (RS ≈ 1).
Intensity adjusts dynamically based on how far RS deviates from 1, giving an at-a-glance view of market leadership strength.
• Color-coded RSI line: Green when RS > 1, red when RS < 1.
• Optional markers and labels show confirmed RS+RSI crossovers with smart spacing to prevent clutter.
• Alerts included for bullish and bearish RS+RSI alignment events.
How to Use
1. Add your preferred benchmark symbol (default: SPY).
2. Move this indicator into the same pane as your RSI (No need to overlay, does so automatically) and can also be used standalone.
3. Watch for:
• Green RSI & background: Significant momentum strength (asset trending upward and outpacing the market).
• Red RSI & background: False or insignificant momentum (asset lagging).
• Gray zone: neutral phase — consolidation or rotation period.
Use this as a trend-confirmation filter rather than a signal generator.
For example:
• Confirm and refine breakout entries when RS > 1 (RSI support = stronger conviction).
• Take profits when RSI weakens and RS slips below 1.

Puell Multiple Variants [OperationHeadLessChicken]Overview
This script contains three different, but related indicators to visualise Bitcoin miner revenue.
The classical Puell Multiple : historically, it has been good at signaling Bitcoin cycle tops and bottoms, but due to the diminishing rewards miners get after each halving, it is not clear how you determine overvalued and undervalued territories on it. Here is how the other two modified versions come into play:
Halving-Corrected Puell Multiple : The idea is to multiply the miner revenue after each halving with a correction factor, so overvalued levels are made comparable by a horizontal line across cycles. After experimentation, this correction factor turned out to be around 1.63. This brings cycle tops close to each other, but we lose the ability to see undervalued territories as a horizontal region. The third variant aims to fix this:
Miner Revenue Relative Strength Index (Miner Revenue RSI) : It uses RSI to map miner revenue into the 0-100 range, making it easy to visualise over/undervalued territories. With correct parameter settings, it eliminates the diminishing nature of the original Puell Multiple, and shows both over- and undervalued revenues correctly.
Example usage
The goal is to determine cycle tops and bottoms. I recommend using it on high timeframes, like monthly or weekly . Lower than that, you will see a lot of noise, but it could still be used. Here I use monthly as the example.
The classical Puell Multiple is included for reference. It is calculated as Miner Revenue divided by the 365-day Moving Average of the Miner Revenue . As you can see in the picture below, it has been good at signaling tops at 1,3,5,7.
The problems:
- I have to switch the Puell Multiple to a logarithmic scale
- Still, I cannot use a horizontal oversold territory
- 5 didn't touch the trendline, despite being a cycle top
- 9 touched the trendline despite not being a cycle top
Halving-Corrected Puell Multiple (yellow): Multiplies the Puell Multiple by 1.63 (a number determined via experimentation) after each halving. In the picture below, you can see how the Classical (white) and Corrected (yellow) Puell Multiples compare:
Advantages:
- Now you can set a constant overvalued level (12.49 in my case)
- 1,3,7 are signaled correctly as cycle tops
- 9 is correctly not signaled as a cycle top
Caveats:
- Now you don't have bottom signals anymore
- 5 is still not signaled as cycle top
Let's see if we can further improve this:
Miner Revenue RSI (blue):
On the monthly, you can see that an RSI period of 6, an overvalued threshold of 90, and an undervalued threshold of 35 have given historically pretty good signals.
Advantages:
- Uses two simple and clear horizontal levels for undervalued and overvalued levels
- Signaling 1,3,5,7 correctly as cycle tops
- Correctly does not signal 9 as a cycle top
- Signaling 4,6,8 correctly as cycle bottoms
Caveats:
- Misses two as a cycle bottom, although it was a long time ago when the Bitcoin market was much less mature
- In the past, gave some early overvalued signals
Usage
Using the example above, you can apply these indicators to any timeframe you like and tweak their parameters to obtain signals for overvalued/undervalued BTC prices
You can show or hide any of the three indicators individually
Set overvalued/undervalued thresholds for each => the background will highlight in green (undervalued) or red (overvalued)
Set special parameters for the given indicators: correction factor for the Corrected Puell and RSI period for Revenue RSI
Show or hide halving events on the indicator panel
All parameters and colours are adjustable

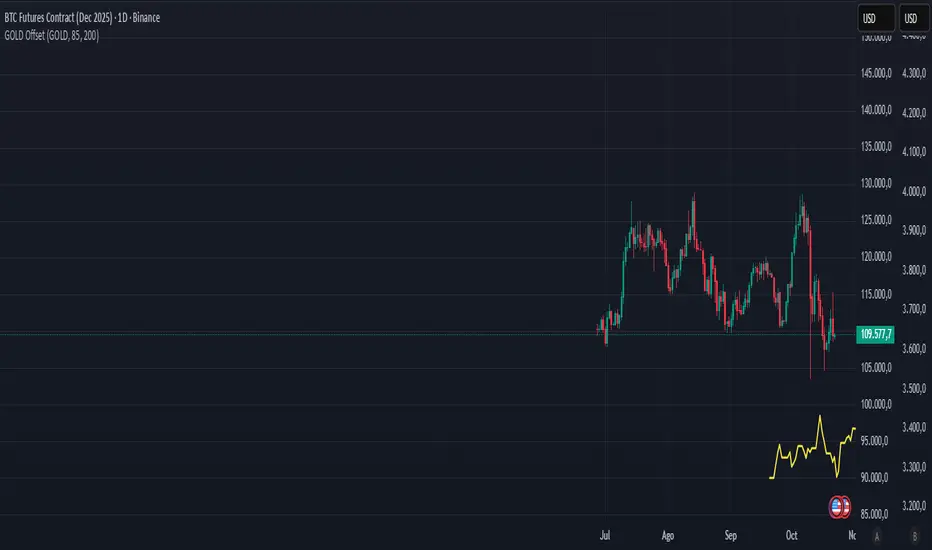
Gold–Bitcoin Correlation (Offset Model) by KManus88This indicator analyzes the correlation between Gold (XAU/USD) and Bitcoin (BTC/USD) using a time-offset model adjustable by the user.
The goal is to detect cyclical leads or lags between both assets, highlighting how capital flows into Gold may precede or follow movements in the crypto market.
Key Features:
Dynamic correlation calculation between Gold and Bitcoin.
Adjustable offset in days (default: 107) to fine-tune the temporal shift.
Automatic labels and on-chart visualization.
Compatible with multiple timeframes and logarithmic scales.
Interpretation:
Positive correlation suggests synchronized trends between both assets.
Negative correlation signals divergence or rotation of liquidity.
The time-offset parameter helps estimate when a shift in Gold could later reflect in Bitcoin.
Recommended use:
For macro-financial and global liquidity cycle analysis.
As a complementary tool in cross-asset momentum strategies.
© 2025 – Developed by KManus88 | Inspired by monetary correlation studies and global liquidity cycles.
This script is for educational purposes only and does not constitute financial advice.