AlexD Market annual seasonalityThe indicator displays the percentage of bullish days with a given date over several years.
This allows you to determine the days of the year when the price usually goes up or down.
Indicator has a built-in "simple moving average" shifted back by half a period, due to which the delay of this smoothing is removed.
Cycle

timing marketIntraday time cycle . it is valid for nifty and banknifty .just add this on daily basis . ignore previous day data

Cycle-Period Adaptive, Linear Regression Slope Oscillator [Loxx]Cycle-Period Adaptive, Linear Regression Slope Oscillator is an osciallator that solves for the Linear Regression slope and turns it into an oscillator. This is a very simple calculation and uses one of Ehler's first implementations of his cycle period calculations. The output slope value is smoothed after calculation and before being drawn. This is a sort of momentum indicator and has a rich history with Forex traders around the world.
What is the Cycle Period?
The spectral content of the data are measured in a bank of contiguous filters as described in "Measuring Cycle Periods" in the March 2008 issue of Stocks & Commodities Magazine. The filter having the strongest output is selected as the current dominant cycle period. The cycle period is measured as the number of bars contained in one full cycle period.
What is Linear Regression?
In statistics, linear regression is a linear approach for modeling the relationship between a scalar response and one or more explanatory variables. The case of one explanatory variable is called simple linear regression; for more than one, the process is called multiple linear regression.
Included:
Bar coloring
2 signal types
Alerts
Loxx's Expanded Source Types
Loxx's Moving Averages

Pi Cycle Indicators Comparison IndicatorThere are now 3 Pi Cycle Indicators that I am aware of; the original, improved**, and bottom.
This indicator attempts to provide all three indicators in a dingle, easy to view script.
I coded this script to displace the moving averages above and below the price bars for easy viewing. This was accomplished by placing a scaling factor (/# or *#) at the end of the ta.sma or ta.ema functions.
A vertical arrow, purposely posing as a short vertical line, marks the crossing of the long and short MAs for each indicator. These are color coded to match their respective indicators and the long and short MAs are similarly color coded for easy differentiation.
The red colored MAs and arrows above the price line are the Improved Pi-Cycle Top Indicator.
The green colored MAs and arrows below the price line are the Original Pi-Cycle Top Indicator.
The blue colored MAs and arrows below the green lines and price line are the Pi-Cycle Bottom Indicator.
One last feature of the chart is the use of the location function to enable easy comparison of the crossings of each indicator to the indicator itself and to the price. This can be accomplished simply by moving the chart up and down.
**{I should note that while researching this I found that BitcoinMamo turns out to have beat me to the punch on the Improved Indicator Long.Short and Multiplier numbers. He should therefor get the credit for that}

Bitcoin Golden Pi CyclesTops are signaled by the fast top MA crossing above the slow top MA, and bottoms are signaled by the slow bottom MA crossing above the fast bottom MA. Alerts can be set on top and bottom prints. Does not repaint.
Similar to the work of Philip Swift regarding the Bitcoin Pi Cycle Top, I’ve recently come across a similar mathematically curious ratio that corresponds to Bitcoin cycle bottoms. This ratio was extracted from skirmantas’ Bitcoin Super Cycle indicator . Cycle bottoms are signaled when the 700D SMA crosses above the 137D SMA (because this indicator is closed source, these moving averages were reverse-engineered). Such crossings have historically coincided with the January 2015 and December 2018 bottoms. Also, although yet to be confirmed as a bottom, a cross occurred June 19, 2022 (two days prior to this article)
The original pi cycle uses the doubled 350D SMA and the 111D SMA . As pointed out this gives the original pi cycle top ratio:
350/111 = 3.1532 ≈ π
Also, as noted by Swift, 111 is the best integer for dividing 350 to approximate π. What is mathematically interesting about skirmanta’s ratio?
700/138 = 5.1095
After playing around with this for a while I realized that 5.11 is very close to the product of the two most numerologically significant geometrical constants, π and the golden ratio, ϕ:
πϕ = 5.0832
However, 138 turns out to be the best integer denominator to approximate πϕ:
700/138 = 5.0725 ≈ πϕ
This is what I’ve dubbed the Bitcoin Golden Pi Bottom Ratio.
In the spirit of numerology I must mention that 137 does have some things going for it: it’s a prime number and is very famously almost exactly the reciprocal of the fine structure constant (α is within 0.03% of 1/137).
Now why 350 and 700 and not say 360 and 720? After all, 360 is obviously much more numerologically significant than 350, which is proven by the fact that 360 has its own wikipedia page, and 350 does not! Using 360/115 and 720/142, which are also approximations of π and πϕ respectively, this also calls cycle tops and bottoms.
There are infinitely many such ratios that could work to approximate π and πϕ (although there are a finite number whose daily moving averages are defined). Further analysis is needed to find the range(s) of numerators (the numerator determines the denominator when maintaining the ratio) that correctly produce bottom and top signals.

Hybrid, Zero lag, Adaptive cycle MACD [Loxx]TASC's March 2008 edition Traders' Tips includes an article by John Ehlers titled "Measuring Cycle Periods," and describes the use of bandpass filters to estimate the length, in bars, of the currently dominant price cycle.
What are Dominant Cycles and Why should we use them?
Even the most casual chart reader will be able to spot times when the market is cycling and other times when longer-term trends are in play. Cycling markets are ideal for swing trading however attempting to “trade the swing” in a trending market can be a recipe for disaster. Similarly, applying trend trading techniques during a cycling market can equally wreak havoc in your account. Cycle or trend modes can readily be identified in hindsight. But it would be useful to have an objective scientific approach to guide you as to the current market mode.
There are a number of tools already available to differentiate between cycle and trend modes. For example, measuring the trend slope over the cycle period to the amplitude of the cyclic swing is one possibility.
We begin by thinking of cycle mode in terms of frequency or its inverse, periodicity. Since the markets are fractal; daily, weekly, and intraday charts are pretty much indistinguishable when time scales are removed. Thus it is useful to think of the cycle period in terms of its bar count. For example, a 20 bar cycle using daily data corresponds to a cycle period of approximately one month.
When viewed as a waveform, slow-varying price trends constitute the waveform's low frequency components and day-to-day fluctuations (noise) constitute the high frequency components. The objective in cycle mode is to filter out the unwanted components--both low frequency trends and the high frequency noise--and retain only the range of frequencies over the desired swing period. A filter for doing this is called a bandpass filter and the range of frequencies passed is the filter's bandwidth .
Indicator Features
-Zero lag or Regular MACD/signal calculation
- Fixed or Band-pass Dominant Cycle for MACD and Signal MA period inputs
-10 different moving average options for both MACD and Signal MA calculations
-Separate Band-pass Dominant Cycle calculations for both MACD and Signal MA calculations
- Slow-to-Fast Band-pass Dominant Cycle input to tweak the ratio of MACD MA input periods as they relate to each other

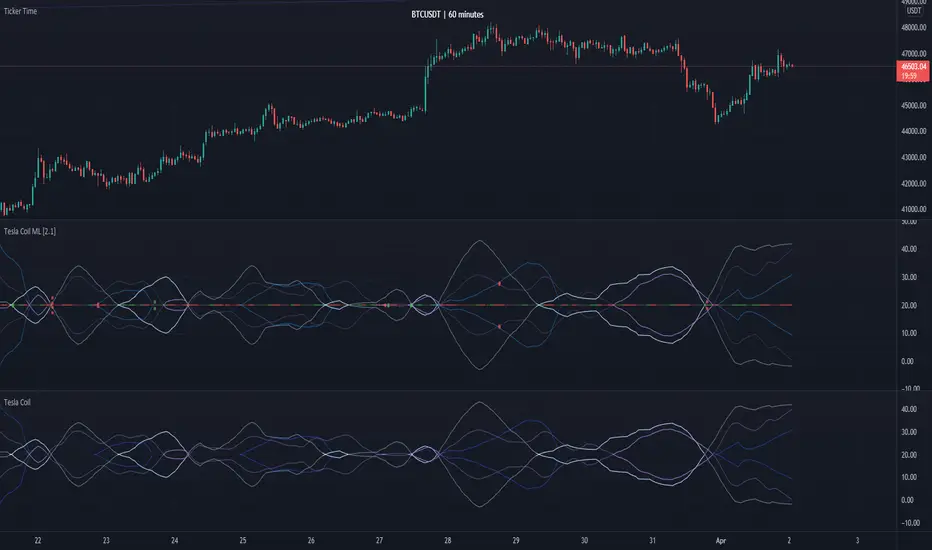
Tesla Coil MLThis is a re-implementation of @veryfid's wonderful Tesla Coil indicator to leverage basic Machine Learning Algorithms to help classify coil crossovers. The original Tesla Coil indicator requires extensive training and practice for the user to develop adequate intuition to interpret coil crossovers. The goal for this version is to help the user understand the underlying logic of the Tesla Coil indicator and provide a more intuitive way to interpret the indicator. The signals should be interpreted as suggestions rather than as a hard-coded set of rules.
NOTE: Please do NOT trade off the signals blindly. Always try to use your own intuition for understanding the coils and check for confluence with other indicators before initiating a trade.
Bitcoin Bull Runs Mid Cycle Aligned This script plots 2 lines which are the 2013 and 2016 bull run. The plots are aligned on their mid cycles to the 2021 mid cycle.
Settings:
You can move the plots on the x and y axis in the settings for the Daily, Weekly and Monthly TFs.
The plot is weird on the Monthly TF, best to use the Daily and Weekly.
If it doesn't load at first you have to zoom out fully and go back to 2013 for it to load. Then it will load.

Ehlers Cycle Period [CC]The Cycle Period was created by John Ehlers and this is yet another version that shows how to calculate the current cycle period which is the approximate amount of days between a current peak or valley and the next peak or valley. I would not recommend this for trading since it is more for informational use only but I would try experimenting with this output to be used with another indicator as an input length. I have included strong buy and sell signals in addition to normal ones so strong signals are darker in color and normal signals are lighter in color.
Let me know if there are any other scripts you would like to see me publish!

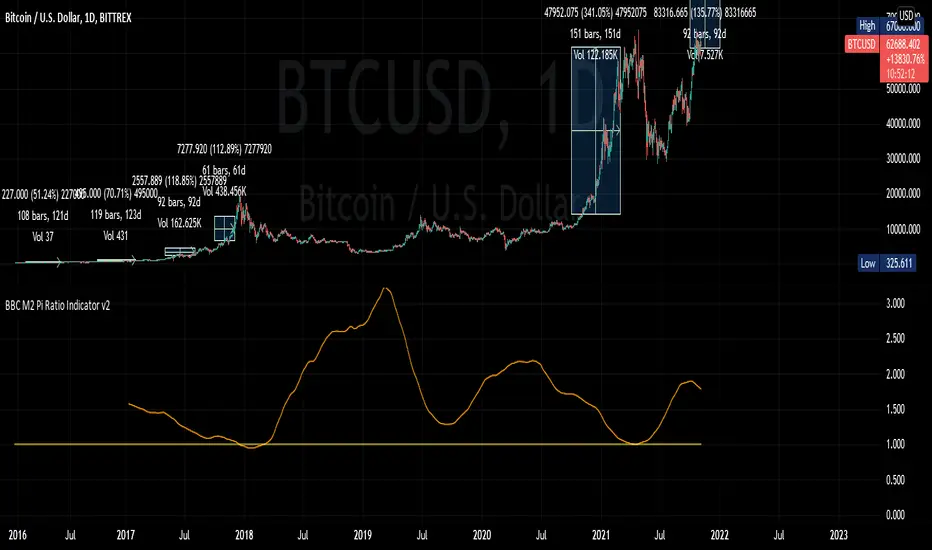
BBC M2 Pi Ratio Indicator v2Pi Cycle indicator expressed as a ratio such that when the indicator triggers (350DMA *2 = 111DMA) the ratio will be 1. This allows you to place an alert on the ratio line for crossing certain thresholds such as 1.1.
Ehlers Mesa Spectrum Dominant Cycle [CC]The Mesa Spectrum Dominant Cycle was created by John Ehlers and this is the foundation for many indicators he created that would later follow. This is his updated version of his original Mesa algorithm and I do not recommend this indicator as a stand alone for trading. This is more of an informational indicator that will tell you the current dominant cycle period which is the approximate period between peaks and valleys in the underlying data. I have color coded buy signals just in case with both strong and normal signals. Darker colors are strong and lighter colors are normal. Buy when the line is green and sell when it is red.
Let me know if there are any other indicators you would like to see me publish!

Ehlers Cycle Amplitude [CC]The Cycle Amplitude was created by John Ehlers (Trend Modes and Cycle Modes) and this indicator wasn't meant to give buy and sell signals by itself but I'm publishing this open source script in case someone comes up with a cool way to use this indicator for buy and sell signals. This indicator essentially tells you the distance between the peaks from the Cycle BandPass Filter and I will be including the last script tomorrow most likely. I'm reusing the same exact buy and sell signals from the cycle bandpass filter so if you have any questions then feel free to refer to the link I posted.
Let me know if there are any other scripts you would like to see me publish!

Ehlers Cycle BandPass Filter [CC]The Cycle BandPass Filter was created by John Ehlers (Cycle Modes and Trend Modes) and this is an alternate to the default BandPass Filter by changing some settings. This will be another series I will be introducing showing some indicators created by Ehlers and that didn't get much attention. This identifies the underlying cycle in the price data and these indicators aren't very common so I want to introduce more of these to tv. Buying and selling with these indicators can be a bit tricky but overall what Ehlers recommends is to buy at the lowest point and sell at the highest point to capture the underlying cycle. I have included strong buy and sell signals as darker colors and normal signals as lighter colors. Buy when the line turns green and sell when it turns red.
Let me know if there are any other scripts you would like to see me publish!

Ehlers Instantaneous Phase Dominant Cycle [CC]The Instantaneous Phase Dominant Cycle was created by John Ehlers (Stocks & Commodities V. 18:3 (16-27)) and this is one of many similar indicators that I will be publishing from Ehlers in the next few months that calculate the current dominant cycle period. The cycle period can be used in multiple ways but generally this means that if the stock is currently at a low then the current cycle period will tell you when the next lowest low will get hit or vice versa. This is also useful for using this cycle period as an input for other indicators to provide a very good adaptive length. Let me know how you wind up using these indicators in your daily trading. I have included the same buy and sell signals from my recent Hilbert Transform and so buy when the line turns green and sell when it turns red.
Let me know if there are any other indicators you would like to see me publish!

Ehlers Adaptive Cyber Cycle [CC]The Adaptive Cyber Cycle was created by John Ehlers and this is a cycle based indicator which you don't find too many of these days. Each stock goes through cycles which are repeating patterns of price movement and cycle indicators help you find the timing of the cycle to capitalize on the underlying cycle. That is an extremely simple explanation but most importantly don't interpret these indicators as the same as other indicators because it may seem like there are very many false signals but that is because of the different cycles the stock is undergoing. Buy when the line turns green and sell when it turns red.
Let me know if there are any other indicators you would like to see me publish.

Ehlers Adaptive Center Of Gravity [CC]The Adaptive Center Of Gravity was created by John Ehlers and this is a regular center of gravity indicator combined to be use with the current cycle period. If you are not familiar with stock cycles then I would highly recommend his book on the subject: Cycle Analytics. Buy when the indicator turns green and sell when it turns red.
Let me know if there are any other indicators you want me to publish!

Sharktank - Pi Cycle PredictionThe Pi Cycle indicator has called tops in Bitcoin quite accurately. Assuming history repeats itself, knowledge about when it might happen again could benefit you.
The indicator is fairly simple:
- A daily moving average of 350 ("long_ma" in script)
- A daily moving average of 111 ("short_ma" in script)
The value of the long moving average is multiplied by two. This way the longer moving average appears above the shorter one.
When the shorter one (orange colored) crosses above the longer (green colored) one, it could mean the top is in.
These moving averages rise at a certain rate. Using these rates we could try to estimate a possible crossover moment. That's exactly what this indicator does! It gives the user a prediction of when a crossover might happen.
Special thanks to:
- Ninorigo, for making his indicator public. This one uses his as a starting point.
- The_Caretaker, for coming up with this idea about calling a top. Yet, his is more price-based, this one is more time-based.

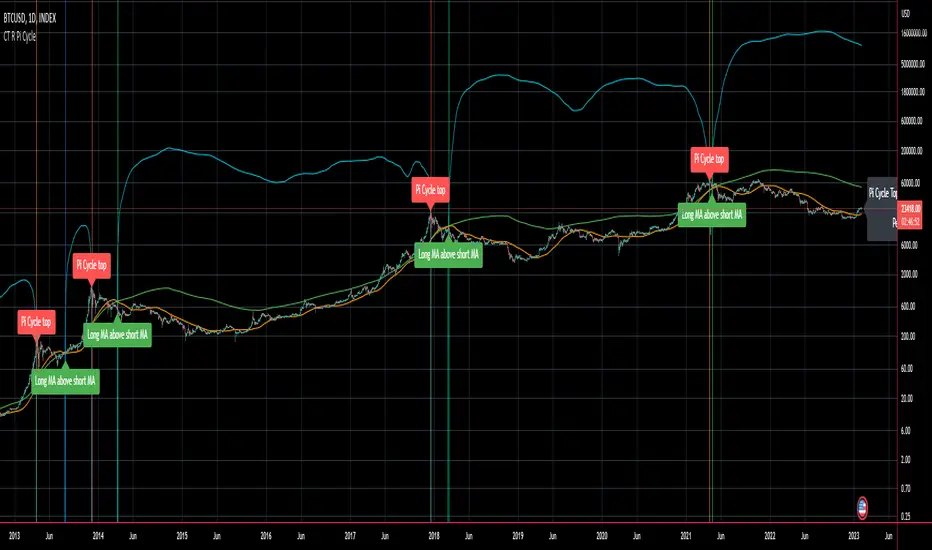
CT Reverse Pi Cycle Bitcoin Top IndicatorIntroducing the Reverse BTC Pi Market Cycle Top indicator
Much respect to Philip Swift the original creator of this idea and big thanks to Tradingview author Ninorigo for sharing the script which this indicator is based on.
Philip Swift has noted that:
Using the x2 multiple of the 350 day moving average along with the 111 day moving average provides an interesting market cycle indicator.
Over the past three market cycles, when the 350DMA x2 crosses below the 111DMA, Bitcoin price peaks in its market cycle, this has been accurate to within three days of Bitcoin price topping out.
Here I have modified an existing script by Tradingview author @Ninorigo which shows the moving averages and gives signals upon crossover by adding the following features:
A function which shows the price at which the 350DMA will Cross Below the 111DMA.
(This is calculated from the prior bar closing data and does not repaint)
An “anticipated cross” function which may give a 1 bar advanced warning of a cross.
(this is calculated from current bar values and may change and repaint)
The crossover levels are shown in an info label to the right of the current price.
When there is a BTC Pi Market Cycle Top anticipated cross on the next bar there will be an orange background signal.
When there is an actual BTC Pi Market Cycle Top cross there will be a red background signal
When there is an anticipated cross back there will be a blue background signal
When there is an actual cross back there will be a green background signal
This indicator will show the appropriate moving averages and crossover information from the daily timeframe regardless of the timeframe you are using.
This should be helpful in more accurately identifying the price level where the Pi Market Cycle moving averages will cross denoting a possible market cycle top.
It is interesting to note:
350 / 111 = 3.153
Which is the closest we can get to Pi when dividing 350 by another whole number.
This is a script to give another view and metric on an interesting experimental idea. This is not financial advice.
Medium Term Weighted Stochastic (STPMT) by DGTLa Stochastique Pondérée Moyen Terme (STPMT) , or Mᴇᴅɪᴜᴍ Tᴇʀᴍ Wᴇɪɢʜᴛᴇᴅ Sᴛᴏᴄʜᴀꜱᴛɪᴄꜱ created by Eric Lefort in 1999, a French trader and author of trading books
█ The STPMT indicator is a tool which concerns itself with both the direction and the timing of the market. The STPMT indicator helps the trader with:
The general trend by observing the level around which the indicator oscillates
The changes of direction in the market
The timing to open or close a position by observing the oscillations and by observing the relative position of the STPMT versus its moving average
STPMT Calculation
stpmt = (4,1 * stoch(5, 3) + 2,5 * stoch(14, 3) + stoch(45, 14) + 4 * stoch(75, 20)) / 11.6
Where the first argument of the stoch function representation above is period (length) of K and second argument smoothing period of K. The result series is then plotted as red line and its moving average as blue line. By default disabled gray lines are the components of the STPMT
The oscillations of the STPMT around its moving average define the timing to open a position as crossing of STMP line and moving average line in case when both trends have same direction. The moving average determines the direction.
Long examples
█ Tʜᴇ CYCLE Iɴᴅɪᴄᴀᴛᴏʀ is derived from the STPMT. It is
cycle = stpmt – stpmt moving average
It is indicates more clearly all buy and sell opportunities. On the other hand it does not give any information on market direction. The Cycle indicator is a great help in timing as it allows the trader to more easily see the median length of an oscillation around the average point. In this way the traders can simply use the time axis to identify both a favorable price and a favorable moment. The Cycle Indicator is presented as histogram
The Lefort indicators are not a trading strategy. They are tools for different purposes which can be combined and which can serve for trading all instruments (stocks, market indices, forex, commodities…) in a variety of time frames. Hence they can be used for both day trading and swing trading.
👉 For whom that would like simple version of the Cycle indicator on top of the main price chart with signals as presented below.
Please note that in the following code STMP moving average direction is not considered and will plot signals regardless of the direction of STMP moving average. It is not a non-repainting version too.
here is pine code for the overlay version
// © dgtrd
//@version=4
study("Medium Term Weighted Stochastic (STPMT) by DGT", "STPMT ʙʏ DGT ☼☾", true, format.price, 2, resolution="")
i_maLen = input(9 , "Stoch MA Length", minval=1)
i_periodK1 = input(5 , "K1" , minval=1)
i_smoothK1 = input(3 , "Smooth K1", minval=1)
i_weightK1 = input(4.1 , "Weight K1", minval=1, step=.1)
i_periodK2 = input(14 , "K2" , minval=1)
i_smoothK2 = input(3 , "Smooth K2", minval=1)
i_weightK2 = input(2.5 , "Weight K2", minval=1, step=.1)
i_periodK3 = input(45 , "K3" , minval=1)
i_smoothK3 = input(14 , "Smooth K3", minval=1)
i_weightK3 = input(1. , "Weight K3", minval=1, step=.1)
i_periodK4 = input(75 , "K4" , minval=1)
i_smoothK4 = input(20 , "Smooth K4", minval=1)
i_weightK4 = input(4. , "Weight K4", minval=1, step=.1)
i_data = input(false, "Components of the STPMT")
//------------------------------------------------------------------------------
// stochastic function
f_stoch(_periodK, _smoothK) => sma(stoch(close, high, low, _periodK), _smoothK)
//------------------------------------------------------------------------------
// calculations
// La Stochastique Pondérée Moyen Terme (STPMT) or Medium Term Weighted Stochastics calculation
stpmt = (i_weightK1 * f_stoch(i_periodK1, i_smoothK1) + i_weightK2 * f_stoch(i_periodK2, i_smoothK2) + i_weightK3 * f_stoch(i_periodK3, i_smoothK3) + i_weightK4 * f_stoch(i_periodK4, i_smoothK4)) / (i_weightK1 + i_weightK2 + i_weightK3 + i_weightK4)
stpmt_ma = sma(stpmt, i_maLen) // STPMT Moving Average
cycle = stpmt - stpmt_ma // Cycle Indicator
//------------------------------------------------------------------------------
// plotting
plotarrow(change(sign(cycle)), "STPMT Signals", color.green, color.red, 0, maxheight=41)
alertcondition(cross(cycle, 0), title="Trading Opportunity", message="STPMT Cycle : Probable Trade Opportunity {{exchange}}:{{ticker}}-> Price = {{close}}, Time = {{time}}")

Ark Crypto HeatlineThis is the 'on chart' indicator. See also "Ark Crypto Heatband" indicator for a side-by-side BTC view, without a re-scaled line.
The crypto landscape is largely dominated by BTC and characterised by cyclical stages with varying degrees of mean reversion.
To understand what stage of the cycle we are currently experiencing, it is useful to examine to what degree the current price has extended beyond the long term average that BTC has established. This is true even when analysing other crypto assets as BTC is the dominant force in the crypto asset class.
This indicator uses the 1400 period daily SMA , which is broadly the 200 period weekly SMA. This can be configured, but historically has represented a baseline to which BTC commonly returns.
The graph plots current price in terms of multiples of this long term average. Traditionally, at multiples beyond 10, BTC is considered overextended with a higher likelihood of trending towards the mean thereafter. Colors indicate the extent of price extension.
Where the indicator is applied to non BTCUSD pairs, a smoothed conversion is applied, seeking to superimpose the BTC long period SMA onto the current chart.
The indicator specifically references BTC by default on all charts, as it is designed to use BTC as general purpose indication of where crypto as a whole currently sits. Accordingly the indicator is only to be used on crypto charts.
For best results on BTC, using BNC:BLX will give the longest historical view.

Ark Crypto HeatbandThe crypto landscape is largely dominated by BTC and characterised by cyclical stages with varying degrees of mean reversion.
To understand what stage of the cycle we are currently experiencing, it is useful to examine to what degree the current BTC price has extended beyond a long term average. This is true even when analysing other crypto assets and helpful to view side by side.
This indicator uses the 1400 period daily SMA, which is broadly the 200 period weekly SMA. This can be configured, but historically has represented a baseline to which BTC commonly returns.
The graph plots current price in terms of multiples of this long term average. Traditionally, at multiples beyond 10, BTC is considered overextended with a higher likelihood of trending towards the mean thereafter. Colors indicate the extend of price extension.
The indicator specifically references BTC by default on all charts as it is designed to use BTC as general purpose indication of where crypto as a whole currently sits. Accordingly the indicator is only to be used on crypto charts.

Cycle Swing MomentumAdaptive Ultra-Smooth Momentum indicator
The Cycle-Swing-Indicator "CSI" provides an optimized "momentum" oscillator based on the current dominant cycle by looking at the swing of the dominant cycle instead of the raw source momentum. Offering the following improvements:
Smoothness
Zero delay
Sharpness at turning points
Robust and adaptable to market conditions
Accurate deviation detection
The following common problems with standard indicators are solved by this indicator:
First, normal indicators introduce a lot of false signals due to their noisy signal line. Second, to compensate for the noise, one would normally try to add some smoothing. But this only results in adding more delay to the indicator, which makes it almost useless. Third, standard indicators require a length adjustment to derive reliable signals. However, you never know how to set the right length.
All three problems described above are solved by the developed adaptive cyclic algorithm.
The above chart shows current Bitcoin 4h data from the last days as of writing with the proposed signal reading for this indicator. The standard momentum indicator is included for comparison.
HOW TO USE
The indicator works without any parameter and can be applied to any chart and any time-frame. It will adapt automatically to the Dominant Cycle and use the dominant cycle of the source data to derive the ultra smooth momentum curve. Adaptive upper/lower bands are included and highlight areas with extreme readings. Automatic divergence detection can be turned off/on.
HOW TO READ
The indicator can be used like any oscillator. In addition, it provides adaptive high and low bands.
* Look for turns above the upper/lower bands
* Look for divergences between source and signals line
Further reading/Original source:
The indicator uses the dominant cycle to optimize signal, smoothing and cyclic memory. To get more in-depth information on the Cycle Swing Indicator, please read Chapter 10 "Cycle Swing Indicator: Trading the swing of the dominant cycle" of the book "Decoding the Hidden Market Rhythm, Part 1" available at your favorite book store.
Related ideas:
Please also check the cyclic RSI indicator which also uses cyclic information to improve the signal.
