Investing - Correlation Table This correlation tables idea is nothing new, many sites provides it.
However, I couldn't find any simple correlation indicator on TradingView despite how simple this indicator is.
This indicator works as its called. Calculating the correlation between 2 projects (can be used in stocks as well) using the 'ta.correlation' feature built into pinescript.
When it comes to investing, we do not want our stocks / crypto project to be heavily correlated to each other.
If they are heavily correlated to each other, then there isn't much point in diversifying.
That being said, it can be useful for traders who trade multiple pairs.
-----------------------------------------------------------------------------------------------------------------------------------------------------------
In this indicator, consist of 5 primary input and 15 secondary input (Symbol List).
Correlation Source:
This input options allow you to change how the correlation is calculated. By default, it uses 'close'.
Correlation Percentage(%):
This input options allows you configure how many (%) of correlation is considered as 'decoupled'.
This correlation will only move between -100% ~ 100%.
100% refers to it moving together.
-100% refers to it moving the opposite direction.
For example, Project A rises in Price, what is the possibility of Project B following:
A 100% correlation between Project A and Project B, refers to Project B will follow Project A movement.
A 50% correlation between Project A and Project B, refers to there is only 50% chance for Project B to follow Project A movement.
A -20% correlation between Project A and Project B, refers to there is a 20% chance of Project B moving the opposite direction of Project A
(Refers to the table on chart above to better understand what the numbers means. DOT/USD has a 100% correlation to DOT/USD. However. MXCUSDT has a -37.2% correlation to DOT/USD.)
Amounts Bars To Check:
This input options will check the amount of bars since the last bar in the chart.
If you want to know the correlation of the past 100 days in a daily chart, you will enter '100' into this options and it will check only the past 100 days.
Symbol List
This will allow you to input all the project symbol ticker ID to add into the correlation table.
-----------------------------------------------------------------------------------------------------------------------------------------------------------
Originally, I wish to use for loop to go through the symbol list to reduce the amount of code required. However, due to limitation of 'request.security' feature, I had to abandon that idea and use hard-coded for requesting security and use a while loop to identify the symbol correlation value in the array set then set the table value accordingly.
If there is any script writer could improve this or any unclear explanation, feel free to drop a comment below.
Correlation

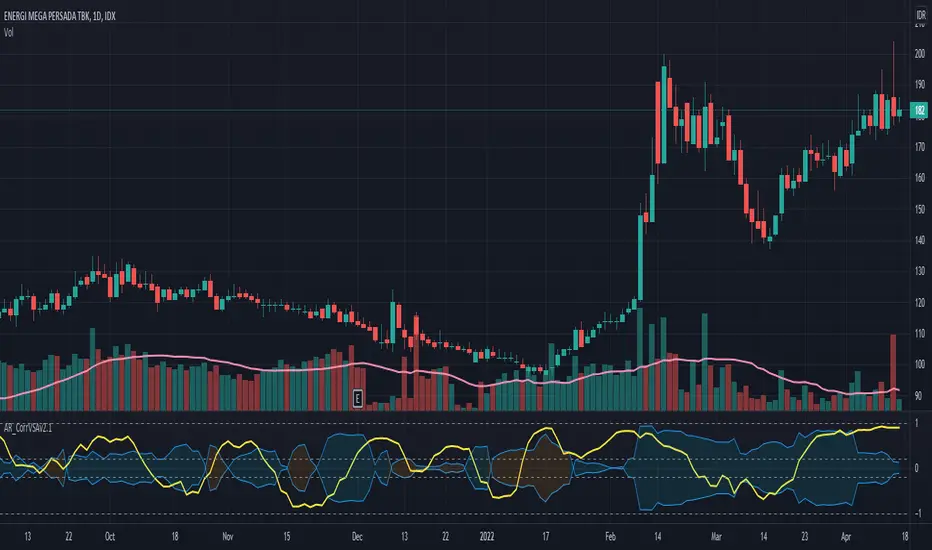
Statistical Correlation Algorithm - The Quant ScienceStatistical Correlation Algorithm - The Quant Science™ is a quantitative trading algorithm.
ALGORITHM DESCRIPTION
This algorithm analyses the correlation ratios between two assets. The main asset (on the chart), and the secondary asset (set by the user). Then apply the long or short trading strategy.
The algorithm divides trading work into three parts:
1. Correlation analysis
2. Long or short entry
3. Closing trades
Inside the strategy: the algorithm analyses the percentage change yields from a previous session, of the secondary asset. If the variation meets the set condition then it will open a long or short position, on the primary asset. The open position is closed after 'x' number of sessions. Stop loss and take profit can be added to the trade exit parameters.
Logic: analyses the correlation between two assets and looks for a statistical advantage within the correlation.
INDICATOR DESCRIPTION
The algorithm includes a quantitative indicator. This indicator is used for correlation analysis and offers a quick reading of the quantitative data. The blue area shows the correlation ratio values. The yellow histograms show the percentage change in the yields of the main asset. Purple histograms show the percentage change in secondary asset yields.
GENERAL FEATURES
Multi time-frame: the user can set any time-frame for the secondary asset.
Multi asset: the user analyses the conditions on a second asset.
Multi-strategy: the algorithm can apply either the long strategy or the short strategy.
Built-in alerts: the algorithm contains alerts that can be customized from the user interface.
Integrated indicator: the quantity indicator is included.
Backtesting included: automatic backtesting of the strategy is generated based on the values set.
Auto-trading compliant: functions for auto trading are included.
USER INTERFACE SETTINGS
Through the intuitive user interface, you can manage all the parameters of this algorithm without any programming experience. The user interface is extremely descriptive and contains all the information needed to understand the logic of the algorithm and to configure it correctly.
1. Date range: through this function you can adjust the analysis and working period of the algorithm.
2. Asset: through this function you can adjust the secondary asset and its time-frame. You can enter any type of asset, even indices and economic indicators.
3. Asset details: this function is used to adjust the percentage change to be analyzed on the secondary asset. The analysis and input conditions are also chosen.
4. Active long or short strategy: this function is used to set the type of strategy to be used, long or short.
5. Setting algo trading alert: with this function, users can manage alerts for their web-hook.
6. Exit&Money management: with this function the user can adjust the exit periods of each trade and activate or deactivate any stop losses and take profits.
7. Data Value Analysis: this function is used to adjust the parameters for the quantity indicator.

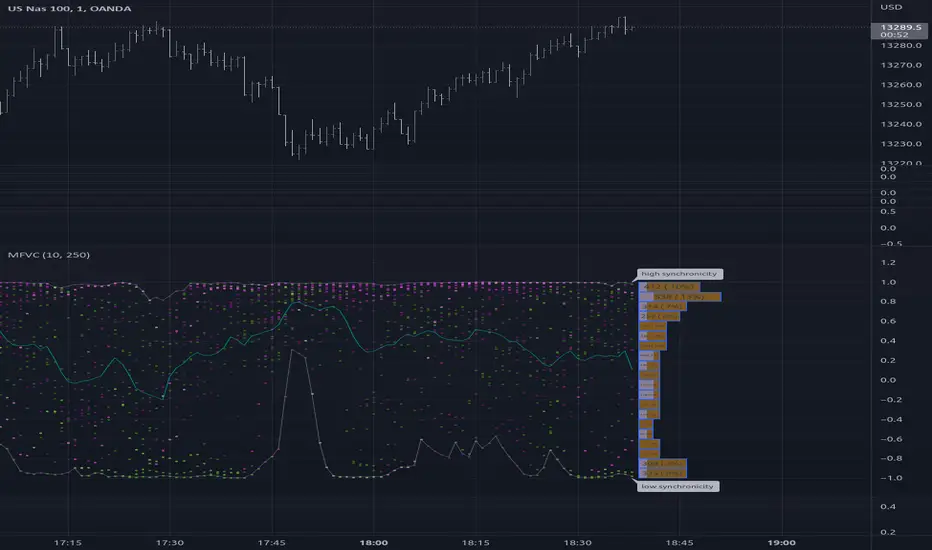
Multiple Frequency Volatility CorrelationThis is a complex indicator that looks to provide some insight into the correlation between volume and price volatility.
Rising volatility is depicted with the color green while falling volatility is depicted with purple.
Lightness of the color is used to depict the length of the window used, darker == shorter in the 2 -> 512 window range.
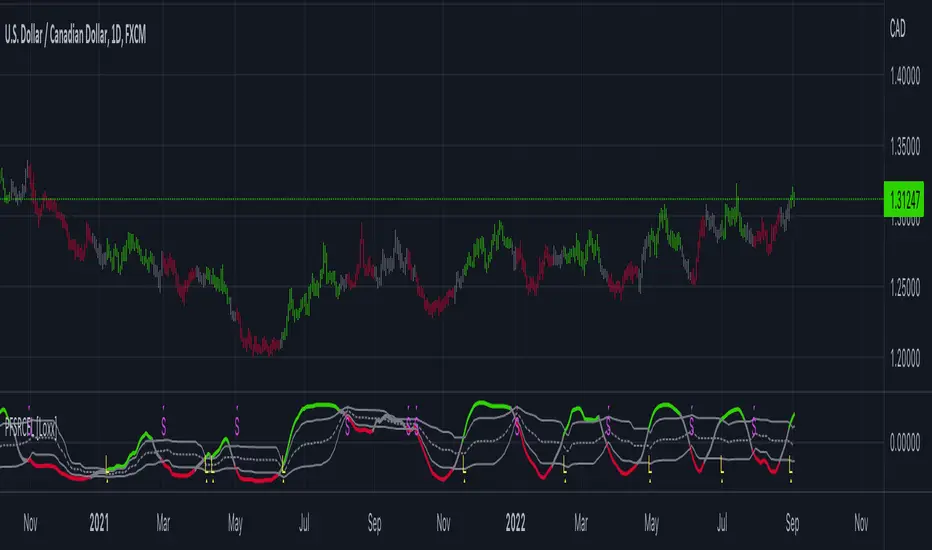
Price-Filtered Spearman Rank Correl. w/ Floating Levels [Loxx]Price-Filtered Spearman Rank Correl. w/ Floating Levels is a Spearman Rank Correlation indicator with optional source filtering and floating levels.
What is Spearman rank correlation?
Spearman rank correlation, also known as Spearman coefficient is a formula used to identify the strength of the link between two datasets. This coefficient is a method that can be used to assess the strength of a relationship apart from the direction it takes. The formula, named after Charles Spearman, a mathematician, can only be used in circumstances where data can be categorized or put in order, for instance, the highest to the lowest.
For a better understanding of Spearman coefficient, it helps to get a sense of what monotonic function means. There’s a monotonic relationship under these circumstances:
– When the variable values rise together.
– When one variable value rises the other variable value lowers.
– The rate of movement of the variables need not necessarily be constant.
The Spearman correlation coefficient or rs, between +1 and -1, where +1 indicates a perfect strength between variables, while zero shows no association and -1 shows a perfect negative strength.
Spearman rank correlation theory:
A nonparametric (distribution-free) rank statistic proposed by Spearman in 1904 as a measure of the strength of the associations between two variables (Lehmann and D'Abrera 1998). The Spearman rank correlation coefficient can be used to give an R-estimate, and is a measure of monotone association that is used when the distribution of the data make Pearson's correlation coefficient undesirable or misleading.
Included:
Zero-line and signal cross options for bar coloring, signals, and alerts
Alerts
3 Signal types
Loxx's Expanded Source Types
Swing Trading SPX CorrelationThis is a long timeframe script designed to benefit from the correlation with the Percentage of stocks Above 200 moving average from SPX
At the same time with this percentage we are creating a weighted moving average to smooth its accuracy.
The rules are simple :
If the moving average is increasing its a long signal/short exit
If the moving average is decreased its a short signal/long exit.
Curently the strategy has been adapted for long only entries.
If you have any questions let me know !

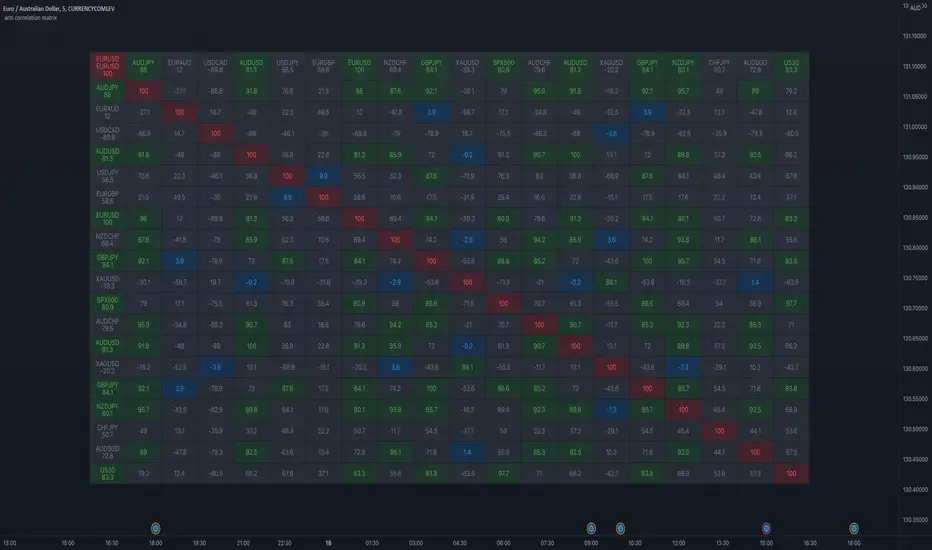
Greater Currency Correlation Matrix (Forex)Other available matrixes I found have a limited number of forex symbols. Consequentially, you need to keep switching them if you want to do a proper analysis. As a result of that, I produced my own currency matrix.
Correlation studies relationships between different price charts.
High correlation may be completely random in the short term, but it may signify a fundamental relationship between the two symbols if calculated over the long term.
For example, the currency of an oil-producing country may rally along with oil, whereas the importer's currency may drop. This means that watching the oil price chart may be worth it for such pairs.
The script includes all Major and Minor pairs with the addition of Gold (XAUEUR) and two optional symbols.
▬▬▬▬
To avoid too frequent use of security(), I decided to calculate all symbol values from EUR pairs. It should improve performance and keep room for some additional symbols in the future.
Please report any bugs.
Overlay Mini Plot(s) of Correlated Asset(s)Overlay a small plot of a correlated asset of your choosing. Shrink/expand, Set vertical and horizontal position, plot multiple mini-plots via duplicate indicators with varied settings.
Plots the last X bars of any asset; including the live candle currently painting
Useful for low time frame trading when you want to see correlated asset price movement right alongside the price movement you're watching.
Useful for quick and simple comparisons; when you don't want the clutter of split screen or multi-pane view.
Useful for backtesting.
Price scale agnostic; just plots the shape of the recent price action, with several optional labels: Asset+timeframe | Live Price | Highest price over X bars | Lowest price over X bars.
Works fine with all the assets i've tested it on.
~~User inputs~~
-number of bars to paint.
-horizontal offset: plot to right X bars or to left X bars
-vertical offset: shift up or down, shrink or expand; by using 2 'spacer' inputs
-color/transparancy of candles and price labels.
-width (pixels) of candle bodies.
-choose to display price labels or not
-choose to display asset label or not
~~Tips~~
--Add several of these indicators; changing the vertical 'Shift/Shrink' settings on each to visually separate them.
--In the above chart or EurUsd, there are three indicators =>> three mini-plots overlaid: DXY, EurGbp and GbpUsd. Using the following settings for Space Above:Space Below: DXY- 0.1:4.5 | EurGbp- 1.8:1.8 | GbpUsd- 4.5:0.1
--the more you add, the more you'll have to vertically shrink the plots
© twingall

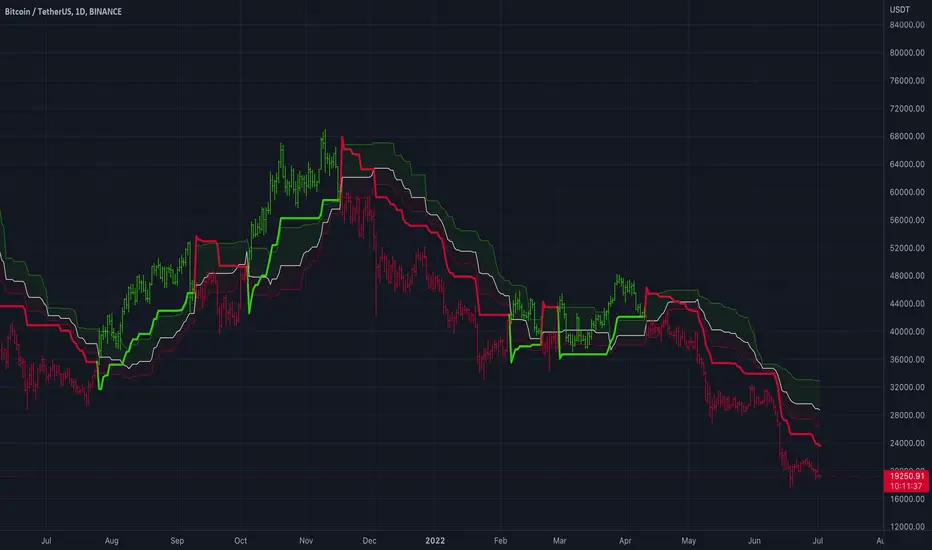
Adaptive Supertrend w/ Floating Levels [Loxx]Adaptive Supertrend w/ Floating Levels is a Supertrend indicator made adaptive by comparing the coefficient of determination / average of the least squares. The basic concept is this: use correlation with an r-squared line to adapt the period of the indicator, thereby resulting in a more versatile Supertrend. This adaptive formula makes the Supertrend more reactive to small fluctuation in the market while still doing what it's supposed to do: track trend. In addition, floating levels are drawn above or below the Supertrend which are calculated with percentage of the highest and lowest values of the Supertrend within the last “lookback” period. These floating levels act as filter to detect / prevent false trend reversals. T
What is the Supertrend?
Supertrend indicator was created by Olivier Seban to work on different time frames. It works for futures, forex, and equities. It is used in 15 minutes, hourly, weekly, and daily charts. Based on the parameters of multiplier and period, the indicator normally uses 3 for multiplier and 7 for the ATR period as default values. Average True Range is represented by the number of days while the multiplier is the value by which the range is multiplied.
Included
-Toggle on/off bar coloring
-Toggle on/off adaptivity
-Toggle on/off fill coloring
Hashrate BTC Correlation Swing StrategyThis is a swing strategy based entirely on external data , where in this case we use BTC HASHRATE coming from Glassnode
Its made to be used with 1Day Timeframe, and can be used with all the alt coins which are correlated with BTC asset
The strategy is simple
We take the weekly hashrate data , and we make a moving average out of it.
Once we have a cross up with the current weekly hashrate with the ma one, we have a long
Once we have a cross down with the current weekly hashrate with the ma one, we have a short
We exit when we either had 3 bearcandles in a row or a bull candle for long
We exit when we either had 3 bullcandles in a row or a bear candle for short
If you have any questions let me know !

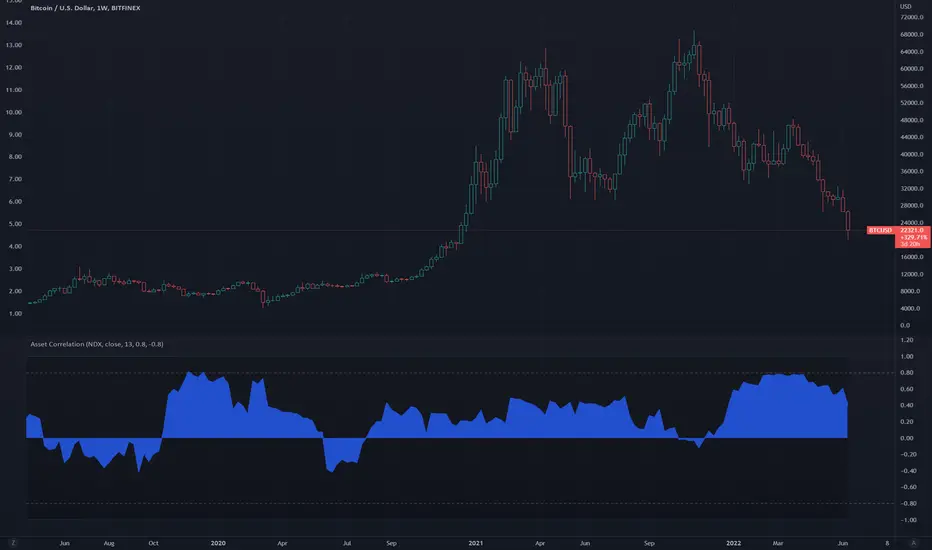
Asset CorrelationThis indicator shows correlation strength between the source asset plotted in the main chart and a user-input asset in the indicator panel. For example, if the main chart panel is displaying BTCUSD and the correlation indicator is NDX, then the correlation strength is plotted as the relationship between the two. A strong positive correlation target is set at 0.80 but can be changed. A strong negative correlation target is set at -0.80 and can also be changed.
The indicator also has an option for a plot of the ta.correlation() function for a reference line.
RSI correlation with cryptoindices [strategy version]Dear TV'ers,
Hereby the strategy script where the RSI of an altcoin can be compared to one of the selected cryptocap indices. Included are:
-total market cap
-total market cap minus bitcoin
-total market cap others
-total market cap usdt
-cix100 index
-btc dominance
-btc total cap
If the signal crosses over 1, then the altcoin is undervalued compared to the crypto index (and considered a buying signal here). If the signal crosses under 1, then the altcoin is overvalued compared to the selected crypto-index and a short signal is produced.
!!Please note that the selected timeframe for the reference pair should be a higher time of the chart in order to prevent repainting!!!

Macro EMA Correlation
This script is useful to see correlation between macroeconomic assets, displayed in different ema line shown in percentage to compare these assets on the same basis. Percentage will depend on the time frame selection. In the higher timeframe you will see higher variation and in small timeframe smaller variation.
You can select the timeframe who suit your trading style. The 1h and 4h fit well for longer trend swing trade and the lower time frame 15m, 5m, 1m are good for scalping or daily trading.
The following asset are available:
Bitcoin
Ethereum
Gold
Crypto total market cap excluding bitcoin (total2)
United state 10-year government bond (US10Y)
Usdt dominance show the concentration of usdt hold. For example, when trader are fearful they sell their crypto position to keep more usdt in their portfolio (USDT.D)
The USD/JPY pair the dollar usd versus the Japanese Yen one of the most forex traded pair.
You can clic on parameter to select the asset you want to analyse.
The main correlation observed are:
bitcoin negatively correlated with the usdt dominance.
bitcoin negatively correlated with the usd/jpy pair
bitcoin is positively correlated to eth, total2 (altcoin)
bitcoin positively correlated with gold
bitcoin is mostly negatively correlated to us10y
The basis of correlation is that positively correlated asset goes in the same direction and that the negatively correlated goes in opposite direction.
So, the idea is to use these information to see trend reversing.
Example 1: when bitcoin and usdt dominance are extended in opposite direction we look for a possible retracement toward 1% wich is the middle base.
Example 2 : when bitcoin make a move we look for ethereum and total 2 to follow

US Stock Market Sectors Overview Table [By MUQWISHI]US Market Overview Table will identify the bullish and bearish sectors of a day by tracking the SPDR sectors funds.
It's possible to add a ticker symbol for correlation compared to each sector.
Overview Indicator

Correlation of Price Spread and VolumeCorrelation between candle's price spread (length of candle of each bar) and volume.
Generally, increases in volume precede significant price movements. However, If the price is rising in an uptrend but the volume is reducing, it may show that there’s little interest in the instrument, and the price may reverse.
The closer the correlation is to 1.0, indicates the instruments will move up and down together as it is expected with volume and price spread. So the correlation Indicator aims to display when the price spread and volume is in correlation and not. Blue color represent positive correlation while orange negative correlation. The strength of the correlation is determined by the width of the bands.
SARWThis indicator aims to indicate the correlation between two assets(Current and Base), it does NOT show entries or help your chart analysis directly.
The main features of this Correlation indicator is :
Correlation type : Direct Correlation | Inverse Correlation | No Correlation
Correlation Percentage : as its name, it calculate the Correlation Percentage between Current and base assets if exist
How to use: Chose the base asset (default: bitcoin) and open any other chart to be the other -Current- asset
inputs:
Max Lookback length : how many candles will be included in the scan.
Swing intensity : How many candle should be counted to confirm a Swing, If you are confused leave it as its default.
Base Asset : The base asset to calculate the current asset correlation with.
Important Notes:
As I promised, the previous correlation indicator used each candle alone, while this one uses waves and swings.
The Current asset has more power over the base, because it compares the Base to current, but not the opposite((E.g. if you want to check if some coin have correlation with bitcoin, it's better to use bitcoin and put the other coin name in the input field)).
For any notes on the indicator to be edited, or for another indicator ideas please comment.

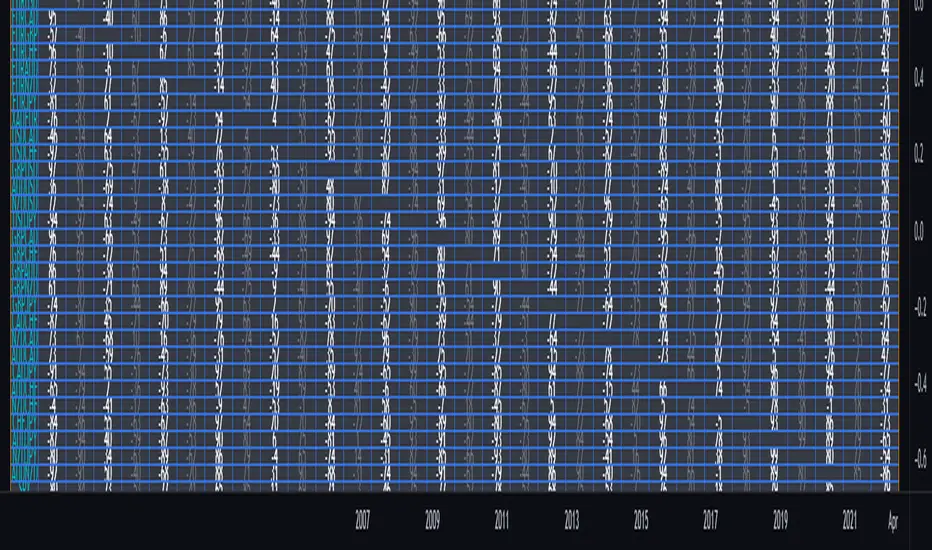
Anti correlation matrix 20x20Contain correlation matrix with filtering focused on not correlated pairs with blue color and with correlated negativly correlated with green color
SARCThis indicator aims to indicate the correlation between two assets(Current and Base), it does NOT show entries or help your chart analysis directly.
The main features of this Correlation indicator is :
Correlation type : Direct Correlation | Inverse Correlation | No Correlation
Correlation Percentage : as its name, it calculate the Correlation Percentage between Current and base assets if exist
Correlation Leader : If there is a correlation , it indicates which asset follows the other (Current Asset Follows Base | Base Follows Current Asset)
Correlation bars : if the box (Show Correlation Candles) on the settings was True, it will show GREEN lines above candles which have direct correlation and RED lines above candles which have inverse correlation
How to use: Chose the base asset (default: bitcoin) and open any other chart to be the other -Current- asset
inputs:
Max Lookback length : how many candles will be included in the scan.
Correlation Factor : how stronger the correlation should be to include the candle(E.g. if set to 50, if any candle correlation was less than 50 it will be ignored), If you are confused leave it as its default.
Base Asset : The base asset to calculate the current asset correlation with.
Show Correlation Candles : (True | false) explained above on the main features.
Note: this indicator uses every single candle and compare it to the base same time candle, after some time I will post another similar indicator, BUT the new one will use the whole direction of the assets instead of each candle alone, I hope one of them can help you.
For any notes on the indicator to be edited, or for another indicator ideas please comment.

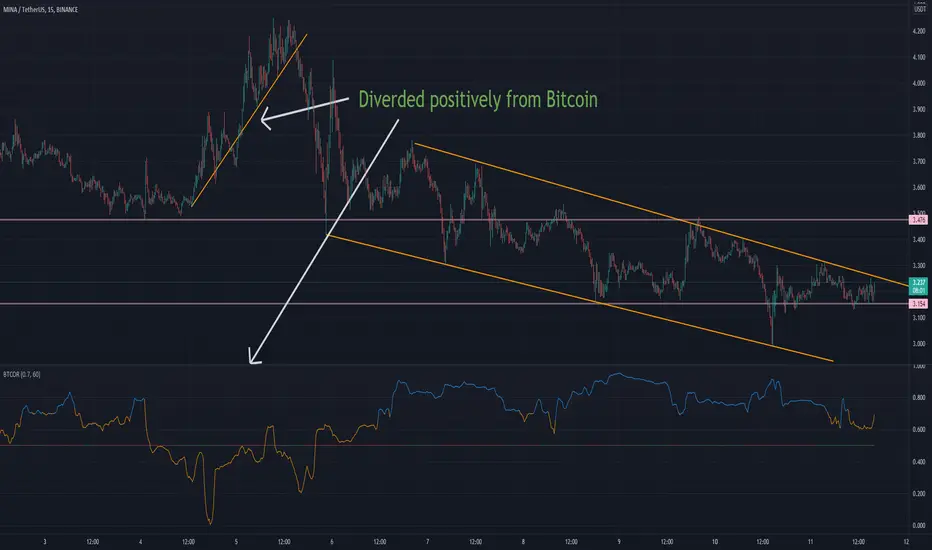
BTC-CORRELATIONShows Bitcoin correlation with the selected asset. Threshold can be adjusted between 0 and 1 for adjusting the level for which color changes to orange that is diverged while blue color is correlated. The fixed 0.5 value line changes color with red Bitcoin falling and green Bitcoin rising.
Adaptive Trend Cipher loxx]Adaptive Trend Cipher
Highly experimental!
Features:
-Implements 5 different Dominant Adaptive Cycle Measures to determine optimal inputs for correlation functions. These cycle calculations include the following: **
* Ehler's Autocorrelation Dominant Cycle
* Ehler's Instantaneous Dominant Cycle
* Ehler's Band-pass Dominant Cycle
* Ehler's Hilbert Period Dominant Cycle
* Ehler's Dual Differentiator Dominant Cycle
**additional cycle measures to be added in future releases
-Uses price to time correlation with look-back periods determined by the dominant cycle measures
-Allows users to manipulate the range of Dominant Cycle inputs, also allows the user to change the size % of the the output Dominant cycle to be used to determine correlation lengths
-Bars are colored according to correlation extremes. Green bars are uptrend, Red bars are downtrend; Yellow bars are high correlation, Fuchsia bars are low correlation
Uses
-Trend cipher is a novel approach to teasing out macro trends in the market. This version is geared to be used on the daily time frame only
-Reversals at yellow and fuchsia bars when they appear, it shows price exhaustion using
Warning: This may not work on certain assets due to the high processing power required to calculate cycle dominance. This also uses a custom correlation function since the data being input intot he correlation function is not constant but variable based on cycle dominance at every bar. To correct this in most circumstances you must change the max_bars_back constant in the indicator method call
If you use parts of the code, please let me know, I would love to hear what you do with it.
Happy trading!
Delta Agnostic Correlation CoefficientVisually see how well a symbol tracks another's movements, without taking price deltas into account.
For example, a 1% move on the index and a 5% move on the target will return a DCC value of 1. An index move of 0.5% on the index and a 10% move on the target will also return a DCC value of 1. The same happens for downward moves.
The SMA value can be set to smooth the curve. A larger value creates a smoother curve.

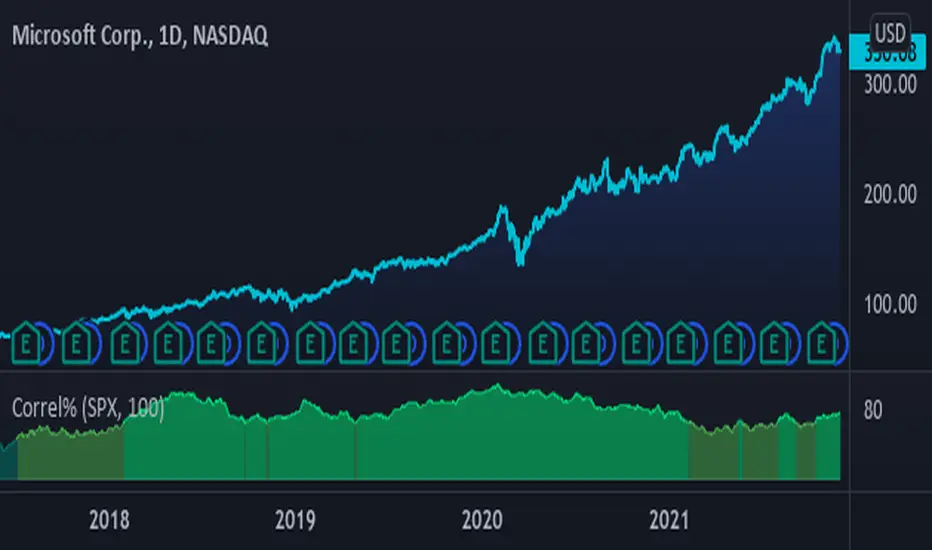
Racer Correlation [racer8]This indicator gauges correlation between 2 markets using my own method I invented. It is far superior to the correlation coefficient in that it maintains steady correlation values, meaning less false signals regarding correlation. Yet, the indicator's calculation is very simple in fact...
It simply calculates the percentage of moves in the same direction as the other market. So if MSFT moved in the same direction as SPX 80% of the time, then the indicator would show you a value of 80. Unlike correlation coefficient, you can calculate exactly how many of MSFT's bars moved in the same direction as SPX's bars. Everytime MSFT moves in the same direction as SPX, it is included in the percentage of positively correlated moves.
Closing prices are used solely in the indicator's calculations. All indicator values represent a percentage. Also, I recommend a length of at least 100 periods.
Values between 0% and 25% indicate strong negative correlation. (bright red)
Values between 25% and 33% indicate moderate negative correlation. (red)
Values between 33% and 50% indicate weak negative correlation. (dark red)
Values between 50% and 67% indicate weak positive correlation. (dark green)
Values between 67% and 75% indicate moderate positive correlation. (green)
Values between 75% and 100% indicate strong positive correlation. (bright green)........Enjoy :)
Correlation IndexShows how often and how much the underlying security deviates from the base stock.
Indices that help in the selection of securities:
Lst10 - last 10(long factor parameter) periods average
Aver - fulltime averaged
pwr - total deviation area from base
ust - unstability (drawdown index)
cor - percent of positive bars
cross - fulltime averaged deviation

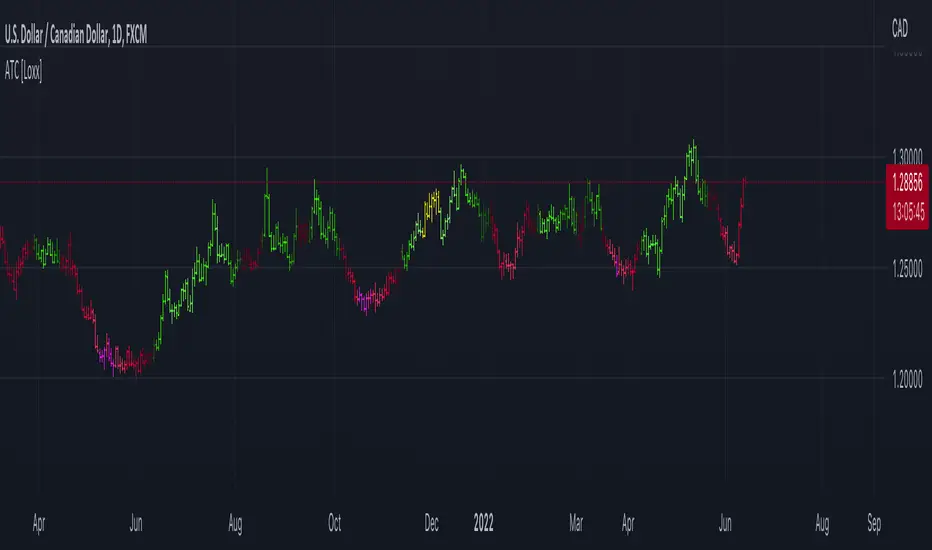
Correlation Mandate for Relational AnalysisThis indicator is engineered to make relational analysis much easier.
If you used another window for each symbol, you would have to resize them all one by one. You don't need another timescale.
There are three modes:
► Independent - selected symbol candles are colored on their own.
► Correlational - selected symbol candles are colored depending on their relation to the chart symbol. If it is correlational, 1st color is chosen (both have Close higher than Open). 2nd color will be used for the opposite.
► Anti-Correlational - the opposite of Correlational
To display my indicator, I chose USDCAD and Oil. Canada has the second-largest oil reserves in the world and naturally, they are their neighbor's supplier. If the oil price goes up, USDCAD should be tanking, unless a different major influence(s) happen to be stronger at a time.
Good luck!
