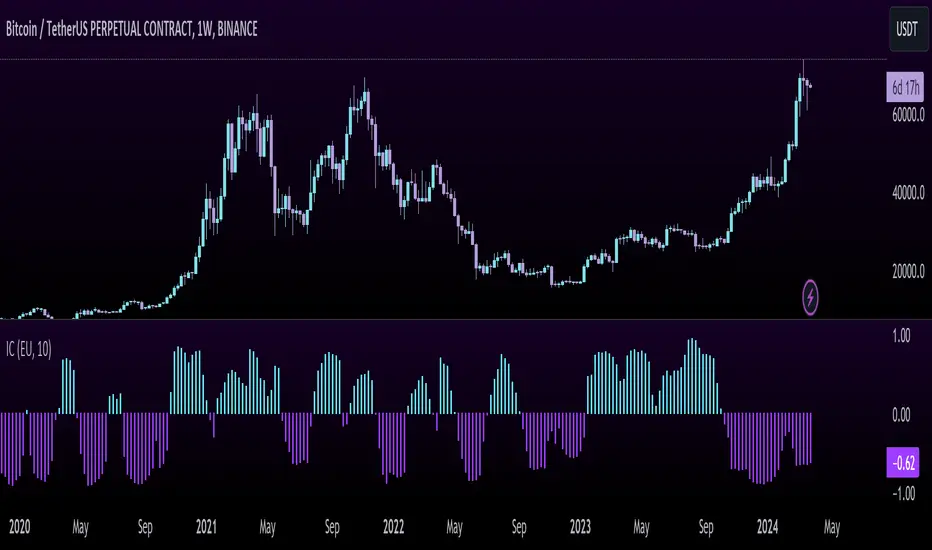
Inflation CorrelationHeyo fellas,
In today’s dynamic economic landscape, understanding the relationship of market prices to other economical factors like inflation rate is crucial. The Inflation Correlation Indicator is designed to provide traders with a clear visualization of this relationship. By correlating average inflation rates from selected countries with market closing prices, this indicator offers a unique perspective on potential market movements influenced by inflationary trends.
Features:
Country Selection: Choose from the European Union (EU), Germany (DE), or the United States (US) to tailor the correlation analysis to your specific market interest.
Correlation Length Customization: Adjust the correlation length to refine the sensitivity of the indicator to recent inflation data.
Visual Clarity: The correlation histogram changes color based on the direction of the correlation, providing an intuitive understanding of the inflation correlation.
Whether you’re a fundamental analyst seeking to incorporate macroeconomic indicators into your strategy or a trader looking for an edge in inflation-sensitive markets, the Inflation Correlation Indicator is an indispensable tool in your TradingView arsenal.
Thanks for checking this out!
Best regards,
simwai
Correlation
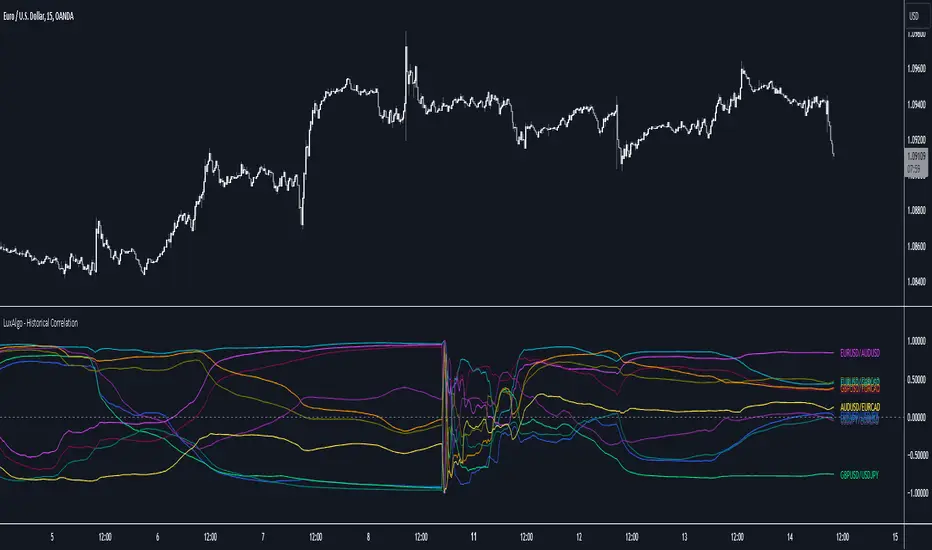
Historical Correlation [LuxAlgo]The Historical Correlation tool aims to provide the historical correlation coefficients of up to 10 pairs of user-defined tickers starting from a user-defined point in time.
Users can choose to display the historical values as lines or the most recent correlation values as a heat map.
🔶 USAGE
This tool provides historical correlation coefficients, the correlation coefficient between two assets highlight their linear relationship and is always within the range (-1, 1).
It is a simple and easy to use statistical tool, with the following interpretation:
Positive correlation (values close to +1.0): the two assets move in sync, they rise and fall at the same time.
Negative correlation (values close to -1.0): the two assets move in opposite directions: when one goes up, the other goes down and vice versa.
No correlation (values close to 0): the two assets move independently.
The user must confirm the selection of the anchor point in order for the tool to be executed; this can be done directly on the chart by clicking on any bar, or via the date field in the settings panel.
For the parameter Anchor period , the user can choose between the following values NONE, HOURLY, DAILY, WEEKLY, MONTHLY, QUARTERLY and YEARLY. If NONE is selected, there will be no resetting of the calculations, otherwise the calculations will start from the first bar of the new period.
There is a wide range of trading strategies that make use of correlation coefficients between assets, some examples are:
Pair Trading: Traders may wish to take advantage of divergences in the price movements of highly positively correlated assets; even highly positively correlated assets do not always move in the same direction; when assets with a correlation close to +1.0 diverge in their behavior, traders may see this as an opportunity to buy one and sell the other in the expectation that the assets will return to the likely same price behavior.
Sector rotation: Traders may want to favor some sectors that are expected to perform in the next cycle, tracking the correlation between different sectors and between the sector and the overall market.
Diversification: Traders can aim to have a diversified portfolio of uncorrelated assets. From a risk management perspective, it is useful to know the correlation between the assets in your portfolio, if you hold equal positions in positively correlated assets, your risk is tilted in the same direction, so if the assets move against you, your risk is doubled. You can avoid this increased risk by choosing uncorrelated assets so that they move independently.
Hedging: Traders may want to hedge positions with correlated assets, from a hedging perspective, if you are long an asset, you can hedge going long a negative correlated asset or going short a positive correlated asset.
Traders generally need to develop awareness, a key point is to be aware of the relationships between the assets we hold or trade, the historical correlation is an invaluable tool in our arsenal which allows us to make better informed decisions.
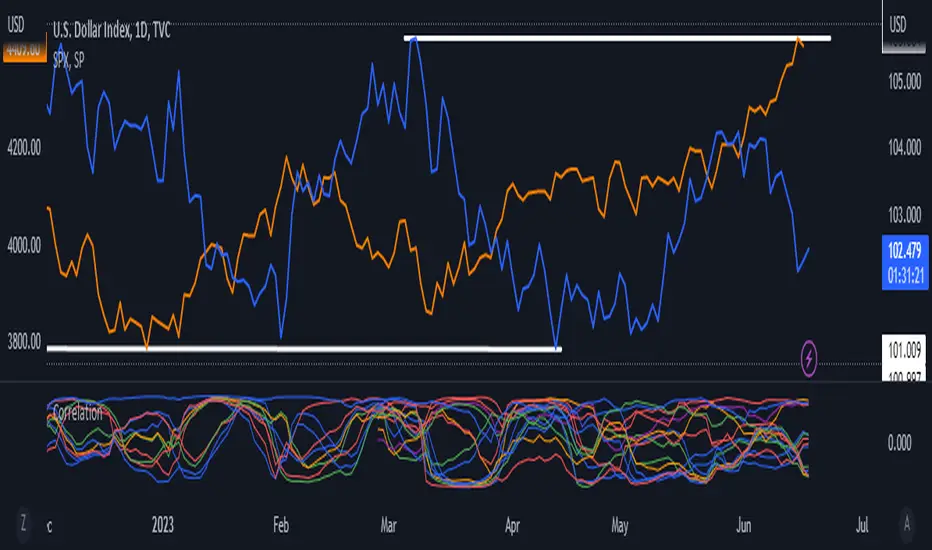
On this chart we have an example of historical correlations for several futures markets.
We can clearly see how positively correlated the Nasdaq100 and Dow30 are with the SP500 over the whole period, or how the correlation between the Euro and the SP500 falls from almost +85% to almost -4% since 2021.
As we can see, correlations, like everything else in the market, are not static and vary over time depending on many factors, from macro to technical and everything in between.
🔹 Heatmap
The chart above shows the tool with the default settings and the Drawing Mode set to 'HEATMAP'.
We can see the current correlation between the assets, in this case the FX pairs.
The highest positive correlation is +90% (+0.90) between EURUSD and GBPUSD.
The highest negative correlation is -78% (-0.78) between EURUSD and USDJPY.
The pair with no correlation is AUDUSD and EURCAD with 1% (0.01)
On the above chart we can see the current correlations for the futures markets.
Currently, the assets that are less correlated to the SP500 are NaturalGas and the Euro, the more positive correlations are Nasdaq100 and Dow20, and the more negative correlations are the Yen, Treasury Bonds and 10-Year Notes.
🔶 DETAILS
🔹 Anchor Period
This chart shows the standard FX correlations with the Anchor Period set to `MONTHLY`.
We can clearly see how the calculations restart with the new month, in this case we can clearly see the differences between the correlations from month to month.
Let us look at the correlation coefficient between GBPUSD and USDJPY
In January, their correlation started at close to -100%, rose to close to +50%, only to fall to close to 0% and remain there for the second half of the month.
In February it was -90% in the first few days of the month and is now around -57%.
And between AUDUSD and EURCAD
Last month their correlation was negative for most of the month, reaching -70% and ending around -14%.
This month their correlation has never gone below +21% and at the time of writing is close to +53%.
🔶 SETTINGS
Anchor point: Starting point from which the tool is executed
Anchor period: At the beginning of each new period, the tool will reset the calculations
Pairs from 1 to 10: For each pair of tickers, you can: enable/disable the pair, select the color and specify the two tickers from which you wish to obtain the correlation
🔹 Style
Drawing Mode: Output style, `LINES` will show the historical correlations as lines, `HEATMAP` will show the current correlations with a color gradient from green for correlations near 1 to red for correlations near -1.
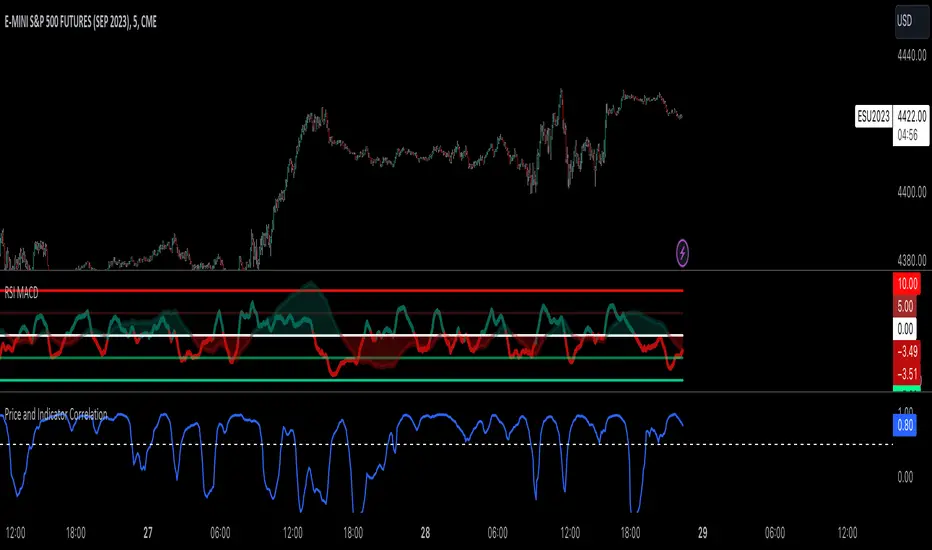
Open Interest Inflows & Outflows [LuxAlgo]The Open Interest Inflows & Outflows indicator focuses on highlighting alterations in the overall count of active contracts associated with a specific financial instrument.
The indicator also includes an oscillator highlighting the price sentiment to use in conjunction with the open interest flow sentiment and also includes a rolling correlation of the open interest flow sentiment with a user-selected source.
🔶 USAGE
Open Interest (OI) indicates the total number of active contracts, encompassing both long and short positions, for a specific financial instrument at any given moment. This key indicator helps traders and analysts assess market activity and sentiment.
An increase in open interest generally indicates new money flowing into the market, suggesting increased activity and the potential for a trending market. Conversely, a decrease in open interest indicates that traders are closing their positions, suggesting less interest in that particular contract.
Open Interest Flow Sentiment assesses the correlation between the initiation of new positions (inflows) and the closure of existing positions (outflows) for a particular instrument. Positive values suggest a prevalence of inflows, while negative values signify a prevalence of outflows.
The magnitude of the deviation from zero reflects the extent of dominance, either in inflows or outflows.
Price Sentiment estimates the relationship between the strength of bulls (buyers) and bears (sellers) on an instrument. Positive values indicate higher bull power and negative values indicate higher bear power.
The correlation feature is a key component of the indicator and helps analyze the relationship between trading volume and Open Interest changes. If volume increases along with rising Open Interest, it supports the validity of the price trend.
A divergence between price movement, volume, and Open Interest may signal potential reversals.
🔶 DETAILS
This indicator, based on Dr. Alexander Elder's acclaimed Elder-Ray concept, aids traders in evaluating the strength of both bulls and bears by delving beneath the surface of the markets. It uncovers data not immediately apparent from a superficial glance at prices. The indicator comprises two components: Bull Power and Bear Power.
Considering that the high price of any candle signifies the maximum power of buyers and the low price represents the maximum power of sellers, Elder employs the 13-period Exponential Moving Average (EMA) to depict the average consensus of price value. Bull Power assesses whether buyers can drive prices above the average consensus of value, while Bear Power assesses whether sellers can push prices below this average.
Here are the formulas for Bull Power and Bear Power:
bull_power = high - ema(close, 13)
bear_power = low - ema(close, 13)
This concept is utilized to calculate Open Interest Flow Sentiment and Price Sentiment. The Open Interest Flow Sentiment estimates the relationship between new positions (inflows) and positions being closed (outflows), providing insights into market dynamics. The Price Sentiment, on the other hand, gauges the correlation between price movements and the Elder-Ray components, aiding traders in identifying potential shifts in market sentiment and momentum.
🔶 SETTINGS
🔹Open Interest Inflows & Outflows
OI Sentiment Correlation: toggles the visibility of Open Interest correlation with a variety of sources.
Money Flow Estimates: toggles the visibility of Money Flow Estimates calculated for the last bar.
🔹Style
OI Flow Sentiment: toggles the visibility of Open Interest Flow Sentiment, along with color customization options.
Price Sentiment: toggles the visibility of Price Sentiment, along with color customization options.
Correlation Colors: color customization option for the Correlation Area.
🔹Others
Smoothing: smoothing length applicable for Open Interest Flow Sentiment and Price Sentiment.
🔶 RELATED SCRIPTS
Open-Interest-Chart
Liquidation-Estimates
Thanks to our community for recommending this script. For more conceptual scripts and related content, we welcome you to explore by visiting >>> LuxAlgo-Scripts .

Test - Most correlated assetThis is a simple test to find the most and least correlated assets in a list.

Multi-Market Correlation Explorer [kikfraben]Multi-Market Correlation Explorer
The Multi-Market Correlation Explorer (MMCE) is a powerful tool designed to provide insights into the correlations and relative strength of various financial instruments across different markets. This indicator allows traders and investors to assess the intermarket relationships and potential opportunities by analyzing a set of ten symbols, including indices, commodities, and currencies.
Key Features:
Source Selection:
Choose your preferred data source (e.g., close, open, high, low) for all calculations.
Base Symbol for Correlations:
Define a base symbol (default: BTC/USD) for correlation calculations. The indicator evaluates how other symbols correlate with this base symbol.
Customizable Colors:
Easily identify trends with customizable colors for up and down movements, text, background, and table elements.
Length Inputs:
Tailor the analysis to your needs by adjusting the lengths for correlation calculations and RSI (Relative Strength Index).
Symbols:
Select up to ten symbols from various markets, such as stock indices, bond yields, commodities, and currencies.
Correlation Scores:
Gain insights into the strength and direction of correlations between the base symbol and selected symbols over different time lengths.
Scoring System:
Assign scores based on RSI conditions (1 for RSI > 50, -1 for RSI < 50) to each symbol.
Total Score Calculation:
Calculate a total score for each symbol by combining correlation averages and RSI scores.
Color Formatting:
Visualize correlation strengths through a color-coded system for better interpretation.
How to Use:
Positive total scores suggest potential bullish opportunities, while negative scores may indicate bearish tendencies. Combined with the visual representation of correlation strengths, traders can make informed decisions.
The Multi-Market Correlation Explorer enhances your ability to understand complex market relationships, enabling you to stay ahead of trends and identify potential trading or investment opportunities.

Sector relative strength and correlation by KaschkoThis script provides a quick overview of the relative strength and correlation of the symbols in a sector by showing a line chart of the close prices on a percent scale with all symbols starting at zero at the left side of the chart. It allows a great deal of flexibility in the configuration of the sectors and symbols in it. The standard preset sectors cover the most important futures markets and their symbols.
However, up to ten sectors with up to ten symbols each can be freely configured. Each sector is defined by a single line that has the following format:
Sector name:Symbol suffix:List of comma separated symbols
For example, the first predefined sector is defined as follows.
Energies:1!:CL,HO,NG,RB
1. The name of the sector is "Energies"
2. The suffix is "1!", i.e., to each symbol in the list "1!" is appended to get the continous future for the given symbol root. When using stock, forex or other symbols, simply leave the suffix empty.
3. The list of comma separated symbols is "CL,HO,NG,RB", i.e. crude oil, heating oil, natural gas and gasoline. As the suffix is "1!", the actual symbols whose prices are shown are "CL1!","HO1!","NG1!" and "RB1!"
You can choose to use settlement-as-close and back-adjusted contracts. The sector can also be determined automatically ("Auto-select"). In this case, it is determined to which sector the symbol currently displayed in the main chart belongs and the script displays it in the context of the other symbols in the sector.
By selecting a suitable chart time frame and time range, you can quickly determine which symbols in the sector are stronger or weaker and which are more or less strongly correlated.
The following symbols are best suited for a quick trial, as the sectors are preset for these:
CL1!,ES1!,6A1!,6B1!,6c1!,6E1!,6J1!,6M1!,6N1!,6S1!,GC1!,GF1!,HE1!,HG1!,HO1!,LBR1!,LE1!,NG1!,NQ1!,PA1!,PL1!,RB1!,SI1!,YM1!,ZB1!,ZC1!,ZF1!,ZL1!,ZM1!,ZN1!,ZO1!,ZR1!,ZS1!,ZT1!,ZW1!,CC1!,CT1!,DX1!,KC1!,OJ1!,SB1!,RTY1!
You can also use the script to compare any symbols (e.g. different shares) with each other. Preferably use the "Custom" sector for this.

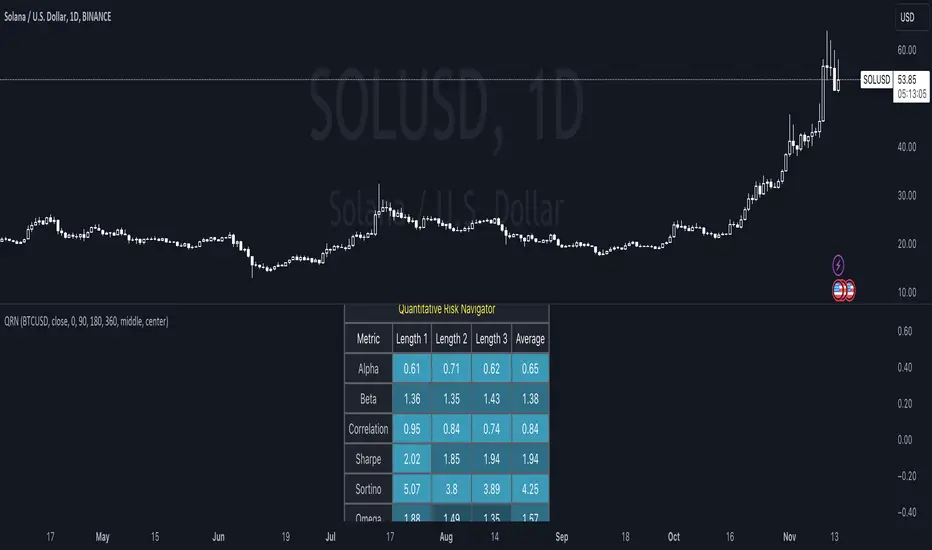
Quantitative Risk Navigator [kikfraben]📊 Quantitative Risk Navigator - Your Financial Performance GPS
Navigate the complexities of financial markets with confidence using the Quantitative Risk Navigator. This indicator provides you with a comprehensive dashboard to assess and understand the risk and performance of your chosen asset.
📈 Key Features:
Alpha and Beta Analysis: Uncover the outperformance (Alpha) and risk exposure (Beta) of your asset compared to a selected benchmark. Know where your investment stands in the market.
Correlation Insights: Understand the relationship between your asset and its benchmark through a clear visualization of correlation trends over different time lengths.
Risk-Return Metrics: Evaluate risk and return simultaneously with Sharpe and Sortino ratios. Make informed decisions by assessing the reward-to-risk ratio of your investment.
Omega Ratio: Gain deeper insights into your asset's performance by analyzing the Omega Ratio, which highlights the distribution of positive and negative returns.
Customizable Visualization: Tailor your chart to focus on specific metrics and time frames. Choose which metrics to display, allowing you to concentrate on the aspects that matter most to you.
Interactive Metrics Table: A user-friendly metrics table provides a quick overview of key values, including average metrics, enabling you to grasp the financial health of your asset at a glance.
Color-Coded Clarity: The indicator employs color-coded visualizations, making it easy to identify bullish and bearish trends, helping you make rapid and informed decisions.
🛠️ How to Use:
Symbol Selection: Choose your base symbol and preferred data source for analysis.
Risk-Free Rate: Input your risk-free rate to fine-tune calculations.
Length Customization: Adjust the lengths for different metrics to align with your analysis preferences.
Whether you're a seasoned trader or just stepping into the financial world, the Quantitative Risk Navigator empowers you to make strategic decisions by providing a comprehensive view of your asset's risk and return profile. Stay in control of your investments with this powerful financial GPS.
🚀 Start Navigating Your Financial Journey Today!
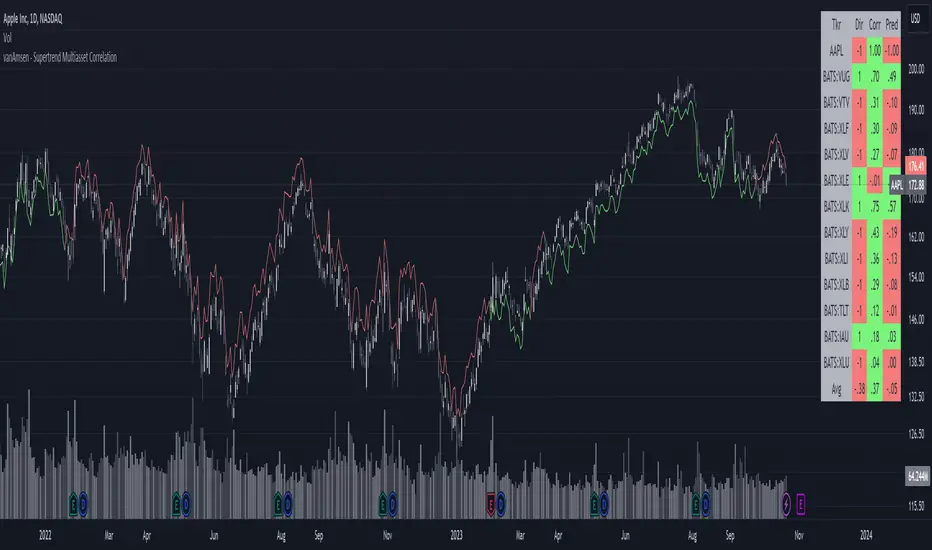
Supertrend Multiasset Correlation - vanAmsen Hello traders!
I am elated to introduce the "Supertrend Multiasset Correlation" , a groundbreaking fusion of the trusted Supertrend with multi-asset correlation insights. This approach offers traders a nuanced, multi-layered perspective of the market.
The Underlying Concept:
Ever pondered over the term Multiasset Correlation?
In the intricate tapestry of financial markets, assets do not operate in silos. Their movements are frequently intertwined, sometimes palpably so, and at other times more covertly. Understanding these correlations can unlock deeper insights into overarching market narratives and directional trends.
By melding the Supertrend with multi-asset correlations, we craft a holistic narrative. This allows traders to fathom not merely the trend of a lone asset but to appreciate its dynamics within a broader market tableau.
Strategy Insights:
At the core of this indicator is its strategic approach. For every asset, a signal is generated based on the Supertrend parameters you've configured. Subsequently, the correlation of daily price changes is assessed. The ultimate signal on the selected asset emerges from the average of the squared correlations, factoring in their direction. This indicator not only accounts for the asset under scrutiny (hence a correlation of 1) but also integrates 12 additional assets. By default, these span U.S. growth ETFs, value ETFs, sector ETFs, bonds, and gold.
Indicator Highlights:
The "Supertrend Multiasset Correlation" isn't your run-of-the-mill Supertrend adaptation. It's a bespoke concoction, tailored to arm traders with an all-encompassing view of market intricacies, fortified with robust correlation metrics.
Key Features:
- Supertrend Line : A crystal-clear visual depiction of the prevailing market trajectory.
- Multiasset Correlation : Delve into the intricate interplay of various assets and their correlation with your primary instrument.
- Interactive Correlation Table : Nestled at the top right, this table offers a succinct overview of correlation metrics.
- Predictive Insights : Leveraging correlations to proffer predictive pointers, adding another layer of conviction to your trades.
Usage Nuances:
- The bullish Supertrend line radiates in a rejuvenating green hue, indicative of potential upward swings.
- On the flip side, the bearish trajectory stands out in a striking red, signaling possible downtrends.
- A rich suite of customization tools ensures that the chart resonates with your trading ethos.
Parting Words:
While the "Supertrend Multiasset Correlation" bestows traders with a rejuvenated perspective, it's paramount to embed it within a comprehensive trading blueprint. This would include blending it with other technical tools and adhering to stringent risk management practices. And remember, before plunging into live trades, always backtest to fine-tune your strategies.
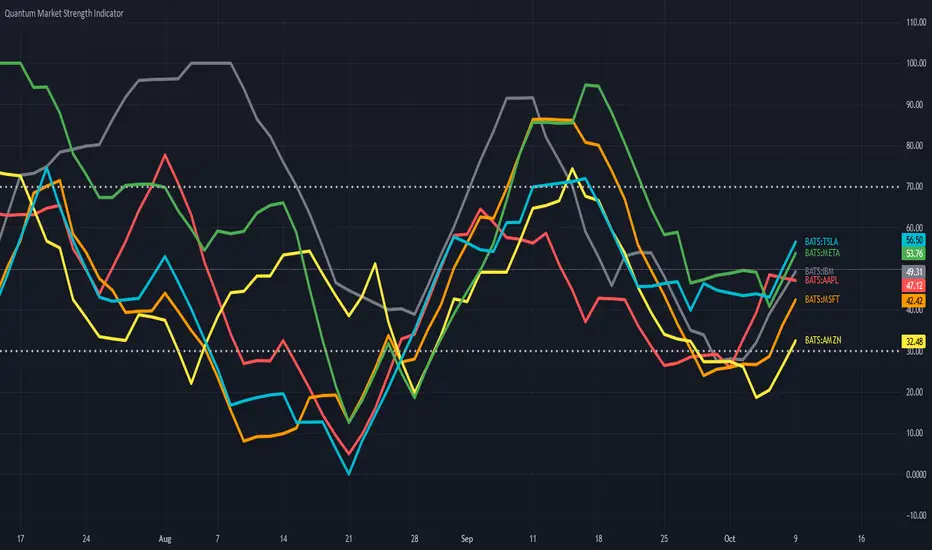
Quantum Market Strength Indicator (MSI)The Market Strength Indicator (MSI) is yet another in our stable of volume-based indicators, and as such, is a must-have tool for trading virtually any type of market and across a myriad of applications from trend trading to swing trading, scalping, and much more. While its sister indicator, the Currency Strength Indicator (CSI), helps you analyze which currencies are oversold, overbought, correlating, and trending, the MSI or Market Strength Indicator does this also, but in this case, for all markets, including stocks, ETFs, futures, and cryptocurrencies, but with one key difference – VOLUME.
As with our core methodology of volume price analysis, volume adds an entirely new dimension to trading analysis as it reveals the driving pressure behind the price action, be it strong or weak, which are all factored into the algorithm that drives the Market Strength Indicator. But with the MSI indicator, its use and application is only limited by your imagination.
For example, we can use it to see which markets are correlating and which are not so that we might use it as an intraday tool for index futures. And, of course, with knowledge gained from the stock trading and investing program, we could then further validate any analysis by setting each against the top five market cap stocks, for confirmation of strength and to give us more confidence in trading an index future.
And not just index futures, but any futures you care to consider, such as energy, metals, softs, currencies or anything else.
For day traders of stocks, you might wish to see which are correlating with one another and which are not, for example, if you are pairs trading, and also whether a particular stock is moving with the primary futures index. If not, this may be a warning sign. And of course, for ETF traders, we have the SPY, a host of ETFs, and alongside them, the sectors, such as the XLK, the XLE, and more, giving you an instant and powerful insight into sentiment across the entire market complex.
The Market Strength Indicator has much to offer; whether you are a stock investor or day trading scalper, index or ETF trader, swing trader or trend trader, it is all here as the indicator signals in a clear and intuitive way when a stock, future or ETF is overbought or oversold in all timeframes, giving you that potent insight into potential reversals from strong to weak and back again. If you enjoy getting into a trend early and trading reversals, then this is the indicator for you, but if you prefer trading trends – no problem, just jump aboard once the move has some momentum and is underway as displayed by the steepness of the line on the indicator.
It’s all here and so much more, from market correlations to market strength and weakness and in all the timeframes from seconds to months.
And just like its sister indicator, the CSI, the MSI is an oscillator that moves seamlessly from overbought to oversold and back again between a value of 100 at the top and zero at the bottom, with each instrument or market represented with a single-colored line. To help further, we’ve included two regions on the indicator to represent these states at 70 and 30, respectively, but you can change these accordingly and perhaps extend them further to 80 and 20. These levels are purely intended as guides to help provide additional information as to the market state and a potential reversal in due course.
Now, in a single indicator, you have the opportunity to gauge sentiment across multiple markets, whether these are correlating or not, and from there develop a myriad of trading opportunities, or alternatively give you that all-important confidence to dive in, or maintain an existing position. Through its unique algorithm based on volume, it is another indicator only limited by your imagination, and like all our other indicators, one we urge you to use in multiple timeframes.
Triple Ehlers Market StateClear trend identification is an important aspect of finding the right side to trade, another is getting the best buying/selling price on a pullback, retracement or reversal. Triple Ehlers Market State can do both.
Three is always better
Ehlers’ original formulation produces bullish, bearish and trendless signals. The indicator presented here gate stages three correlation cycles of adjustable lengths and degree thresholds, displaying a more refined view of bullish, bearish and trendless markets, in a compact and novel way.
Stick with the default settings, or experiment with the cycle period and threshold angle of each cycle, then choose whether ‘Recent trend weighting’ is included in candle colouring.
John Ehlers is a highly respected trading maths head who may need no introduction here. His idea for Market State was published in TASC June 2020 Traders Tips. The awesome interpretation of Ehlers’ work on which Triple Ehlers Market State’s correlation cycle calculations are based can be found at:
DISCLAIMER: None of this is financial advice.

K's Reversal Indicator IIIK's Reversal Indicator III is based on the concept of autocorrelation of returns. The main theory is that extreme autocorrelation (trending) that coincide with a technical signals such as one from the RSI, may result in a powerful short-term signal that can be exploited.
The indicator is calculated as follows:
1. Calculate the price differential (returns) as the current price minus the previous price.
2. the correlation between the current return and the return from 14 periods ago using a lookback of 14 periods.
3. Calculate a 14-period RSI on the close prices.
To generate the signals, use the following rules:
* A bullish signal is generated whenever the correlation is above 0.60 while the RSI is below 40.
* A bearish signal is generated whenever the correlation is above 0.60 while the RSI is above 60.

Robust Bollinger Bands with Trend StrengthThe "Robust Bollinger Bands with Trend Strength" indicator is a technical analysis tool designed assess price volatility, identify potential trading opportunities, and gauge trend strength. It combines several robust statistical methods and percentile-based calculations to provide valuable information about price movements with Improved Resilience to Noise while mitigating the impact of outliers and non-normality in price data.
Here's a breakdown of how this indicator works and the information it provides:
Bollinger Bands Calculation: Similar to traditional Bollinger Bands, this indicator calculates the upper and lower bands that envelop the median (centerline) of the price data. These bands represent the potential upper and lower boundaries of price movements.
Robust Statistics: Instead of using standard deviation, this indicator employs robust statistical measures to calculate the bands (spread). Specifically, it uses the Interquartile Range (IQR), which is the range between the 25th percentile (low price) and the 75th percentile (high price). Robust statistics are less affected by extreme values (outliers) and data distributions that may not be perfectly normal. This makes the bands more resistant to unusual price spikes.
Median as Centerline: The indicator utilizes the median of the chosen price source (either HLC3 or VWMA) as the central reference point for the bands. The median is less affected by outliers than the mean (average), making it a robust choice. This can help identify the center of price action, which is useful for understanding whether prices are trending or ranging.
Trend Strength Assessment: The indicator goes beyond the standard Bollinger Bands by incorporating a measure of trend strength. It uses a robust rank-based correlation coefficient to assess the relationship between the price source and the bar index (time). This correlation coefficient, calculated over a specified length, helps determine whether a trend is strong, positive (uptrend), negative (down trend), or non-existent and weak. When the rank-based correlation coefficient shifts it indicates exhaustion of a prevailing trend. Trend Strength" indicator is designed to provide statistically valid information about trend strength while minimizing the impact of outliers and data distribution characteristics. The parameter choices, including a length of 14 and a correlation threshold of +/-0.7, considered to offer meaningful insights into market conditions and statistical validity (p-value ,0.05 statistically significant). The use of rank-based correlation is a robust alternative to traditional Pearson correlation, especially in the context of financial markets.
Trend Fill: Based on the robust rank-based correlation coefficient, the indicator fills the area between the upper and lower Bollinger Bands with different colors to visually represent the trend strength. For example, it may use green for an uptrend, red for a down trend, and a neutral color for a weak or ranging market. This visual representation can help traders quickly identify potential trend opportunities. In addition the middle line also informs about the overall trend direction of the median.

Cross Correlation [Kioseff Trading]Hello!
This script "Cross Correlation" calculates up to ~10,000 lag-symbol pair cross correlation values simultaneously!
Cross correlation calculation for 20 symbols simultaneously
+/- Lag Range is theoretically infinite (configurable min/max)
Practically, calculate up to 10000 lag-symbol pairs
Results can be sorted by greatest absolute difference or greatest sum
Ability to "isolate" the symbol on your chart and check for cross correlation against a list of symbols
Script defaults to stock pairs when on a stock, Forex pairs when on a Forex pair, crypto when on a crypto coin, futures when on a futures contract.
A custom symbol list can be used for cross correlation checking
Can check any number of available historical data points for cross correlation
Practical Assessment
Ideally, we can calculate cross correlation to determine if, in a list of assets, any of the assets frequently lead or lag one another.
Example
Say we are comparing the log returns for the previous 10 days for SPY and XLU.
*A single time-interval corresponds to the timeframe of your chart i.e. 1-minute chart = 1-minute time interval. We're using days for this example.
(Example Results)
A lag value (k) +/-3 is used.
The cross correlation (normalized) for k = +3 is -0.787
The cross correlation (normalized) for k = -3 is 0.216
A positive "k" value indicates the correlation when Asset A (SPY) leads Asset B (XLU)
A negative "k" value indicates the correlation when Asset B (XLU) leads Asset A (SPY)
A normalized cross correlation of -0.787 for k = +3 indicates an "adequately strong" negative relationship when SPY leads XLU by 3 days.
When SPY increases or decreases - XLU frequently moves in the opposite direction 3 days later.
A cross correlation value of 0.216 at k = −3 indicates a "weak" positive correlation when XLU leads SPY by 3 days.
There's a slight tendency for SPY to move in the same direction as XLU 3 days later.
After the cross-correlation score is normalized it will fall between -1 and 1.
A cross-correlation score of 1 indicates a perfect directional relationship between asset A and asset B at the corresponding lag (k).
A cross correlation of -1 indicates a perfect inverse relationship between asset A and asset B at the corresponding lag (k).
A cross correlation of 0 indicates no correlation at the corresponding lag (k).
The image above shows the primary usage for the script!
The image above further explains the data points located in the table!
The image above shows the script "isolating" the symbol on my chart and checking the cross correlation between the symbol and a list of symbols!
Wrapping Up
With this information, hopefully you can find some meaningful lead-lag relationships amongst assets!
Thank you for checking this out (:

Multi-Asset Performance [Spaghetti] - By LeviathanThis indicator visualizes the cumulative percentage changes or returns of 30 symbols over a given period and offers a unique set of tools and data analytics for deeper insight into the performance of different assets.
Multi Asset Performance indicator (also called “Spaghetti”) makes it easy to monitor the changes in Price, Open Interest, and On Balance Volume across multiple assets simultaneously, distinguish assets that are overperforming or underperforming, observe the relative strength of different assets or currencies, use it as a tool for identifying mean reversion opportunities and even for constructing pairs trading strategies, detect "risk-on" or "risk-off" periods, evaluate statistical relationships between assets through metrics like correlation and beta, construct hedging strategies, trade rotations and much more.
Start by selecting a time period (e.g., 1 DAY) to set the interval for when data is reset. This will provide insight into how price, open interest, and on-balance volume change over your chosen period. In the settings, asset selection is fully customizable, allowing you to create three groups of up to 30 tickers each. These tickers can be displayed in a variety of styles and colors. Additional script settings offer a range of options, including smoothing values with a Simple Moving Average (SMA), highlighting the top or bottom performers, plotting the group mean, applying heatmap/gradient coloring, generating a table with calculations like beta, correlation, and RSI, creating a profile to show asset distribution around the mean, and much more.
One of the most important script tools is the screener table, which can display:
🔸 Percentage Change (Represents the return or the percentage increase or decrease in Price/OI/OBV over the current selected period)
🔸 Beta (Represents the sensitivity or responsiveness of asset's returns to the returns of a benchmark/mean. A beta of 1 means the asset moves in tandem with the market. A beta greater than 1 indicates the asset is more volatile than the market, while a beta less than 1 indicates the asset is less volatile. For example, a beta of 1.5 means the asset typically moves 150% as much as the benchmark. If the benchmark goes up 1%, the asset is expected to go up 1.5%, and vice versa.)
🔸 Correlation (Describes the strength and direction of a linear relationship between the asset and the mean. Correlation coefficients range from -1 to +1. A correlation of +1 means that two variables are perfectly positively correlated; as one goes up, the other will go up in exact proportion. A correlation of -1 means they are perfectly negatively correlated; as one goes up, the other will go down in exact proportion. A correlation of 0 means that there is no linear relationship between the variables. For example, a correlation of 0.5 between Asset A and Asset B would suggest that when Asset A moves, Asset B tends to move in the same direction, but not perfectly in tandem.)
🔸 RSI (Measures the speed and change of price movements and is used to identify overbought or oversold conditions of each asset. The RSI ranges from 0 to 100 and is typically used with a time period of 14. Generally, an RSI above 70 indicates that an asset may be overbought, while RSI below 30 signals that an asset may be oversold.)
⚙️ Settings Overview:
◽️ Period
Periodic inputs (e.g. daily, monthly, etc.) determine when the values are reset to zero and begin accumulating again until the period is over. This visualizes the net change in the data over each period. The input "Visible Range" is auto-adjustable as it starts the accumulation at the leftmost bar on your chart, displaying the net change in your chart's visible range. There's also the "Timestamp" option, which allows you to select a specific point in time from where the values are accumulated. The timestamp anchor can be dragged to a desired bar via Tradingview's interactive option. Timestamp is particularly useful when looking for outperformers/underperformers after a market-wide move. The input positioned next to the period selection determines the timeframe on which the data is based. It's best to leave it at default (Chart Timeframe) unless you want to check the higher timeframe structure of the data.
◽️ Data
The first input in this section determines the data that will be displayed. You can choose between Price, OI, and OBV. The second input lets you select which one out of the three asset groups should be displayed. The symbols in the asset group can be modified in the bottom section of the indicator settings.
◽️ Appearance
You can choose to plot the data in the form of lines, circles, areas, and columns. The colors can be selected by choosing one of the six pre-prepared color palettes.
◽️ Labeling
This input allows you to show/hide the labels and select their appearance and size. You can choose between Label (colored pointed label), Label and Line (colored pointed label with a line that connects it to the plot), or Text Label (colored text).
◽️ Smoothing
If selected, this option will smooth the values using a Simple Moving Average (SMA) with a custom length. This is used to reduce noise and improve the visibility of plotted data.
◽️ Highlight
If selected, this option will highlight the top and bottom N (custom number) plots, while shading the others. This makes the symbols with extreme values stand out from the rest.
◽️ Group Mean
This input allows you to select the data that will be considered as the group mean. You can choose between Group Average (the average value of all assets in the group) or First Ticker (the value of the ticker that is positioned first on the group's list). The mean is then used in calculations such as correlation (as the second variable) and beta (as a benchmark). You can also choose to plot the mean by clicking on the checkbox.
◽️ Profile
If selected, the script will generate a vertical volume profile-like display with 10 zones/nodes, visualizing the distribution of assets below and above the mean. This makes it easy to see how many or what percentage of assets are outperforming or underperforming the mean.
◽️ Gradient
If selected, this option will color the plots with a gradient based on the proximity of the value to the upper extreme, zero, and lower extreme.
◽️ Table
This section includes several settings for the table's appearance and the data displayed in it. The "Reference Length" input determines the number of bars back that are used for calculating correlation and beta, while "RSI Length" determines the length used for calculating the Relative Strength Index. You can choose the data that should be displayed in the table by using the checkboxes.
◽️ Asset Groups
This section allows you to modify the symbols that have been selected to be a part of the 3 asset groups. If you want to change a symbol, you can simply click on the field and type the ticker of another one. You can also show/hide a specific asset by using the checkbox next to the field.

Advanced Weighted Residual Arbitrage AnalyzerThe Advanced Weighted Residual Arbitrage Analyzer is a sophisticated tool designed for traders aiming to exploit price deviations between various asset pairs. By examining the differences in normalized price relations and their weighted residuals, this indicator provides insights into potential arbitrage opportunities in the market.
Key Features:
Multiple Relation Analysis: Analyze up to five different asset relations simultaneously, offering a comprehensive view of potential arbitrage setups.
Normalization Functions: Choose from a variety of normalization techniques like SMA, EMA, WMA, and HMA to ensure accurate comparisons between different price series.
Dynamic Weighting: Residuals are weighted based on their correlation, ensuring that stronger correlations have a more pronounced impact on the analysis. Weighting can be adjusted using several functions including square, sigmoid, and logistic.
Regression Flexibility: Incorporate linear, polynomial, or robust regression to calculate residuals, tailoring the analysis to different market conditions.
Customizable Display: Decide which plots to display for clarity and focus, including normalized relations, weighted residuals, and the difference between the screen relation and the average weighted residual.
Usage Guidelines:
Configure the asset pairs you wish to analyze using the Symbol Relations group in the settings.
Adjust the normalization, volatility, regression, and weighting functions based on your preference and the specific characteristics of the asset pairs.
Monitor the weighted residuals for deviations from the mean. Larger deviations suggest stronger arbitrage opportunities.
Use the difference plot (between the screen relation and average weighted residual) as a quick visual cue for potential trade setups. When this plot deviates significantly from zero, it indicates a possible arbitrage opportunity.
Regularly update and adjust the parameters to account for changing market conditions and ensure the most accurate analysis.
In the Advanced Weighted Residual Arbitrage Analyzer , the value set in Alert Threshold plays a crucial role in delineating a normalized band. This band serves as a guide to identify significant deviations and potential trading opportunities.
When we observe the plots of the green line and the purple line, the Alert Threshold provides a boundary for these plots. The following points explain the significance:
Breach of the Band: When either the green or purple line crosses above or below the Alert Threshold , it indicates a significant deviation from the mean. This breach can be interpreted as a potential trading signal, suggesting a possible arbitrage opportunity.
Convergence to the Mean: If the green line converges with the purple line , it denotes that the price relation has reverted to its mean. This convergence typically suggests that the arbitrage opportunity has been exhausted, and the market dynamics are returning to equilibrium.
Trade Execution: A trader can consider entering a trade when the lines breach the Alert Threshold . The return of the green line to align closely with the purple line can be seen as a signal to exit the trade, capitalizing on the reversion to the mean.
By monitoring these plots in conjunction with the Alert Threshold , traders can gain insights into market imbalances and exploit potential arbitrage opportunities. The convergence and divergence of these lines, relative to the normalized band, serve as valuable visual cues for trade initiation and termination.
When you're analyzing relations between two symbols (for instance, BINANCE:SANDUSDT/BINANCE:NEARUSDT ), you're essentially looking at the price relationship between the two underlying assets. This relationship provides insights into potential imbalances between the assets, which arbitrage traders can exploit.
Breach of the Lower Band: If the purple line touches or crosses below the lower Alert Threshold , it indicates that the first symbol (in our example, SANDUSDT ) is undervalued relative to the second symbol ( NEARUSDT ). In practical terms:
Action: You would consider buying the first symbol ( SANDUSDT ) and selling the second symbol ( NEARUSDT ).
Rationale: The expectation is that the price of the first symbol will rise, or the price of the second symbol will fall, or both, thereby converging back to their historical mean relationship.
Breach of the Upper Band: Conversely, if the difference plot touches or crosses above the upper Alert Threshold , it suggests that the first symbol is overvalued compared to the second. This implies:
Action: You'd consider selling the first symbol ( SANDUSDT ) and buying the second symbol ( NEARUSDT ).
Rationale: The anticipation here is that the price of the first symbol will decrease, or the price of the second will increase, or both, bringing the relationship back to its historical average.
Convergence to the Mean: As mentioned earlier, when the green line aligns closely with the purple line, it's an indication that the assets have returned to their typical price relationship. This serves as a signal for traders to consider closing out their positions, locking in the gains from the arbitrage opportunity.
It's important to note that when you're trading based on symbol relations, you're essentially betting on the relative performance of the two assets. This strategy, often referred to as "pairs trading," seeks to capitalize on price imbalances between related financial instruments. By taking opposing positions in the two symbols, traders aim to profit from the eventual reversion of the price difference to the mean.

TTP Alt HedgeAlt hedge is a pine script that allows you to backtest and live hedge trade alt coin pairs.
Once you have selected 20 alt coins and your preferred take profit and a stop loss settings the script will find pairs: one coin that is very overbought and one that is very oversold. It will then long the one in discount and short the premium one.
The script will show you the PNL of the hedge combined position. If together they reach the TP or SL the position will be closed.
Use the "max profit retracement" to target larger TP levels and lock in profits if they retrace more than the chosen ratio. Example: if the TP retraces more than the golden ratio of 0.618 then close the position.
The indicator offers a table of profits with overall PNL and win rate stats.
It can be hooked up to WickHunter bots using alerts and the UUID of the bot.
Debug alerts shows the messages that will be sent for entry/exit deal messages.
Plot PNL shows the cumulative PNL in percentage in the same chart. This function is particularly useful since it shows the performance of the bot.
Each deal in this bot can consist of any pair of coins provided by the user. For example: long ADA + short ETH when ADA is very expensive and ETH is very cheap.
Consider using alt coins that have either strong or vey low correlation, the closer to 1 or -1 in correlation coefficient the better.
Have fun!

Price and Indicator CorrelationFIRST, CHANGE SOURCE OF INDICATOR FROM CLOSE TO WHATEVER INDICATOR YOU ARE COMPARING TO PRICE!!!!
Confirming Indicator Validity: By calculating the correlation coefficient between the price and a specific indicator, you can assess the degree to which the indicator and price move together. If there is a high positive correlation, it suggests that the indicator tends to move in the same direction as the price, increasing confidence in the indicator's validity. On the other hand, a low or negative correlation may indicate a weaker relationship between the indicator and price, signaling caution in relying solely on that indicator for trading decisions.
Identifying Divergence: Divergence occurs when the price and the indicator move in opposite directions. By monitoring the correlation coefficient, you can identify periods of divergence between the price and the selected indicator. Divergence may signal a potential reversal or significant price move, providing an opportunity to enter or exit trades.
Enhancing Trading Strategies: The correlation coefficient can be used to enhance trading strategies by incorporating the relationship between the price and the indicator. For example, if the correlation coefficient consistently shows a strong positive correlation, you may use the indicator as a confirmation tool for price-based trading signals. Conversely, if the correlation is consistently negative, it may indicate an inverse relationship that could be used for contrarian trading strategies.
Indicator Optimization : The correlation coefficient can help traders compare the effectiveness of different indicators. By calculating the correlation coefficient for multiple indicators against the price, you can identify which indicators have a stronger or weaker relationship with price movements. This information can guide the selection and optimization of indicators in your trading strategy.
Example:
Correlation for Major Markets This indicator plots the correlation of major markets as an indicator. The major markets covered are the following:
DXY
GC
CL
ES
RTY
ZN
The chart shows all the correlations and cross-correlations of the above instruments plotted together. The user can go in the settings and choose what correlation to see, or if multiple correlations, choose to plot the indicator a second time.
Linear Correlation Coefficient W/ MAs and Significance TestsThis Linear CC takes into account the log-normal distribution of stock prices and performs Pearson correlation on that data set. It also smoothens the results into an easy to read oscillator, and performs a two-tail t-test on the correlation coefficient data (with a = 0.05) to determine the significance of the coefficients. Significant results are shown in a solid yellow color while insignificant results are shown in a dark yellow color (you can eyeball this with a normal LCC by looking at results around -0.5 to +0.5).
Two MAs are provided as well for a quick trend analysis. You can reduce the lookback period, but it defaults to 31 for the sake of statistical standards.

CRYPTO DIVERGENCE FINDERThis indicator allows you to easily compare any ticker you're looking at with the ones I've found to work best over many years of studying the crypto market. For these reasons, the code of the script is hidden because that is exactly what makes it unique.
You can choose any cryptocurrency, but I recommend using only perpetuals on 'BINANCE' exchange.
If the comparison mode is enabled, the current ticker you are viewing is divided by the ticker selected in the indicator.
For example, if you are watching "SOLUSDT.P" you should open the settings of the indicator and write "SOLUSDT.P" in the ticker field. Then you will get the SOLUSDT.P correlation index with other crypto and currency pairs that are correlated (like I already said this is something that is product of many years of studying this market and this is exactly what is unique about the code so the source of the script have to stay protected).
If you are a beginer, you can just apply simple trend-breakout strategy after you spot the divergence.
For advanced traders, you can use this together with ICT's and SMC concepts as a confirmation upon your entry.

Correlation TrackerCorrelation Tracker Indicator
The Correlation Tracker indicator calculates and visualizes the correlation between two symbols on a chart. It helps traders and investors understand the relationship and strength of correlation between the selected symbol and another symbol of their choice.
Indicator Features:
- Correlation Calculation: The indicator calculates the correlation between two symbols based on the provided lookback period.
- Correlation Scale: The correlation value is normalized to a scale ranging from 0 to 1 for easy interpretation.
- Table Display: A table is displayed on the chart showing the correlation value and a descriptive label indicating the strength of the correlation.
- Customization Options: Users can customize the text color, table background color, and choose whether to display the Pearson correlation value.
- The Correlation Tracker indicator utilizes a logarithmic scale calculation, making it particularly suitable for longer timeframes such as weekly charts, thereby providing a more accurate and balanced measure of correlations across a wide range of values.
How to Use:
1. Select the symbol for which you want to track the correlation (default symbol is "SPX").
2. Adjust the lookback period to define the historical data range for correlation calculation.
3. Customize the text color and table background color according to your preference.
4. Choose whether to display the Pearson correlation value or a descriptive label for correlation strength.
5. Observe the correlation line on the chart, which changes color based on the strength of the correlation.
6. Refer to the correlation table for the exact correlation value or the descriptive label indicating the correlation strength.
Note: The indicator can be applied to any time frame chart and is not limited to logarithmic scale.

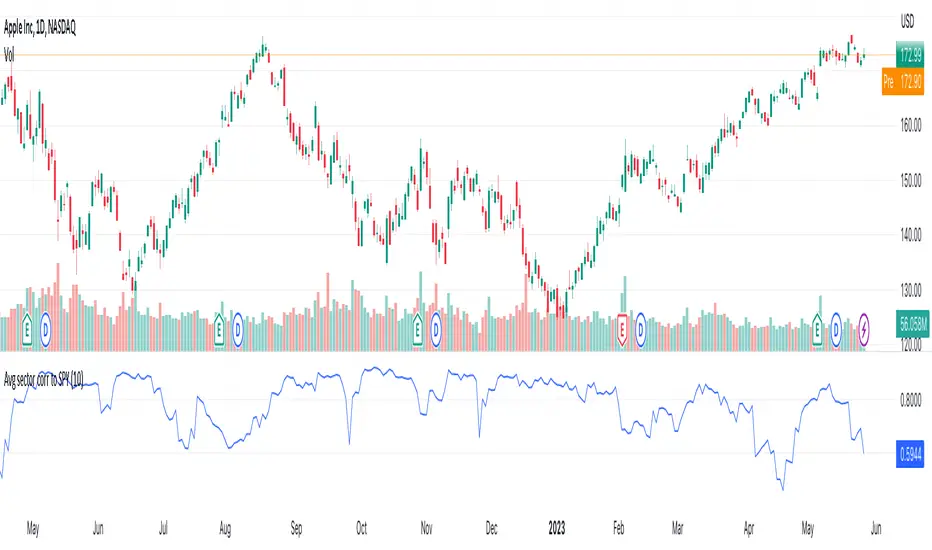
Average sector correlations to SPYHello Traders!
This is our latest addition to MFR TradingView account: Average sector correlations to SPY.
The Average Sector Correlation indicator is a powerful tool designed to give insights into the interconnectedness of different SPY sectors in relation to the SPY itself. As an introduction, know that this indicator presents the average correlation of all SPY sectors, serving as a barometer for overall market cohesion and relative performance.
At Myfractalrange, we monitor correlations extensively as we know they serve as warning for reversals, bullish rallies, bear market allies, etc.
Before going into how subscribers can use this script, let't have a look at the different data points:
In this script, we are calculating the average sector correlations to the SPY (S&P 500 ETF).
The following data points are used for the calculation:
- XLK: Technology Select Sector SPDR Fund
- XLE: Energy Select Sector SPDR Fund
- XLF: Financial Select Sector SPDR Fund
- XLU: Utilities Select Sector SPDR Fund
- XLV: Health Care Select Sector SPDR Fund
- XLP: Consumer Staples Select Sector SPDR Fund
- XLI: Industrial Select Sector SPDR Fund
- XLY: Consumer Discretionary Select Sector SPDR Fund
- XLC: Communication Services Select Sector SPDR Fund
- XLRE: Real Estate Select Sector SPDR Fund
- XLB: Materials Select Sector SPDR Fund
These data points represent different sectors of the stock market.
The user can modify the "period" variable to specify the lookback period for calculating the correlation.
By changing the value of "Period," the user can adjust the number of historical data points used in the correlation calculation. Default value is 10 days.
How does the script work?
The script uses the ta.correlation function from TradingView's Pine Script to calculate the correlation between the daily returns of each sector ETF and the SPY. The daily return is calculated as the percentage change in price from the previous day.
The correlation calculation is performed for each sector ETF and the SPY, using the specified lookback period. The correlations are then averaged to obtain the average sector correlation to the SPY.
The resulting average sector correlation is plotted on the chart using a blue line.
How to use correlations when trading?
This script can be used to assess the overall market sentiment by measuring the average sector correlation to the SPY. When the average sector correlation is positive, it indicates that the sectors are generally moving in the same direction as the broader market (SPY). This suggests a strong market trend.
Traders can use this information to make informed trading decisions. For example, if the average sector correlation is strongly positive, it may be a signal to consider bullish positions in individual stocks or ETFs from sectors with high positive correlations. Conversely, if the average sector correlation is negative or weak, it may indicate a lack of market direction or potential sector rotation, requiring caution in trading decisions.
Furthermore, when correlation values are high and growing, it may signify a build-up of risk, suggesting that the sectors are moving in tandem due to widespread market forces. This can often be a signal of broader market participants chasing trends or reacting to panic. Therefore, this indicator can serve as a valuable tool for traders and investors who want to understand market sentiment and systemic risk at a glance.
The Average Sector Correlation indicator also provides the capability to monitor average correlations across multiple timeframes concurrently. This feature allows users to track the fluctuations of sector correlations over short, medium, and long-term periods, all simultaneously.
This function offers a more comprehensive view of the market dynamics and can alert users to changes in correlation patterns over various time horizons. Thus, users can gain insights into the immediate temperament of the market while also maintaining awareness of larger trends that may be forming or diminishing over extended periods. It presents a holistic image of market behaviour, enhancing the user's decision-making process.
Why use Correlations in combination with other indicators?
To enhance trading strategies, this script can be used in combination with other technical indicators or signals. By incorporating additional indicators such as moving averages, trend lines, or oscillators, traders can build a comprehensive trading system.
For example, traders can use the average sector correlation as a confirmation signal for other technical analysis tools. If a bullish signal is generated by another indicator, such as a moving average crossover or a breakout, the positive average sector correlation can provide additional confidence to enter or hold a long position.
Conversely, if a bearish signal is generated by another indicator, a negative average sector correlation can act as a confirmation signal to consider short positions or reduce exposure to sectors with low or negative correlations.
By combining multiple signals and indicators, traders can develop a well-rounded trading strategy that incorporates market breadth (sector correlations) along with other technical factors to increase the probability of successful trades.
It's important to note that while Correlations are a useful tool, it should not be relied upon solely for making trading decisions. It's recommended to use it in conjunction with other technical analysis tools and consider other factors such as Trend, market conditions, risk management, and fundamental analysis.
We hope that you will find these explanations useful.
Enjoy!
DISCLAIMER: No sharing, copying, reselling, modifying, or any other forms of use are authorised. This script is strictly for individual use and educational purposes only. This is not financial or investment advice. Investments are always made at your own risk and are based on your personal judgement. Myfractalrange is not responsible for any losses you may incur. Please invest wisely.
Source CorrelationIn this small indicator I make it possible for the user to set two different input sources. Then, the indicator displays the correlation of these two input sources. It's a very small script, but I think it could be helpful to somebody to find uncorrelated indicators for his trading strategy. To use uncorrelated indicators is in general recommended.
Enjoy this small, but powerful tool. 🧙♂️
