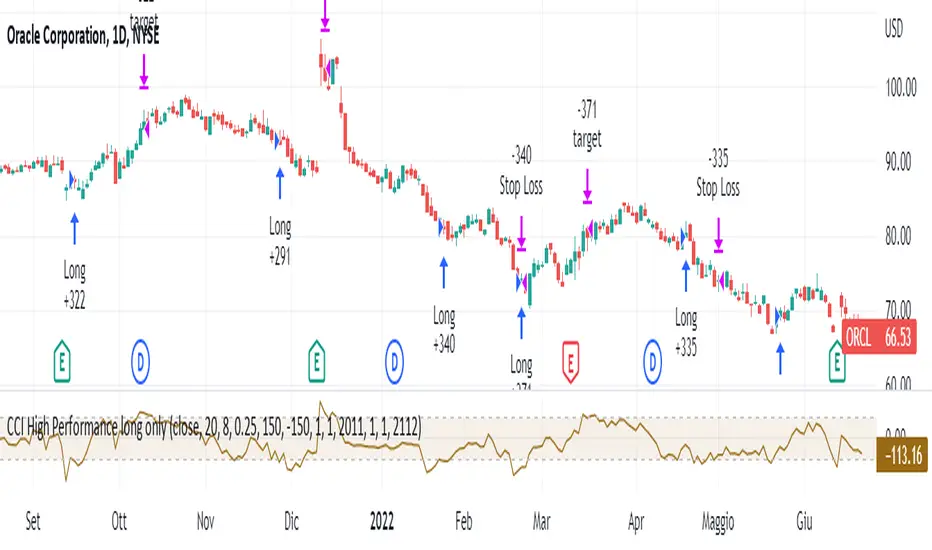
CCI High Performance long onlyThis strategy is based on the classic Commodity Channel Index and only works long.
The system enters the market when this indicator is very low ( CCI <-150 or user-defined threshold) and as soon as it regains strength (i.e. CCI> CCI of the previous candle) with a filter on the "strength" of the prices themselves (i.e. the closing of the candle that provides the signal must be higher than a certain difference - fixed at 0.25% - at the opening of the candle itself).
You exit the market when you either incur a stop loss or when the prices are above the upper band of the CCI.
This system is used to have a high number of profitable operations (well over 50%) with little effort in terms of number of bars, rather than wanting to capture the actual duration of a trend. It is therefore recommended for those who "suffer to see the potential losses".
Wskaźnik impetu (CCI)
CCI and ADX_by RMCCI and ADX
ENTRY:
Buy: When CCI crosses -100 level from -200 level(1hr/15min Time Frame)
Short: When CCI crosses 100 level from 200 level (1hr/15min Time Frame)
Closing of Position : 1:1 OR 1:2 (Or As per Value Zone)

Cyatophilum 3Commas DCA Bot BacktesterAn indicator to backtest and automate 3Commas DCA Bots.
═════════════════════════════════════════════════════════════════════════
█ HOW IT WORKS
The indicator allows you to replicate your bot settings and get backtest results from the Strategy Tester and also a backtest panel with additional information on the safety orders.
You can also create alerts for each of the strategy events.
█ HOW TO USE
Choose a symbol that corresponds to your bot pair and exchange.
Pick a chart time frame as small as possible, usually 1 minute. The timeframe should always be smaller or equal to the deal start conditions timeframes.
Always use regular candle type.
Configure your deal start condition . You can combine several technical indicators to trigger an entry using a AND logical gate.
Configure your profit target
Use the Take Profit feature to set a target in percentage of price. You can also make it trail.
There is also a Stop Loss feature that is turned off by default.
Configure your safety orders
Replicate the safety orders from your bot into the indicator inputs.
Check your backtest parameters
Make sure that the initial capital and order size make sense. Since it is a pyramiding strategy with safety orders, the sum of all deals should not be bigger than the initial capital.
In this example: Initial capital is 0.02 BTC, which around 600$. I used 1000$ to be safe.
If you use % equity as order size, please note that it will create compounding.
Check the fees, by default they are set to 0.1%.
I also recommend to set a slippage that corresponds to your exchange's spread.
█ FEATURES
• Strategy direction
Configure wether to go long or short.
• Deal Start Conditions
The current conditions available are:
- Up to 4 MTF Trading View ratings conditions (Buy/Sell, Strong Buy/Sell)
- Up to 4 MTF RSI with configurable start conditions (Less/Greater than, Crossing Up/Down)
- Up to 2 MTF Ultimate Oscillator with configurable start conditions (Less/Greater than, Crossing Up/Down)
- MTF BB%-20-1 (length-deviation) with configurable start conditions (Less/Greater than, Crossing Up/Down)
- MTF BB%-20-2 (length-deviation) with configurable start conditions (Less/Greater than, Crossing Up/Down)
- Up to 2 MTF TA presets with the following options (Bollinger Bands, MFI, CCI, MACD, PSAR, SMA crosses, Heikin Ashi)
• Stop Loss and Take Profit
Configure your stop loss and take profit for long and short trades.
You can also make a trailing take profit.
• DCA (Safety orders)
Create up to 100 safety orders with configurable options for step and volume scaling, take profit from total volume, base and safety order size.
• Backtest Settings
Choose a backtest period, longs or shorts, wether to use limit orders or not.
Graphics
A Configuration panel with all the indicator settings, useful for sharing/saving a strategy.
A Backtest Results panel with additional information from the strategy tester.
█ ALERTS
The indicator is using the alert() calls: it only uses 1 alert slot to send order messages for each event (Long/Short entry, stop loss, take profit, safety order). This means free TV plans can create 1 complete strategy.
To set your alert messages, open the indicator settings and scroll to the bottom of the "inputs" tab.
Create your alert after you set the messages in the indicator settings, and make sure "Any alert() function call" is set in the alert option.
█ BACKTEST RESULTS
The backtest settings used in this snapshot are the following:
Initial Capital: 1000€
Order size: 0.003 BTC
Commission: 0.1 % per order
Slippage : 1 tick
Please read the author instructions below for access.

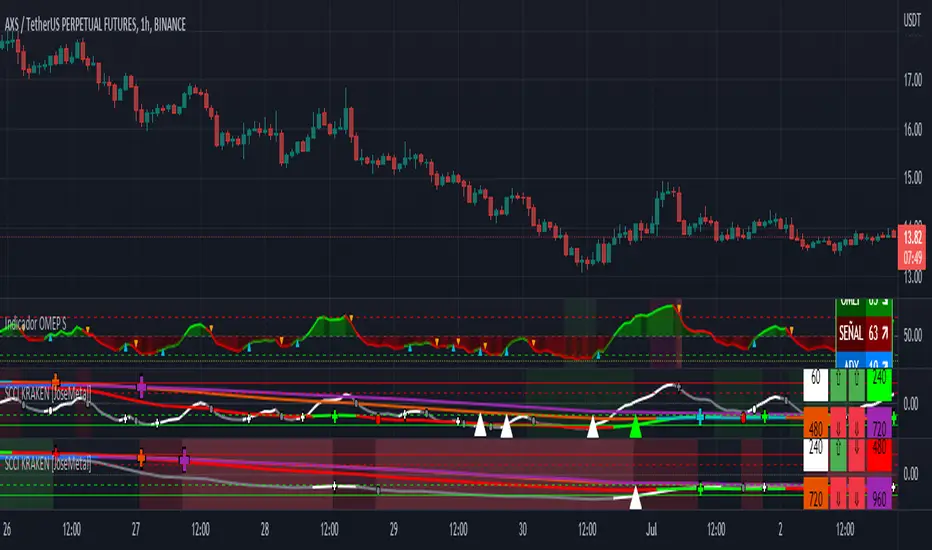
SCCI KRAKEN [JoseMetal]============
ENGLISH
============
- Description:
This indicator is a Smoothed Commodity Channel Index with crosses with a signal SMA.
It combines 4 different and configurable timeframes to find dips and tops.
It has several configurable timeframe combinations, so you don't have to reconfigure the indicator on each timeframe, you can have a preset for your favorite timeframes, anyway, default ones are already coded in.
The SMAs are not visible to avoid too many lines confusion, but there're signals on each cross.
- Visual:
So you have 4 lines, 1 for each timeframe, when the SCCI is increasing it takes a bullish color, bearish color if going down.
You can customize 2 color setups, simple and multicolor, in both cases you can configure every single color, the main difference is that using "simple" just shows the same bullish/bearish color for each line but multicolor allows to setup different colors for EACH line/timeframe.
Crossover/under symbol changes depending on strength zone, a crossover on oversold area (bottom/green) triggers a cross, as well as a cross under in the overbought area (top/red), dots are shown when the zones are inverted.
Background color changes when all the lines/timeframes are in the same area, for example, if all 4 lines are below 0 it starts getting green (oversold), while over 0 it gets red (overbought), extreme levels gets lighter.
- Customization:
As usual in my indicators, everything is customizable, periods for de CCI, smoothness for it, the SMA periods, colors, timeframe setups...
The oversold and overbought areas are also customizable, being able to set zones for each.
The indicator has an option to show a different asset, because some testers asked me to add this in order to COMPARE directly against another asset, for example, you can have the same indicator for your current asset (let's say ETH) and another SCCI Kraken showing BTC, doing this allows to check if the asset is more bullish/bearish compared to another asset.
- Usage and recommendations:
Everything is good by default, of you want more accurate crosses you can increase the SMA periods a little, 6-8 instead of 4.
For scalping maybe a good idea to reduce the strong areas and get more signals, anyway i use it as default.
Finally, if you want to find an excellent dip/top increase the distance between timeframes in your setup, for example, go to 1 min and set the other timeframes to 15M, 1H and 4H, you'll get fewer signals but veeery accurate (fewer trades, more precision).
============
ESPAÑOL
============
- Descripción:
Este indicador es un índice de canal de materias primas suavizado con cruces con una señal SMA.
Combina 4 marcos temporales diferentes y configurables para encontrar dips y tops.
Tiene varias combinaciones de marcos temporales configurables, por lo que no tiene que reconfigurar el indicador en cada marco temporal, puede tener un preset para sus marcos temporales favoritos, de todos modos, los predeterminados ya están codificados.
Las SMAs no son visibles para evitar la confusión de demasiadas líneas, pero hay señales en cada cruce.
- Visual:
Así que tienes 4 líneas, 1 para cada temporalidad, cuando el SCCI está aumentando toma un color alcista, color bajista si va hacia abajo.
Puedes personalizar 2 configuraciones de color, simple y multicolor, en ambos casos puedes configurar cada color, la principal diferencia es que usando "simple" solo muestra el mismo color alcista/bajista para cada línea pero multicolor permite configurar diferentes colores para CADA línea/marco de tiempo.
El símbolo de cruce/bajo cambia dependiendo de la zona de fuerza, un cruce en la zona de sobreventa (abajo/verde) provoca un cruce, así como un cruce bajo en la zona de sobrecompra (arriba/rojo), los puntos se muestran cuando las zonas están invertidas.
El color del fondo cambia cuando todas las líneas/marcos de tiempo están en la misma zona, por ejemplo, si las 4 líneas están por debajo de 0 empieza a ponerse verde (sobreventa), mientras que por encima de 0 se pone rojo (sobrecompra), los niveles extremos se ponen más claros.
- Personalización:
Como es habitual en mis indicadores, todo es personalizable, los periodos del CCI, la suavidad del mismo, los periodos de las SMA, los colores, las configuraciones de los marcos temporales...
Las zonas de sobreventa y sobrecompra también son personalizables, pudiendo establecer zonas para cada una de ellas.
El indicador tiene una opción para mostrar un activo diferente, ya que algunos testers me pidieron que añadiera esto para poder COMPARAR directamente contra otro activo, por ejemplo, puedes tener el mismo indicador para tu activo actual (digamos ETH) y otro SCCI Kraken mostrando BTC, haciendo esto permite comprobar si el activo es más alcista/bajista comparado con otro activo.
- Uso y recomendaciones:
Todo está bien por defecto, de querer cruces más precisos se pueden aumentar un poco los periodos de la SMA, 6-8 en vez de 4.
Para scalping quizás sea una buena idea reducir las zonas fuertes y obtener más señales, de todas formas yo lo uso por defecto.
Por último, si quieres encontrar un excelente dip/top aumenta la distancia entre los marcos de tiempo en tu configuración, por ejemplo, ve a 1 min y pon los otros marcos de tiempo a 15M, 1H y 4H, obtendrás menos señales pero muy precisas (menos operaciones, más precisión).
Real Woodies CCIAs always, this is not financial advice and use at your own risk. Trading is risky and can cost you significant sums of money if you are not careful. Make sure you always have a proper entry and exit plan that includes defining your risk before you enter a trade.
Ken Wood is a semi-famous trader that grew in popularity in the 1990s and early 2000s due to the establishment of one of the earliest trading forums online. This forum grew into "Woodie's CCI Club" due to Wood's love of his modified Commodity Channel Index (CCI) that he used extensively. From what I can tell, the website is still active and still follows the same core principles it did in the early days, the CCI is used for entries, range bars are used to help trader's cut down on the noise, and the optional addition of Woodie's Pivot Points can be used as further confirmation of support and resistance. This is my take on his famous "Woodie's CCI" that has become standard on many charting packages through the years, including a TradingView sponsored version as one of the many stock indicators provided by TradingView. Woodie has updated his CCI through the years to include several very cool additions outside of the standard CCI. I will have to say, I am a bit biased, but I think this is hands down one of the best indicators I have ever used, and I am far too young to have been part of the original CCI Club. Being a daytrader primarily, this fits right in my timeframe wheel house. Woodie designed this indicator to work on a day-trading time scale and he frequently uses this to trade futures and commodity contracts on the 30 minute, often even down to the one minute timeframe. This makes it unique in that it is probably one of the only daytrading-designed indicators out there that I am aware of that was not a popular indicator, like the MACD or RSI, that was just adopted by daytraders.
The CCI was originally created by Donald Lambert in 1980. Over time, it has become an extremely popular house-hold indicator, like the Stochastics, RSI, or MACD. However, like the RSI and Stochastics, there are extensive debates on how the CCI is actually meant to be used. Some trade it like a reversal indicator, where values greater than 100 or less than -100 are considered overbought or oversold, respectively. Others trade it like a typical zero-line cross indicator, where once the value goes above or below the zero-line, a trade should be considered in that direction. Lastly, some treat it as strictly a momentum indicator, where values greater than 100 or less than -100 are seen as strong momentum moves and when these values are reached, a new strong trend is establishing in the direction of the move. The CCI itself is nothing fancy, it just visualizes the distance of the closing price away from a user-defined SMA value and plots it as a line. However, Woodie's CCI takes this simple concept and adds to it with an indicator with 5 pieces to it designed to help the trader enter into the highest probability setups. Bear with me, it initially looks super complicated, but I promise it is pretty straight-forward and a fun indicator to use.
1) The CCI Histogram. This is your standard CCI value that you would find on the normal CCI. Woodie's CCI uses a value of 14 for most trades and a value of 20 when the timeframe is equal to or greater than 30minutes. I personally use this as a 20-period CCI on all time frames, simply for the fact that the 20 SMA is a very popular moving average and I want to know what the crowd is doing. This is your coloured histogram with 4 colours. A gray colouring is for any bars above or below the zero line for 1-4 bars. A yellow bar is a "trend bar", where the long period CCI has been above/below the zero line for 5 consecutive bars, indicating that a trend in the current direction has been established. Blue bars above and red bars below are simply 6+n number of bars above or below the zero line confirming trend. These are used for the Zero-Line Reject Trade (explained below). The CCI Histogram has a matching long-period CCI line that is painted the same colour as the histogram, it is the same thing but is used just to outline the Histogram a bit better.
2) The CCI Turbo line. This is a sped-up 6 period CCI. This is to be used for the Zero-Line Reject trades, trendline breaks, and to identify shorter term overbought/oversold conditions against the main trend. This is coloured as the white line.
3) The Least Squares Moving Average Baseline (LSMA) Zero Line. You will notice that the Zero Line of the indicator is either green or red. This is based on when price is above or below the 25-period LSMA on the chart. The LSMA is a 25 period linear regression moving average and is one of the best moving averages out there because it is more immune to noise than a typical MA. Statistically, an LSMA is designed to find the line of best fit across the lookback periods and identify whether price is advancing, declining, or flat, without the whipsaw that other MAs can be privy to. The zero line of the indicator will turn green when the close candle is over the LSMA or red when it is below the LSMA. This is meant to be a confirmation tool only and the CCI Histogram and Turbo Histogram can cross this zero line without any corresponding change in the colour of the zero line on that immediate candle.
4) The +100 and -100 lines are used in two ways. First, they can be used by the CCI Histogram and CCI Turbo as a sort of minor price resistance and if the CCI values cannot get through these, it is considered weakness in that trade direction until they do so. You will notice that both of these lines are multi-coloured. They have been plotted with the ChopZone Indicator, another TradingView built-in indicator. The ChopZone is a trend identification tool that uses the slope and the direction of a 34-period EMA to identify when price is trending or range bound. While there are ~10 different colours, the main two a trader needs to pay attention to are the turquoise/cyan blue, which indicates price is in an uptrend, and dark red, which indicates price is in a downtrend based on the slope and direction of the 34 EMA. All other colours indicate "chop". These colours are used solely for the Zero-Line Reject and pattern trades discussed below. They are plotted both above and below so you can easily see the colouring no matter what side of the zero line the CCI is on.
5) The +200 and -200 lines are also used in two ways. First, they are considered overbought/oversold levels where if price exceeds these lines then it has moved an extreme amount away from the average and is likely to experience a pullback shortly. This is more useful for the CCI Histogram than the Turbo CCI, in all honesty. You will also notice that these are coloured either red, green, or yellow. This is the Sidewinder indicator portion. The documentation on this is extremely sparse, only pointing to a "relationship between the LSMA and the 34 EMA" (see here: tlc.thinkorswim.com). Since I am not a member of Woodie's CCI Club and never intend to be I took some liberty here and decided that the most likely relationship here was the slope of both moving averages. Therefore, the Sidewinder will be green when both the LSMA and the 34 EMA are rising, red when both are falling, and yellow when they are not in agreement with one another (i.e. one rising/flat while the other is flat/falling). I am a big fan of Dr. Alexander Elder as those who follow me know, so consider this like Woodie's version of the Elder Impulse System. I will fully admit that this version of the Sidewinder is a guess and may not represent the real Sidewinder indicator, but it is next to impossible to find any information on this, so I apologize, but my version does do something useful anyways. This is also to be used only with the Zero-Line Reject trades. They are plotted both above and below so you can easily see the colouring no matter what side of the zero line the CCI is on.
How to Trade It According to Woodie's CCI Club:
Now that I have all of my components and history out of the way, this is what you all care about. I will only provide a brief overview of the trades in this system, but there are quite a few more detailed descriptions listed in the Woodie's CCI Club pamphlet. I have had little success trading the "patterns" but they do exist and do work on occasion. I just prefer to trade with the flow of the markets rather than getting overly scalpy. If you are interested in these patterns, see the pamphlet here (www.trading-attitude.com), hop into the forums and see for yourself, or check out a couple of the YouTube videos.
1) Zero line cross. As simple as any other momentum oscillator out there. When the long period CCI crosses above or below the zero line open a trade in that direction. Extra confirmation can be had when the CCI Turbo has already broken the +100/-100 line "resistance or support". Trend traders may wish to wait until the yellow "trend confirmation bar" has been printed.
2) Zero Line Reject. This is when the CCI Turbo heads back down to the zero line and then bounces back in the same direction of the prevailing trend. These are fantastic continuation trades if you missed the initial entry either on the zero line cross or on the trend bar establishment. ZLR trades are only viable when you have the ChopZone indicator showing a trend (turquoise/cyan for uptrend, dark red for downtrend), the LSMA line is green for an uptrend or red for a downtrend, and the SideWinder is either green confirming the uptrend or red confirming the downtrend.
3) Hook From Extreme. This is the exact same as the Zero Line Reject trade, however, the CCI Turbo now goes to the +100/-100 line (whichever is opposite the currently established trend) and then hooks back into the established trend direction. Ideally the HFE trade needs to have the Long CCI Histogram above/below the corresponding 100 level and the CCI Turbo both breaks the 100 level on the trend side and when it does break it has increased ~20 points from the previous value (i.e. CCI Histogram = +150 with LSMA, CZ, and SW all matching up and trend bars printed on CCI Histogram, CCI Turbo went to -120 and bounced to +80 on last 2 bars, current bar closes with CCI Turbo closing at +110).
4) Trend Line Break. Either the CCI Turbo or CCI Histogram, whichever you prefer (I find the Turbo a bit more accurate since its a faster value) creates a series of higher highs/lows you can draw a trend line linking them. When the line breaks the trendline that is your signal to take a counter trade position. For example, if the CCI Turbo is making consistently higher lows and then breaks the trendline through the zero line, you can then go short. This is a good continuation trade.
5) The Tony Trade. Consider this like a combination zero line reject, trend line break, and weak zero line cross all in one. The idea is that the SW, CZ, and LSMA values are all established in one direction. The CCI Histogram should be in an established trend and then cross the zero line but never break the 100 level on the new side as long as it has not printed more than 9 bars on the new side. If the CCI Histogram prints 9 or less bars on the new side and then breaks the trendline and crosses back to the original trend side, that is your signal to take a reversal trade. This is best used in the Elder Triple Screen method (discussed in final section) as a failed dip or rip.
6) The GB100 Trade. This is a similar trade as the Tony Trade, however, the CCI Histogram can break the 100 level on the new side but has to have made less than 6 bars on the new side. A trendline break is not necessary here either, it is more of a "pop and drop" or "momentum failure" trade trying in the new direction.
7) The Famir Trade. This is a failed CCI Long Histogram ZLR trade and is quite complicated. I have never traded this but it is in the pamphlet. Essentially you have a typical ZLR reject (i.e. all components saying it is likely a long/short continuation trade), but the ZLR only stays around the 50 level, goes back to the trend side, fails there as well immediately after 1 bar and then rebreaks to the new side. This is important to be considered with the LSMA value matching the side of the trade, so if the Famir says to go long, you need the LSMA indicator to also say to go long.
8) The Vegas Trade. This is essentially a trend-reversal trade that takes into account the LSMA and a cup and handle formation on the CCI Long Histogram after it has reached an extreme value (+200/-200). You will see the CCI Histogram hit the extreme value, head towards the zero line, and then sort of round out back in the direction of the extreme price. The low point where it reversed back in the direction of the extreme can be considered support or resistance on the CCI and once the CCI Long Histogram breaks this level again, with LSMA confirmation, you can take a counter trend trade with a stop under/over the highest/lowest point of the last 2 bars as you want to be out quickly if you are wrong without much damage but can get a huge win if you are right and add later to the position once a new trade has formed.
9) The Ghost Trade. This is nothing more than a(n) (inverse) head and shoulders pattern created on the CCI. Draw a trend line connecting the head and shoulders and trade a reversal trade once the CCI Long Histogram breaks the trend line. Same deal as the Vegas Trade, stop over/under the most recent 2 bar high/low and add later if it is a winner but cut quickly if it is a loser.
Like I said, this is a complicated system and could quite literally take years to master if you wanted to go into the patterns and master them. I prefer to trade it in a much simpler format, using the Elder Triple Screen System. First, since I am a day trader, I look to use the 20 period Woodie's on the hourly and look at the CZ, SW, and LSMA values to make sure they all match the direction of the CCI Long Histogram (a trend establishment is not necessary here). It shows you the hourly trend as your "tide". I then drill down to the 15 minute time frame and use the Turbo CCI break in the opposite direction of the trend as my "wave" and to indicate when there is a dip or rip against the main trend. Lastly, I drill down to a 3 minute time frame and enter when the CCI Long Histogram turns back to match the main trend ("ripple") as long as the CCI Turbo has broken the 100 level in the matched direction.
Enjoy, and please read the pamphlet if you have any questions about the patterns as they are not how I use these and will not be able to answer those questions.

CCI SupertrendCCI Supertrend
+ This simple scripts base on CCI level to plot "Supertrend".
+ When CCI move above level 0, SuperTrend lowerBand is plotted.
+ When CCI move below level 0, SuperTrend upperBand is plotted.

SuperJump Edge CCI RSIThis indicator for detecting inflection points of CCI and RSI.
Low time frames have high variability, which can lead to more unreliable signals.
But you can filter it appropriately by entering the levels of oversold and overbought.
Because CCI is highly volatile, RSI signals are more reliable.
You can also use it for other panes for example RSI or CCI pane.
Repainting is not used because I implemented the filter by myself.

CCI MTF Ob+OsHello Traders,
This is a simple Commodity Channel Index (CCI) indicator with multi-timeframe (MTF) overbought and oversold level.
It can detect overbought and oversold level up to 5 timeframes, which help traders spot potential reversal point more easily.
There are options to select 1-5 timeframes to detect overbought and oversold.
Green Background is "Oversold" , looking for "Long".
Red Background is "Overbought" , looking for "Short".
Have fun :)

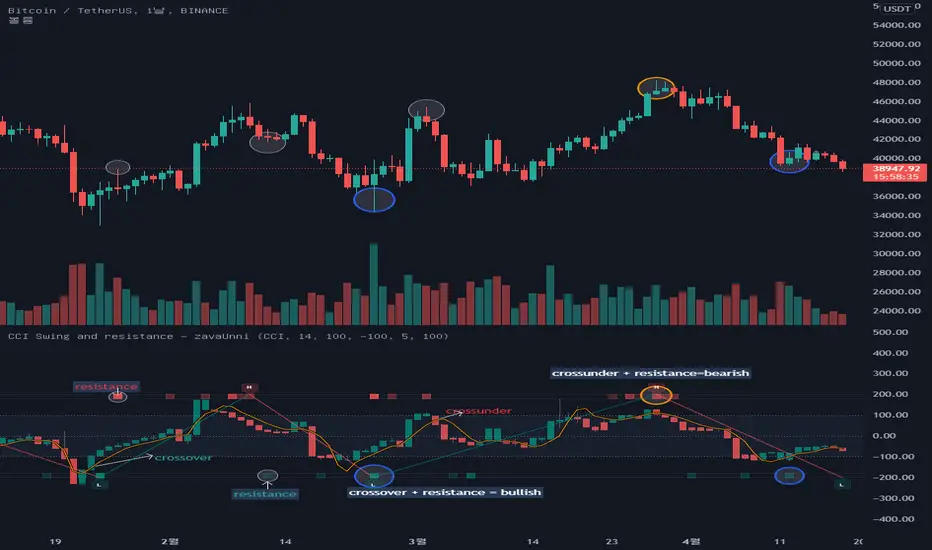
CCI Swing and resistance [zavaUnni] The candles you see on this indicator is the value open price, closing price, high, and low is converted to a selected index value.
Select from selectable settings: rsi , cci , mfi , or stochstic
The default indicator is set to cci .
O_ = ta. cci (open,i_length)
H_ = ta. cci (high,i_length)
L_ = ta. cci (low,i_length)
C_ = ta. cci (close,i_length)
Like the close, open, high, low price, the MA value is converted to the selected index and displayed as a yellow line
short_A = ta. sma (close, short_lenA)
short = ta. cci (short_A,i_length2)
The MA length can be converted from the set value and is defaulted to 5 days.
If C_ is above short, it looks like a teal color, and if C_ is below, it looks like a red color.
-High and low -
When the selected index reaches the oversold value, it finds a high value, and when it reaches the oversold value, it finds a low value.
Oversold and overbought values can be changed in the setting, and the default setting is 100 and -100.
The default setting is recommended unless otherwise noted.
The method of finding the low value is to find the lowest value (var) when the index crosses from 100 to reach -100, until it rises to 100.
The same is true of finding high values.
It was marked with a teal color when going from oversold to oversold, and red color when going down from oversold to oversold.
-os, ob and resistances-
The bar at the top and bottom of the index shows resistance, over-buying, and over-selling values
Over-buying and over-selling values are hidden, so you can change them to be seen if necessary.
1. The volume is large, but if the change rate of candlestic(spred_rate) is not large, resistance has occurred.
2. If thespred_rate is excessively large compared to the volume , oversold or oversold occurs.
Based on the above two basic theories, we created the following formula to derive the strength of the resistance.
Resistance Index = spred_rate / volume
We find the average value of the resistance Index,
If the spred_rate is higher than the predicted value, it is oversold or oversold.
If the spred_rate value is lower than the predicted value, the resistance was derived as the issuance signal.
The larger the deviation from the predicted value, the higher the saturation.
The presence of bright red can be seen as a result of greater resistance.
The same goes for over-buying and over-selling prices
The brighter the gray, the more spread without trading volume , and it can be judged that it is not a true bull or a true bear.
resistances and divergence[zavaUnni]
Select from selectable settings: rsi, cci, mfi, or stochstic
The default indicator is set to cci.
When you select an indicator in Settings, you can see the diversity that occurs in that indicator.
Resistance fills the histogram in yellow; the stronger the resistance, the higher the saturation.
If the volume is large but the change rate of candlestic(spred_rate) is not large, it means resistance has occurred.
It is a method of finding anomalies in the spred_rate and volume relationship.
After obtaining the accumulated spred_raterelative to the accumulatedvolume value,
we calculated that the larger the difference is, the larger the resistance value.
The formula with the resistanc
a_sma = ta.cum(spred_rate)/ta.cum(volume)
ifpricebull = open+(open*a_sma * volume)
ifpricebear = open-(open*a_sma * volume)
bullD = close>ifpricebull or closeifpricebull or close

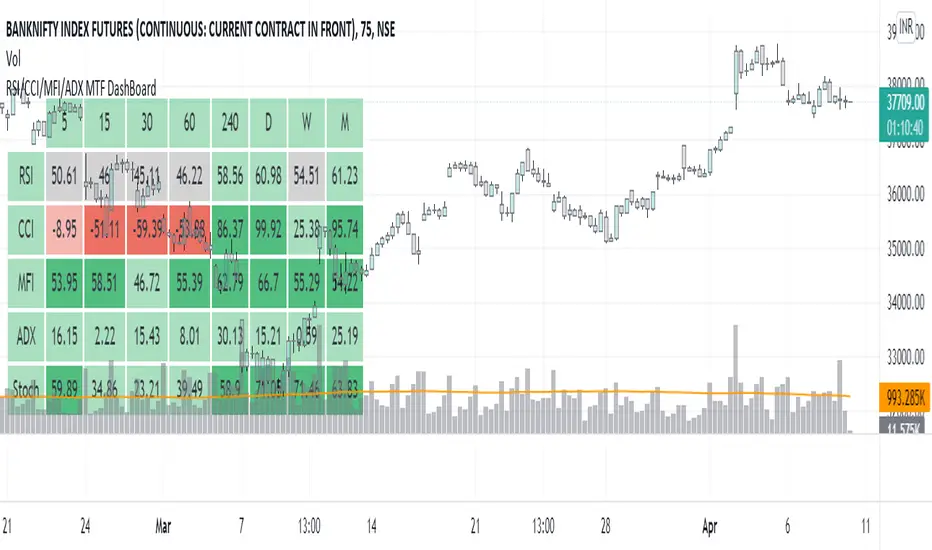
RSI/CCI/MFI/ADX/Stoch MTF DashBoardGauge Sentiment across timeframe for various indicators in single dashboard.
RSI - to get the idea about relative price strength across all TFs.
CCI /ADX- to get idea about power and strength in trend across all TFs.
MFI- gives idea whether trend is supported by volume or not across all TFs.
with this dashboard , you will get complete sentiment of market on your screen whether you use lower to upper TF or upper to lower TF approach. you can see market behavior and sentiment with these all in one dashboard across all TFs.
Better use this with MA or vwap to get trend direction.
Added feature to change location of dashboard on chart, now you can place it on top left, top right, bottom left, bottom right corner of chart as per your comfort.
2. Added ability to hide/show for all TFs.
Now you can on/off , 5min, 15 min, 30 min, 60 min, 4 hour, daily ,weekly and monthly TF column if you do not use it. you can keep and work with TFs as per your comfort and liking.
3. Added feature to hide/show indicators, MFI, CCI, ADX.
Now you can on/off indicator s MFI, CCI and ADX if you don't need them on dashboard as per your need.
Made dashboard cell width and height auto adjusted, so that it values can be visible fully on TV app on mobile too.
Hope it provides a better visual experience to read data on dashboard.
4. Added Stochastic as indicator to dashboard. STOCH is a range bound momentum oscillator. It is designed to display the location of the close compared to the high/low range over a user defined number of periods. You can use STOCH for Identifying overbought and oversold levels and also for identifying bull and bear set ups or signals across all TFs.
Hope IT helps to take better trading decisions.
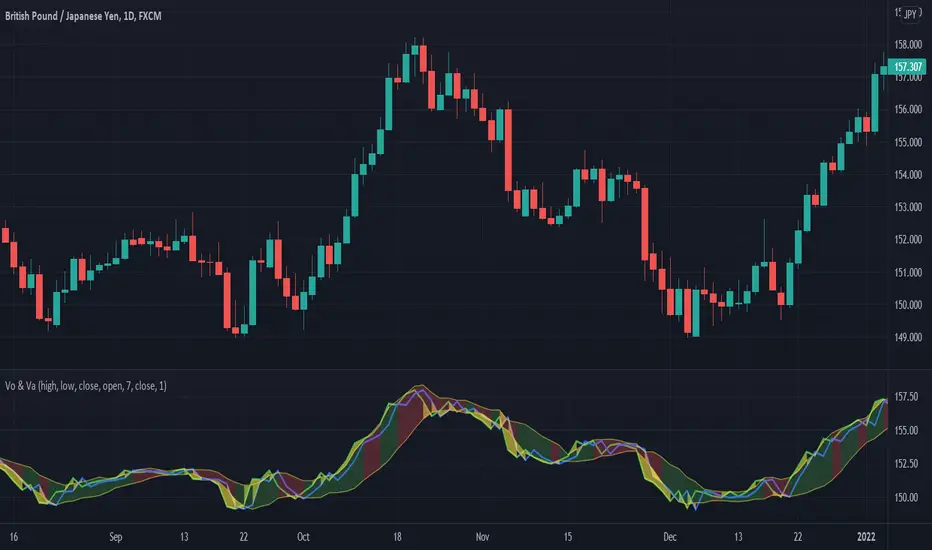
Volume + VolatilityBefore I begin I want to mention:
1. This is a variation of the 'CCI & BB' made by matsu_bitmex (Link: ) and SigmaDraconis's 'On Balance Volume Oscillator + Bollinger Bands' (Link: )
2. While using this sometimes you may not notice the crossover so I've added the Line 'x' outside 'x' BB to only see if Line 3 and 4 crossed over
The indicator:
1. When the background is green and the 2 lines are going up it means uptrend
2. When the background is red and the 2 lines are going down it means downtrend
3. When there is a crossover and the background outside BB turns yellow, it means there is a lot of volatility or volume
How to use (Or how I use this):
1. All trades based on the yellow color MUST be during a trend
2. When the color changes to yellow for the 1st time in the direction of a trend it is advisable to enter
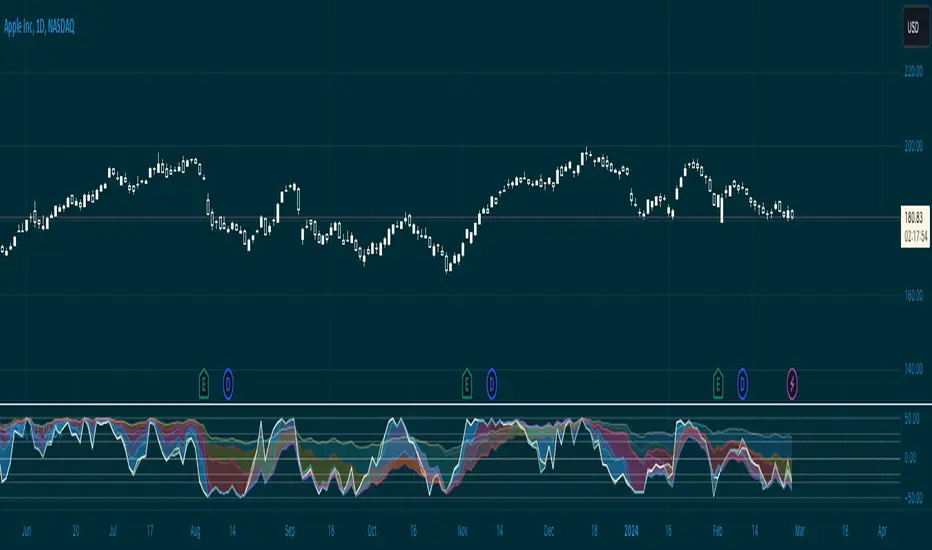
Pro Divergence [regular + hidden] by TradingClue█ Pro Divergence is my new divergence-based toolkit that will help you to spot lucrative opportunities in all kinds of markets.
I've developed toolkits and strategies that use divergences for many years, e.g. AutoDivergence and CCIDivergence . Pro Divergence is my latest development and benefits from those yearlong experiences.
The main algorithm to detect divergences has changed from using linear regressions and moving averages to algorithmic trendline detection like I've been using in TD Lines .
This new approach supports the detection of regular divergences but also hidden divergences can be identified.
Before going more into the details of the mechanics of Pro Divergence, let's recap, what divergences are all about when it comes to trading.
█ Regular Divergence
The basic idea is pretty simple: If price goes in the opposite direction than some other technical indicator - in most cases an oscillator - we speak of a divergence. A regular divergence might be a signal for a trend reversal. That's it.
For example, if the price is currently rising, while at the same time Momentum is falling - it might be time for a reversal and the price of an asset is about to fall soon. If there are additional indications to confirm the signal, e.g. if RSI is in the overbought area, it might be a good idea to go short on that specific asset.
Regular bullish divergences are indicated when price is forming lower lows while an oscillator shows higher lows.
Regular bearish divergences are indicated when price is forming higher highs while an oscillator shows lower highs.
█ Hidden Divergence
While regular divergences indicate trend reversals, hidden divergences indicate a trend continuation.
When the price is making higher lows and the oscillator is showing lower lows, we speak of a bullish hidden divergence. When the price is making lower highs and the oscillator shows higher highs, it's a bearish hidden divergence.
These rules for identifying divergences are pretty simple and straightforward. And they are also confusing at times. But that's what Pro Divergence is helping you with: trade based on customizable signals to identify all kinds of divergences.
You could either use the strategy settings of the toolkit to optimize the properties to show winning backtesting results. Or you use the signals as an extra confirmation to some other kind of signal/ strategy you are working with.
█ Summary of all current features
• Oscillator: choose between CCI, Momentum, MACD, or RSI. All oscillators-settings are customizable.
• RSI-filter: in some cases, the quality of the signals can be improved by an RSI filter, e.g. a bullish signal would only be valid if RSI is in the oversold area. Set the RSI period and the oversold/ overbought levels to your preferred values.
• You can display all divergences on the chart to get an idea of the current price action. Or you can pick any combination of signals you would like to include in a backtest. Possible signals are: regular bullish divergence, regular bearish divergence, hidden bullish divergence, hidden bearish divergence
• Exits: there are many ways to get exit signals - combinations of the below options are possible:
• fixed profit targets/ stop losses based on ticks
• Exit when momentum reverses
• Exit when price touches the opposite Bollinger Band (e.g. a long position will be closed when price touches the upper Bollinger Band). The settings for the Bollinger Bands are customizable.
• Entry: you can choose only to enter a trade if momentum is going in the same direction as the direction of your trade (e.g. only go long if momentum is rising)
• time and date filer
• Do a backtest only in a given time range (maybe you're not interested in the whole range of historical data when trading in a higher timeframe. Or you would like to do some kind of walk forward analysis)
• Only trade during special times of a day, e.g. only trade during the first hours of a trading session
Since this strategy is making heavy use of math and technical indicators, it is not tied to a certain asset class or timeframe. It was tested successfully on a large number of financial instruments like stocks, crypto, forex, and others.

Eflatun CCI Divergence and Top/BottomThe Commodity Channel Index (CCI) with Divergence and finding Top / Bottom points
Select MA with Sma, Ema, Wma, SWma, VWma, Hma or Rma
Follow bar color on top or bottom

Buy / Sell alert indicator [Crypto_BCT]Hello everyone!
I bring to your attention a indicator to determine the point of buy and sell purchase.
It is based on oscillators and a moving average.
It can be used to work with bots, for example 3COMMAS DCA bot.
Signal Condition Settings:
ATR
The current candle is larger than the ATR for this period
EMA
The signal is necessarily below (for buy) and above (for sell) the EMA of the specified period
(Buy) RSI low
The RSI index is below this value
(Sell) RSI High
The RSI index is higher than this value
(Buy) MFI low
The MFI index is below this value
(Sell) MFI High
The MFI index is higher than this value
(Buy) CCI low
CCI index is below this value
(Sell) CCI High
The CCI index is higher than this value
(Buy) Lowest bar from
The closing of the current bar is lower than the closing of the bars back in this range
(Sell) Highest bar from
The closing of the current bar is higher than the closing of bars in this range
(Buy) Lowest EMA bar ago
During a given distance back, the EMA value only decreased
(Sell) Highest EMA bar ago
At a given distance back, the EMA value only increased
I hope it will be useful!

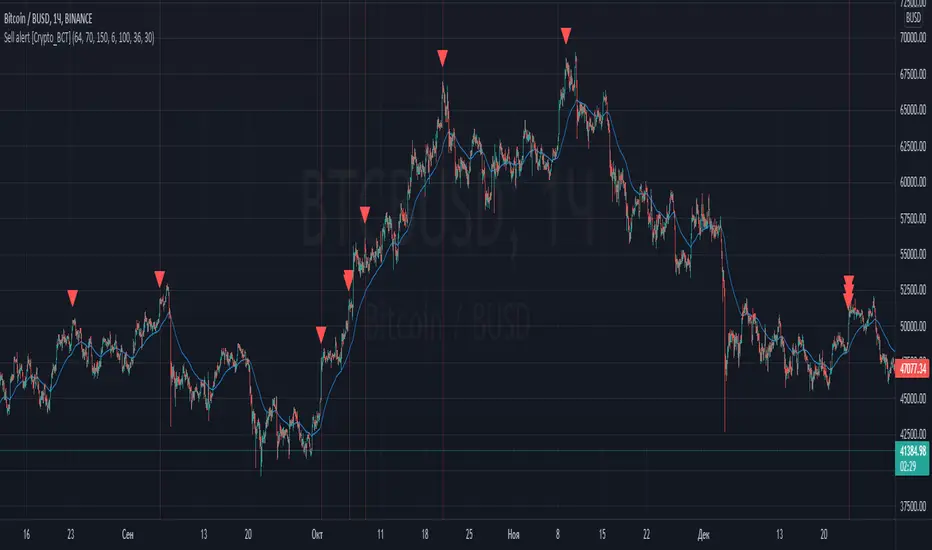
Sell alert [Crypto_BCT]Hello everybody!
I bring to your attention an indicator for determining the point of sell.
It is based on oscillators and a moving average.
Signal Condition Settings:
ATR
The current candle is larger than the ATR for this period
EMA
The signal must be above the EMA of the specified period
MFI High
The MFI index is higher than this value
CCI High
The CCI index is higher than this value
RSI High
The RSI index is higher than this value
Highest bar from
The closing of the current bar is higher than the closing of bars in this range
Highest EMA bar ago
At a given distance back, the EMA value only increased
I hope it will be useful!
CCI StrategyThis CCI strategy will allow you to enter a long or short off a CCI zero line cross or control entries and exits from custom upper and lower band lengths. You can set a custom upper band which it will buy when it crosses up and then a custom upper band exit which it will sell when it crosses down. For a short you can set a custom lower band which it will short when it crosses down and the custom lower band exit which it will exit the short when it crosses up. Be sure to enter slippage and commission into the properties to give you realistic results.
I've also built in backtesting date ranges and the ability to trade only within certain times of day and have it close all trades at the end of that time frame. This is especially useful for day trading stocks. If you check off "Enter First Trade ASAP" then when using the time frame option it will enter the current trade. If however you uncheck that box and instead check off "Wait To Enter First Trade" it will wait for the trend to change and then enter.
You can also specify a % based take profit and stop loss. Also keep in mind that if you have "Enter First Trade ASAP" checked off and use the stop loss and/or take profit then it will re-enter the current trend again.
Finally there's custom alert fields so you can send custom alert messages for strategy entry and exit for use with automated trading services. Simply enter your messages in the fields within the strategy properties and then put {{strategy.order.alert_message}} in your alert message body and it will dynamically pull in the appropriate message.

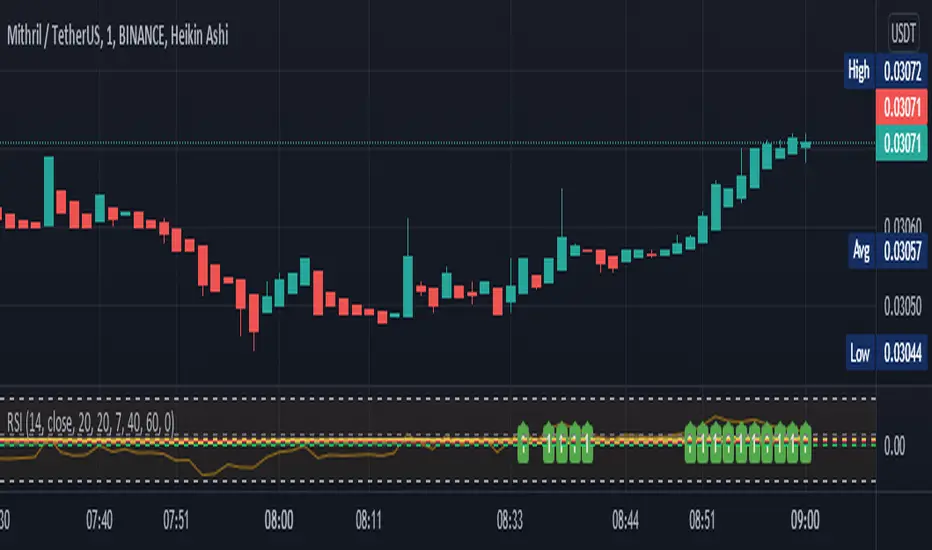
Buy alert [Crypto_BCT]Hello everyone!
I bring to your attention a simple indicator to determine the point of purchase.
It is based on oscillators and a moving average.
It can be used to work with bots, for example 3COMMAS DCA bot.
Signal Condition Settings:
ATR
The current candle is larger than the ATR for this period
EMA
The signal is necessarily below the EMA of the specified period
MFI low
The MFI index is below this value
CCI low
CCI index is below this value
RSI low
The RSI index is below this value
Lowest bar from
The closing of the current bar is lower than the closing of the bars back in this range
Lowest EMA bar ago
During a given distance back, the EMA value only decreased
I hope it will be useful!

Williams %R & RSI with Multiple PeriodsDESCRIPTION
1. Calculates %R and RSI with multiple period lengths.
1 period length value is defined by User.
8 period length values follow User's selection of classic number sequences, e.g. Fibonacci, Leonardo, Lucas, Narayana, etc.
2. User selects which indicator and periods to display or hide.
DEFAULTS
%R default custom period: 10.
RSI default custom period: 14.
%R & RSI default number sequence periods: Lucas numbers 11, 18, 29, 47, 76, 123, 199, 322.
CALCULATIONS
%R = (period high - most recent period's close price)/(period high - period low)
RSI = 100 - 1 / (100 + RS), where RS = SMMA(up, period) / SMMA(down, period)
PURPOSE
1. Identify price trends.
CREDITS
1. Williams %R technical analysis momentum oscillator by Larry Williams.
2. Wilder's Relative Strength Index technical analysis momentum oscillator by J. Welles Wilder.
3. "Solarized" color scheme by Ethan Schoonover.
RSI & CCi SIGNAlUsing the RSA cross-indicator at points 70 and 30
Using the CCI cross indicator at points 100 and -100
Simultaneous use of RSA or CCI signal or both
Exit at 0.5% profit

3RSI 3CCI BB 5orders DCA strategy+This strategy is just an attempt to find the indicator values for the trading bot service that I use (link in profile). Due to the use of the “request.security” function in the code, the indicators can be redrawn, but this is not important in history. The strategy used only 5 orders for the "DCA" - bot, located at the same distance in the price overlap range. I only use this strategy when trading in pairs against bitcoin.
Эта стратегия – просто попытка подобрать значения индикаторов для сервиса торговых ботов, который я использую (ссылка в профиле). Из-за использования в коде функции «request.security» возможна перерисовка индикаторов, но на истории это не важно. В стратегии использовано всего 5 ордеров для «DCA» - бота, находящихся на одинаковом расстоянии в диапазоне перекрытия цены. Я использую данную стратегию только при торговле в парах к биткоину.

TEWY - Magic Strength Indicator (SI)Detail about this indicator
1. This indicator is used to identify the trend based on the momentum of the counter selected.
2. This indicator is calculated three different metrics for selected script and it's Parent/Main Index as NSE:NIFTY (default) and Sector Index. Keep in mind below point
a) Parent/Main index is set to default NSE:NIFTY, though there is option to provide your own custom parent index e.g. US30, US 100'
B) Sector Index is identified automatically for set to predefined stocks and rest ate set to default NIFTY 500. Again you have option to change it to your preference
3. I have used the rate of change and RSI of it to calculate momentum for script, it's parent index and sector index.
4. I would typically use this indicator to see momentum on the Monthly and Weekly first and daily timeframe to get proper entry.
5. Also please try to stay in the long position only unless you understand the consequences for shorting a stock . why? because the imminent nature of the market is to go upward only.
6. Please try to keep base inputs as defaults, though it allows you to change input parameters
Let's understand this indicator
• On the tor right corner you would see three different numbers. 1st number is SI of the underlying Ticker. 2nd number is SI for the Sector Index and 3rd is for Parent Index SI.
• If selected ticker is outperforming it's parent index the you see one green "▲" and if ticker is also outperforming it's sector index then you would see two green "▲▲". Same on the downside.
• I would only take long position if selected ticker is at least outperforming Parent index, that means at least one green "▲".
• I would take exit from the position if I see no more green "▲".
Always respect RISKS and follow stop loss. In market stop loss is the only friend of yours.
I have given a sample illustrational image below, which should help you understand this indicator.
Best of luck
