Uber M-Oscillator (M. Fawzy, 2018) [UTS]General Usage
The M-Oscillator analyses the price change rather than the price level. It draws the difference between prices at two time intervals.
It is a leading indicator of price direction. It can identify when the current trend is no longer maintaining its same level of strength or is losing
momentum. The importance of the momentum is when its value reaches to extreme levels either up or down.
Interpretation
M-Oscillator reading for default period of 14.
M-Oscillator is plotted along the bottom of the price chart; it
fluctuates between positive and negative 14.
Movement above 10 is considered overbought, and movement
below -10 is oversold.
In sharp moves to the upside, the M-Oscillator fluctuates
between 5 and 14, while in down side it fluctuates between -5
and -14.
In an uptrend, the M-Oscillator fluctuates between zero and
14 and vice versa.
The advantage
The momentum line leads the price action (it leads the
advance or decline in prices).
The crossing of the zero line is considered as a trading signal.
The disadvantage
The need for an upper and lower boundary.
If recent price gains are the same as older price gains, the
momentum line will be fl at even though the market is still
going up.
If recent price gains are less than those of before, even if
prices are still rising, the rate of change will have slowed
further, and the momentum line will actually drop.
Using price differences in the erratic movements often caused
by sharp changes in the value.
The "Uber" M-Oscillator
The Uber version of M-Oscillator provides the following improvements:
Period is not fixed to 14 anymore, can be determined freely
Overbought and oversold conditions are automatically adjusted to the chosen period
Ability to draw oscillator crosses on the signal line
For both oscillator and signal line smoothing 16 moving averages are available
Available Moving Averages
16 different moving averages are available for oscillator and signal line:
ALMA (Arnaud Legoux Moving Average)
DEMA (Double Exponential Moving Average)
EMA (Exponential Moving Average)
FRAMA (Fractal Adaptive Moving Average)
HMA (Hull Moving Average)
JURIK (Jurik Moving Average)
KAMA (Kaufman Adaptive Moving Average)
Kijun (Kijun-sen / Tenkan-sen of Ichimoku)
LSMA (Least Square Moving Average)
RMA (Running Moving Average)
SMA (Simple Moving Average)
SuperSmoothed (Super Smoothed Moving Average)
TEMA (Triple Exponential Moving Average)
VWMA (Volume Weighted Moving Average)
WMA (Weighted Moving Average)
ZLEMA (Zero Lag Moving Average)
Alerts
Traders can easily use the trend change signals to trigger alerts from:
Cross Up
Cross Down
Those values are > zero if a condition is triggered.
Alert condition example: "Cross Up" - "GreaterThan" - "0"
Trading tactics
Overbought/Oversold:
We define the overbought area as anywhere above the 10
level. The oversold area is below -10. When the M-Oscillator goes
above 10 (overbought) and then re-crosses it to the downside,
a sell signal is triggered. When the M-Oscillator surpasses -10
to the downside and then re-crosses back above this level, a
buy signal is triggered. This tactic is only successful during
sideways markets; during an uptrend, the oscillator will remain
in its overbought territory for long period of times. During a
downtrend, it will remain in oversold for a long time.
Overbought/Oversold rule:
Buy when the M-Oscillator violates the (-10) level to the
downside and crosses back to the upside
Sell when the M-Oscillator crosses above the (+10) level and
crosses back to the downside
Divergence:
Divergence is one of the most striking features of the
M-Oscillator. It is a very important aspect of technical analysis
that enhances trading tactics enormously; it shows hidden
weakness or strength in the market, which is not apparent in
the price action. A positive divergence occurs when the price is
declining and makes a lower low, while M-Oscillator witnesses
a higher low. A negative divergence occurs when the price is
rising and makes a higher High, while the M-Oscillator makes
a lower high, which indicates hidden weakness in the market.
Divergences are very important as they give us early hints of
trend reversal.
Divergence rule:
Buy when the M-Oscillator witnesses a positive divergence
with prices followed by a rise above (-10)
Sell when the M-Oscillator witnesses a negative divergence
with prices followed by a decline below (+10)
Support and Resistance
During an uptrend, the M-Oscillator moves between (0) and
(+10). During a downtrend, most of the time the M-Oscillator
will move between (0) and (-10). Sometimes the (0) level acts
as support (in the case of uptrends) and resistance (during
downtrends). We can buy during an uptrend when the
M-Oscillator reaches its midrange (0) and begins to move to the
upside from there. During downtrends, an upward move to (0)
might be a selling opportunity.
It is also used as exit signal (when the M-Oscillator acts as a
resistance) as well as indication of a re-entry level (when the
M-Oscillator acts as a support)
Exit signal:
When the M-Oscillator crosses above the (-10), giving
a buy signal, but it doesn’t retrace further than the zero
line, the M-Oscillator drops towards the lower boundary.
This is considered as weakness and an exit signal when the
M-Oscillator drops from the zero line toward the (-10). (To avoid
whipsaws, filters can be used.)
Re-entry:
When the M-Oscillator breaks the (+10), giving a sell signal,
but it doesn’t retrace further than the zero line, the M-Oscillator
rebounds toward the upper boundary. This is considered as
strength and a re-entry point when the M-Oscillator rebounds
from zero line to upside. (To avoid whipsaws, filters can be used.)
Using M-Oscillator as a Trend Identifier on LongTerm Scale
During downtrends, the M-Oscillator does not reach
overbought zone. A move toward the overbought area is a sign of
strength when it occurs for the first time in a while. On the other
hand, during uptrend, the M-Oscillator does not reach oversold
areas easily. Going into oversold and staying there after a long
time is a signal that the uptrend is reversing. (As Constance
Brown explained in her book Technical Analysis for the Trading
Professional, chapter 1, “oscillators do not travel between 0 and
100”.)
Crossover on Extreme Levels
Sell signals are triggered when the M-Oscillator crosses
its signal line above (13), which indicates an extreme market
condition, and buy signals are triggered when the M-Oscillator
crosses its signal line below (- 13).
Oscylator Momentum Chande'a (CMO)

Aroon Histogram + CMO Multiple Time Frames [ChuckBanger]This script is based on my Aroon Histogram + CMO:
But it has the option to use it multiple time frames to automatically check for bull and bear crossover on CMO and it has the ability for the trader to set alert on crossovers

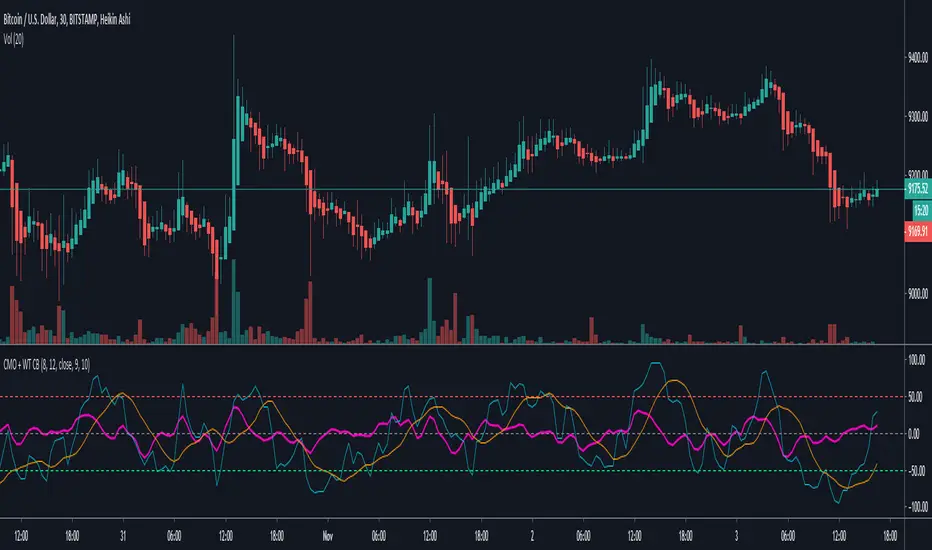
Chande Momentum Oscillator + WaveTrend Oscillator [ChuckBanger]This is a combination of Lazybears WaveTrend Oscillator (purple line) and Chande Momentum Oscillator (blue line with the orange line as a signal line). Use WaveTrend as a confirmation tool. It is consider as a selling point when CMO is over the red horizontal dotted line. The opposite applies if CMO line is under the red horizontal dotted line.
You can also use this with WaveTrand to confirm the sell or buy point. When WT line is over center line and CMO has crossed over it's signal line. It is a buy point. The opposite applies if WT line is under the center line and CMO is under its signal line.
Aroon Histogram + CMO [ChuckBanger]This is a combination of Aroon and Chande Momentum Oscillator . I made a histogram of Aroon , aqua line is Chande Momentum and the orange line are a simple moving average of Chande Momentum as a signal line.
One strategy you can use this for is to buy or sell when the signal line crosses the CM line or you can buy and sell when CM line is highest or lowest
You should also study how the indicators work separately:
Aroon Oscillator
www.investopedia.com
Chande Momentum Oscillator
www.investopedia.com
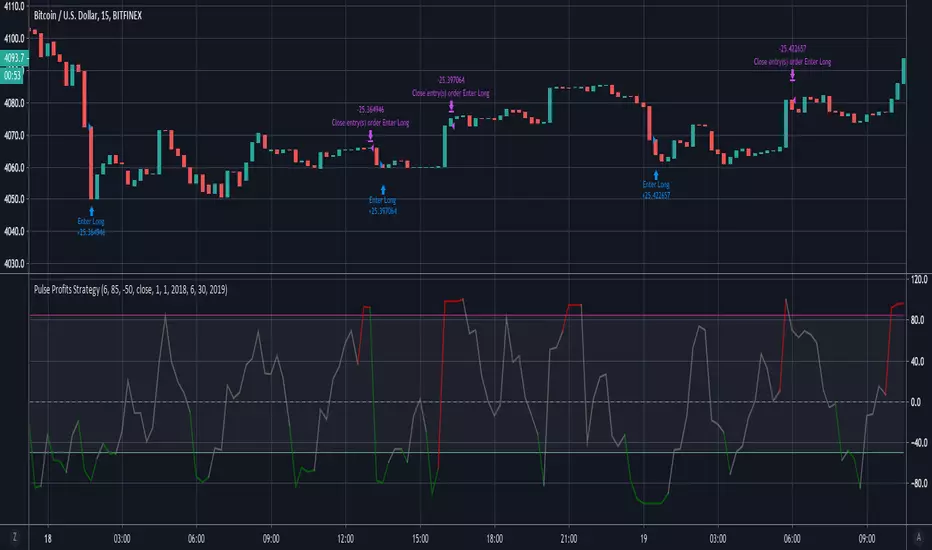
Pulse Profits Strategy v2.0This is the strategy version that is included with the Pulse Profits+ study. This strategy is based on the Chande Momentum Oscillator and Elder's Force Index(EFI).
The strategy includes options to add a stop loss and adjust all input options based on specific usage.

Pulse Profits+ Study v2.0Here is the updated version of our Pulse Profits+ study based on the combination of the Chande Momentum Oscillator and Elder's Force Index . This version was updated to include stop-loss and improved signals
Red background highlights mark sell signals and green highlights represent buy signals. All signals are accompanied by corresponding alerts that can be tailored for the various automated trading platforms.
All indicators can be found on our website in the bio and come with their strategy equivalents

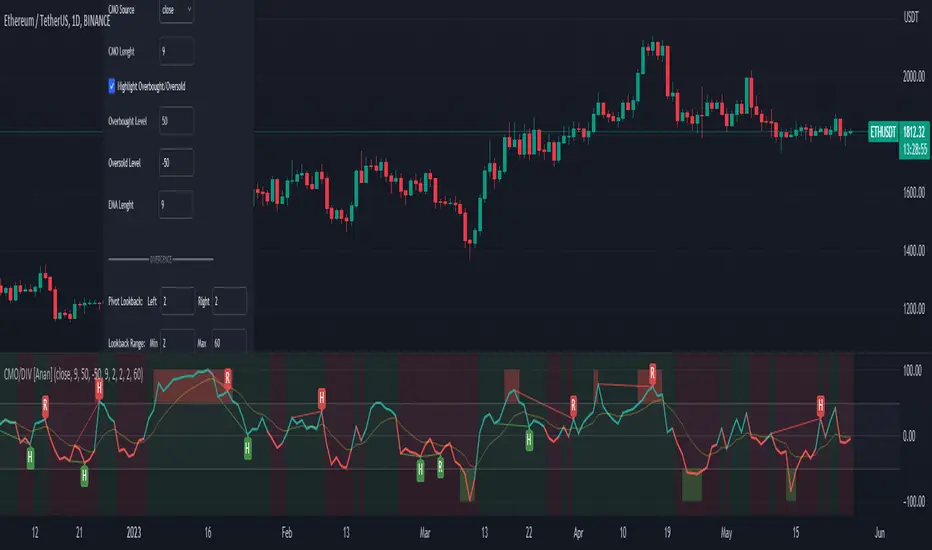
Chande Momentum Oscillator(CMO) & EMA with Divergences Hello Friends,
* Chande Momentum Oscillator (CMO) + EMA + (Regular/Hidden) Divergence + Bullish/Bearish background colors.
* You can edit your options from indicator settings.
Pulse Profits+ StrategyStrategy Version of the Pulse Profits+ Indicator based on Elder's Force Index and Chande Momentum Oscillator.
Momentum TraderThis study combines two versatile momentum indicators :
Chande Momentum Oscillator:
-Measures trend strength, with higher absolute values meaning greater strength.
-Also tracks divergence. When price increases, but is not accompanied by an increase in Chande Momentum Oscillator values, it signifies bearish divergence and a reversal is likely to follow.
-Shown as the teal and pink histogram.
Percentage Price Oscillator:
-Similar to the MACD, except that it expresses the difference between the two moving averages in terms of a percentage. This makes it a little easier to visualize.
-PPO values greater than zero indicate an uptrend, as that means the fast EMA is greater than the slow (and vice versa).
Entry and Exit Conditions:
Enter When:
1) Chande Momentum crosses over zero from negative to positive territory. AND
2) It has been less than 3 bars since Chande Momentum was less than the lower green line. AND
3) Chande Momentum is rising(positive slope).
Exit When:
1) Chande Momentum is greater than the upper line. AND
2) It has been less than 6 bars since the PPO value was greater than the upper bound. AND
3) PPO is less than 5 (meaning the difference between the two EMA's is less than 5%). AND
4)PPO has a negative slope.
This study comes with alert conditions for long entries and exits.
~Happy Trading~

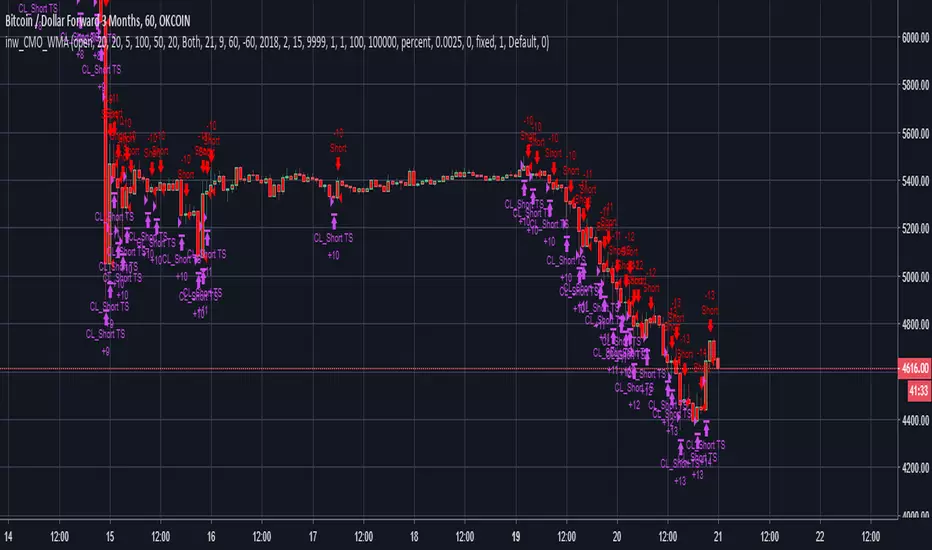
inwCoin CMO&WMA StrategyOriginal strategy by HPotter :
Actually I still have no idea how it work but the backtest result is way too good haha
Let me know if you want to try this strategy.
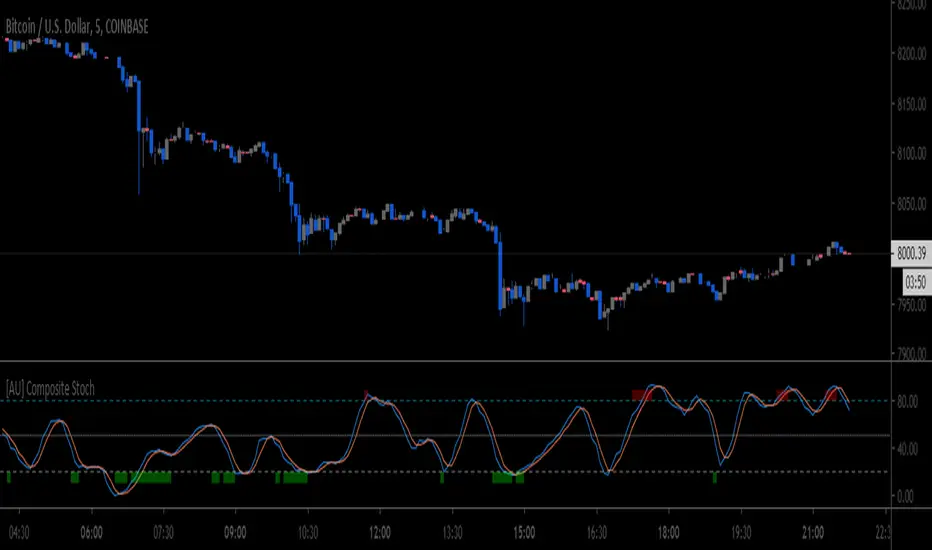
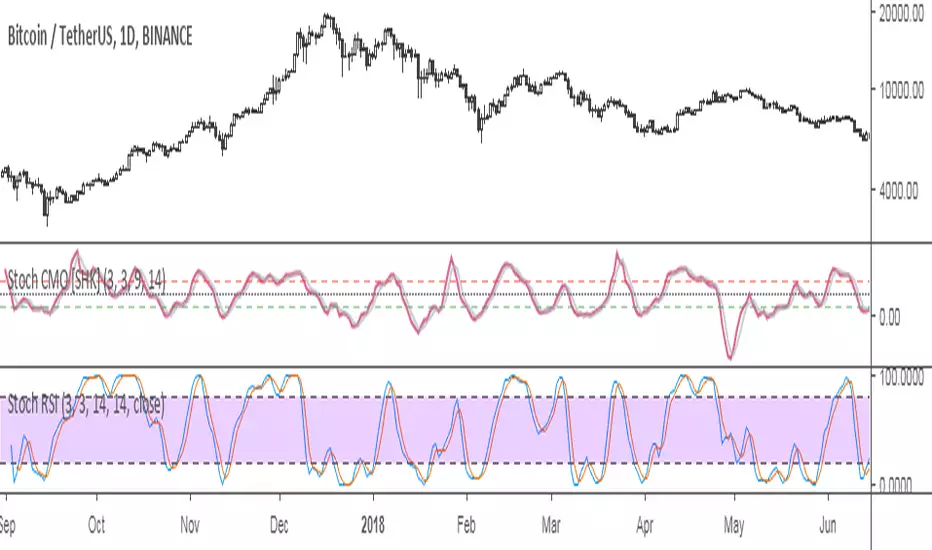
StochCMO - Stochastic CMO [SHK]StochCMO is the combination of Stochastic and CMO (Chande Momentum Oscillator).
The StochCMO is an indicator used in technical analysis that ranges between zero and one and is created by applying the Stochastic Oscillator formula to a set of Chande Momentum Oscillator (CMO) values rather than standard price data. Using CMO values within the Stochastic formula gives traders an idea of whether the current CMO value is overbought or oversold - a measure that becomes specifically useful when the CMO value is confined between its signal levels of 20 and 80.
Usage:
The usage of StochCMO is similar to StochRSI.
StochCMO vs StochRSI:
The difference between these indicators can be realized by comparing CMO & RSI:
CMO is similar to the Relative Strength Index (RSI) except that it measures momentum on both up days and down days. The CMO also does not use internal smoothing and thus does not obscure short-term extremes in momentum. As a result, the CMO often reaches over bought and over sold areas more regularly than momentum indicators, such as the RSI, that have internal smoothing.
Hope it helps you.
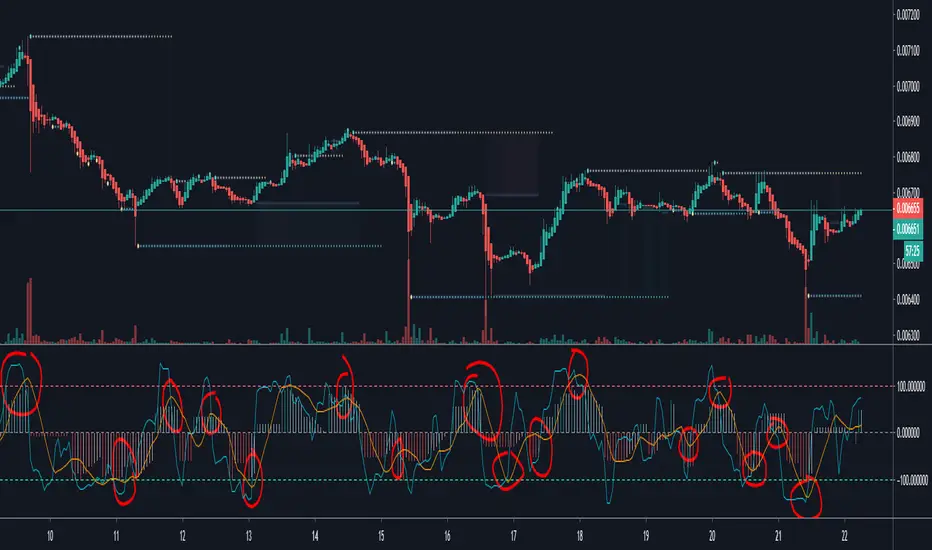
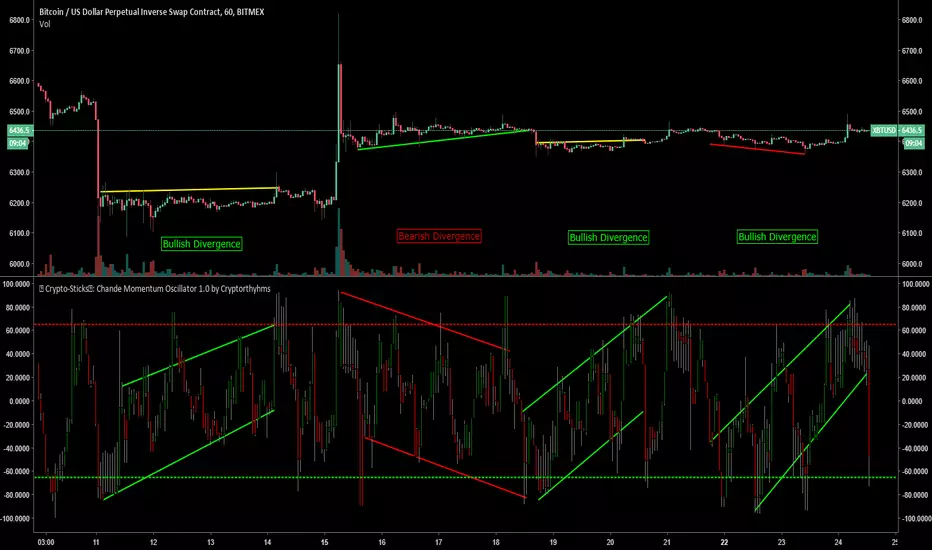
🥢 Crypto-Sticks™: Chande Momentum Osc by Cryptorthyhms🥢 Crypto-Sticks™
A new series of indicators brought to you by Cryptorthyhms...giving you an alternate look at your trusted favorites!
🚀 Indicator Specific Info
I have found this indicator to show nice divergences as shown on the main chart. Even in this nightmarish sideways bitcoin movement, it still is giving decent divergence signals! It also gives a signaling system to CMO implementing overbought and oversold zones. This indicator is freely available for anyone from the public library.
🚀 Crypto-Sticks General Info
💭This series isnt polished 100%, and I have some more options I will add in the future. But for now, I want to just release them, as I am not sure when I will have the time to put more work into them (many other big projects I am working on).
📊Its basically reinterpretations of all your favorite indicators. I calculate the values a little bit differently than normal, but the end result is creating a candlestick chart (for the indicator!). Then I added the option to plot them as Heiken Ashi candles to smooth out noise and make signaling easier. Here's how it looks as Heiken Ashi:
🔊Lastly I implemented a Volume Weighting system for them all which simply integrates volume into the formulas for these indicators. For the most part this feature is experimental and doesn't provide huge utility ( yet - I have other ways I want to try it as well - just no time). Though on some of the indicators it already shows great promise. Here is Volume Weighted + Heiken Ashi:
👍Enjoying this indicator or find it useful? Please give me a like and follow! There are many more indicators to be released in this series, not to mention I post crypto analysis and other free indicators regularly.
💬Questions? Comments? Want to get access to an entire suite of proven trading indicators? Come visit us on telegram and chat, or just soak up some knowledge. We make timely posts about the market, news, and strategy everyday. Our community isnt open only to subscribers - everyone is welcome to join.
📊 Crypto-Sticks: Chande Momentum Oacillator 1.0 by CryptorthyhmsFirst release from the Crypto-Sticks series of indicators... brought to you by Cryptorthyhms!
🚀 Indicator specific Info
I find this implementation of CMO useful for spotting divergences and for creating signals based on the indicator. Some divergences were highlighted on the chart/indicator showing you potential use cases.
🚀 Crypto-Sticks General Info
💭The idea behind this series isnt polished 100%, and I have some more options I will add in the future. But for now, I want to just release them, as I am not sure when I will have the time to put more work into them (many other big projects I am working on).
📊Its basically reinterpretations/remixes of all your favorite indicators. I calculate the values a little bit differently than normal, but the end result is creating a candlestick chart (for the indicator!). Then I added the option to plot them as Heiken Ashi candles to smooth out noise and make signaling easier.
🔊Lastly I implemented a Volume Weighting system for them all which simply normalizes volume and integrates it into the formulas for these indicators. For the most part this feature is experimental and doesnt provude huge utility (yet - I have other ways I want to try it as well - just no time).
💠I have found the candlestick implementation offers some unique perspectives and I hope you find it useful!
👍If you enjoy the indicators, feel free to give it a like and follow me! Many more free indicators to come in this series.
💬Questions? Comments? Want to become a subscriber and gain access to tons of powerful custom indicators? Join us on our telegram which is linked in my signature below!

Chande Momentum OscillatorChande Momentum Oscillator script.
This indicator was developed and described by Tushar S. Chande and Stanley Kroll in their book "The New Technical Trader" (1994, Chapter 5: New Momentum Oscillators).

[Single] Heartbeat_Live (pine v3 version)Per request of many.
Single -=Heartbeat=- (pine version 3) with bar merge and look ahead enabled.
Have fun!


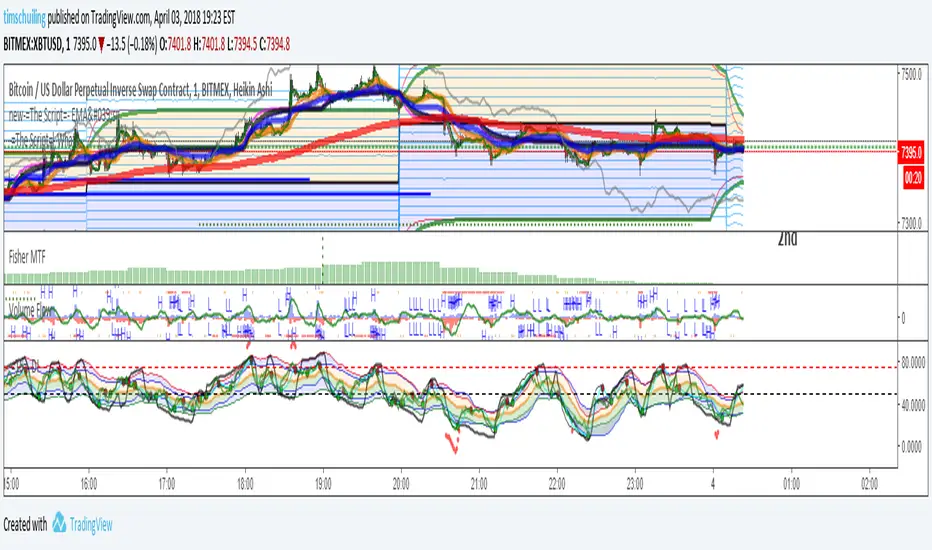
-=The Script=- Creators Edition-=The Script=- Creators Edition
A classic edition in the series of -=The Script=-
The pre-weighted values compatible with many coinpairs:
• A combination of standard indicators that produce very nice results when touched by -=The Script=- Creator!
DISCLAIMER:
The creators of these script are not financial advisors, and as such, this script is not financial advice. Anything seen or used within this script is here simply for educational purposes and it is up to you to decide what to do with this information and results. Please do your own research and verify any outcome made before deciding to act upon them. Do not commit any of your own resources to any trading or cryptocurrency activities without first verifying the accuracy of the information and know that your decisions are your own.

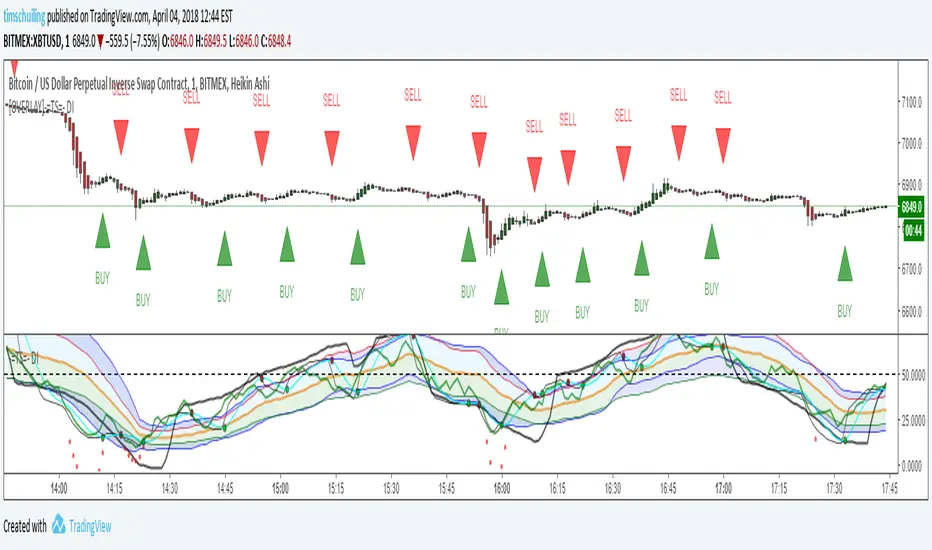
-=The Script=- DI-=The Script=- DI, Fisher Transformation
A indicator build around fisher transformation, aka wavetrend.
CMO_EMA (Chande Momentum Oscillator and EMA)
The absolute value of "CMO" alone makes it impossible to know the current location for the waves and there is a possibility of doing useless entry.
To prevent this, display EMA.

CMO_EMA (Chande Momentum Oscillator and EMA)The absolute value of "CMO" alone makes it impossible to know the current location for the waves and there is a possibility of making useless entries.
In order to prevent this, display EMA.

