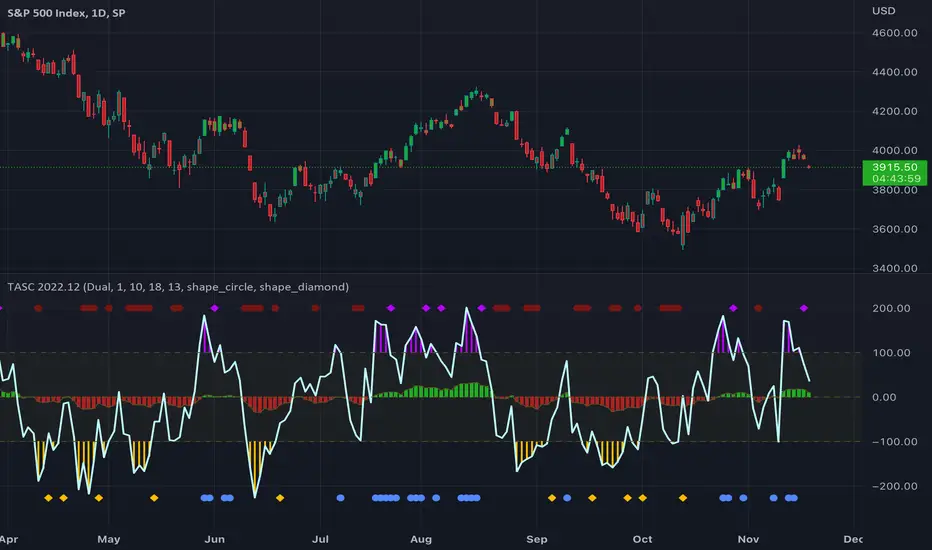
TASC 2022.12 Short-Term Continuation And Reversal Signals█ OVERVIEW
TASC's December 2022 edition Traders' Tips includes an article by Barbara Star titled "Short-Term Continuation And Reversal Signals". This is the code that implements the concepts presented in this publication.
█ CONCEPTS
The article takes two classic indicators, the Commodity Channel Index (CCI) and the Directional Movement Indicator (DMI), makes changes to the traditional ways of visualizing their readings, and uses them together to generate potential signals. The author first discusses the benefits of converting the DMI indicator to an oscillator format by subtracting the −DI from the +DI, which is then displayed as a histogram. Next, the author shows how the use of an on-chart visual framework (i.e., choosing the line style and color, coloring price bars, etc.) can help traders interpret the signals produced the considered pair of indicators.
█ CALCULATIONS
The article offers the following signals based on the readings of the DMI and CCI pair, suitable for several types of trades:
• Short-term trend change signals:
A DMI oscillator above zero indicates that prices are in an uptrend. A DMI oscillator below the zero line and falling means that selling pressure is dominating and price is trending down. The sign of the DMI oscillator is indicated by the color of the price bars (which correlates with the color of the DMI histogram). Namely, green, red and grey price bars correspond to the DMI oscillator above, below and equal to zero . Colored price bars and the DMI oscillator make it easy for trend traders to recognize changes in short-term trends.
• Trend continuation signals:
Blue circles appear near the bottom of the oscillator chart border when the DMI is above the zero line and the price is above its simple moving average in an uptrend . Dark red circles appear near the top of the chart in a downtrend when the DMI oscillator is below its zero line and below the 18-period moving average. Trend continuation signals are useful for those looking to add to existing positions, as well as for traders waiting for a pullback after a trend has started.
• Reversal signals:
The CCI signals a reversal to the downside when it breaks out of its +100 and then returns at some point, crossing below the +100 level. This is indicated by a magenta-colored diamond shape near the top the chart. The CCI signals a reversal to the upside when it moves below its −100 level and then at some point comes back to cross above the −100 level. This is indicated by a yellow diamond near the bottom of the chart. Reversal signals offer short-term rallies for countertrend traders as well as for swing traders looking for longer-term moves using the interplay between continuation and reversal signals.
Oscylatory skupione
Adaptive Fisherized CMFIntroduction
Heyo, here I made a normalized Chaikin Money Flow (CMF) indicator with Inverse Fisher Transform (IFT) and some smoothing techniques.
I had to normalize the indicator in order to fit it to the IFT range (-1 -> 1).
Moreover, the good old adaptive mode is also included in this indicator. It uses Ehlers superb dominant cycle techniques.
It also has divergence detection, several options for individualisation and doesn't repaint.
Usage
www.investopedia.com
Signals
CMF above 0 => bullish market
CMF below 0 => bearish market
(You can also use the inner bands instead of the zero line, to make these signals more precise)
Bullish regular/hidden divergence => long
Bearish regular/hidden divergence => short
Enjoy guys!
PS: I really would like to hear some feedback of you.
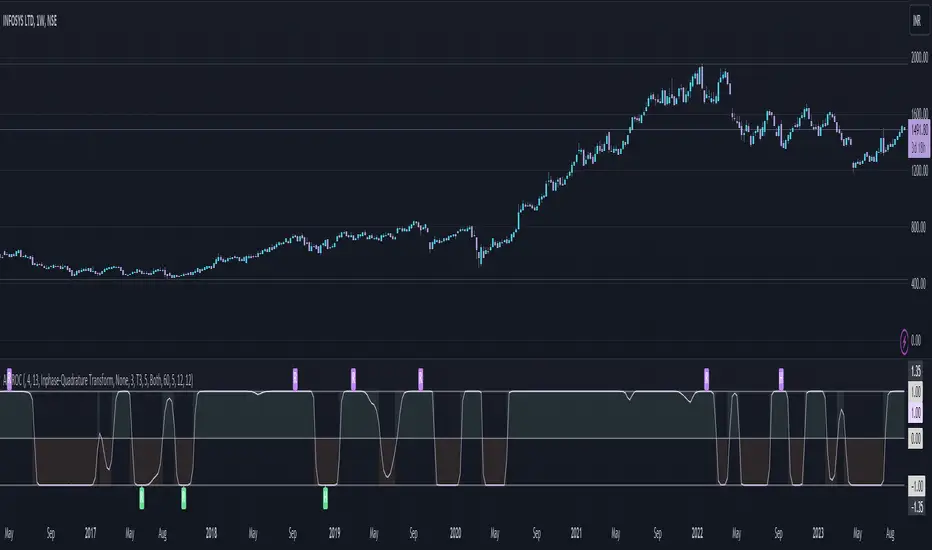
Adaptive Fisherized ROCIntroduction
Hello community, here I applied the Inverse Fisher Transform, Ehlers dominant cycle determination and smoothing methods on a simple Rate of Change (ROC) indicator
You have a lot of options to adjust the indicator.
Usage
The rate of change is most often used to measure the change in a security's price over time.
That's why it is a momentum indicator.
When it is positive, prices are accelerating upward; when negative, downward.
It is useable on every timeframe and could be a potential filter for you your trading system.
IMO it could help you to confirm entries or find exits (e.g. you have a long open, roc goes negative, you exit).
If you use a trend-following strategy, you could maybe look out for red zones in an in uptrend or green zones in a downtrend to confirm your entry on a pullback.
Signals
ROC above 0 => confirms bullish trend
ROC below 0 => confirms bearish trend
ROC hovers near 0 => price is consolidating
Enjoy! 🚀
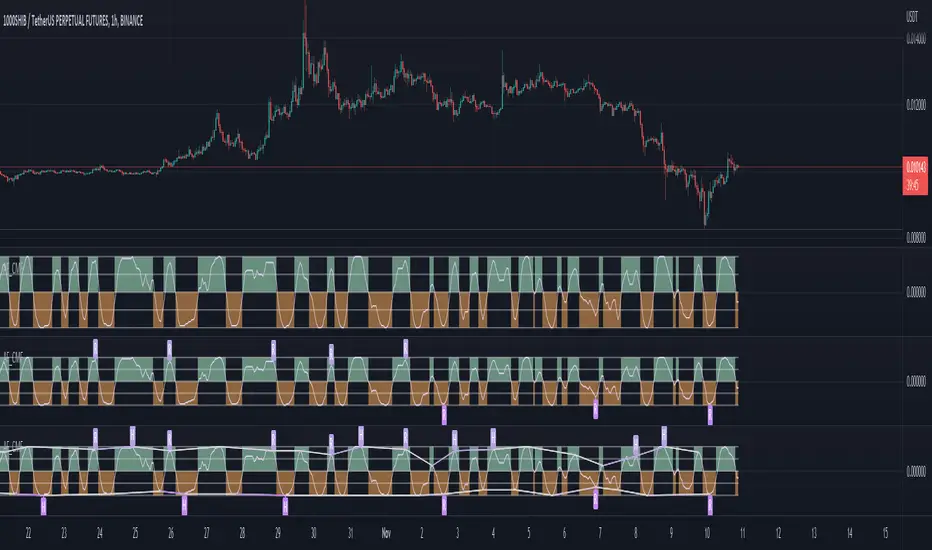
MTF Commodity Oddity Index (CCI+)MTF Commodity Oddity Index (CCI+)
This chart overlay indicator is based upon the Commodity Channel Index (CCI) and can signal multiple triple-timeframe CCI overbought and oversold confluences directly onto your chart, intended for use as a confluence either for reversal trade entries, or potential trade exits, indicating where price may be probable to reverse.
Features include:
- Primary set of fully configurable triple-timeframe overbought and oversold signals, indicating where 3 selected timeframes are all overbought or all oversold at the same time. Enabled by default.
- Secondary set of fully configurable triple-timeframe overbought and oversold signals, indicating where 3 selected timeframes are all overbought or all oversold at the same time. Enabled by default.
- Optional drawing of background colours and/or ribbon seen at bottom of the chart image.
- The default primary MTF #1 timeframes are set to 1 minute, 5 minute and 15 minute. These are highly suitable for low timeframe scalpers trading on < 5m charts, and can often pin point price reversals.
- The default Secondary MTF #2 timeframes are set to 15 minute, 30 minute and 120 minute. These are suitable for both low timeframe scalpers and considerably higher timeframe traders.
- Independent alerts for MTF #1 and MTF #2 triple-timeframe confluences, including options for alerting MTF overbought and MTF oversold individually, as well as an option for alerting either overbought or oversold in a single combined alert.
- Also includes standard configurable CCI options, including CC length and source type.
Note: The features listed above are accurate at the time of publishing but maybe updated or added to in future.
A similar MTF CCI indicator is also available as a panel indicator here .
This indicator is based upon the original MTF Fantastic Stochastic (FS+) available here .
What is the Commodity Channel Index (CCI)?
Investopedia has described the popular oscillator as follows:
“The Commodity Channel Index (CCI) is a momentum-based oscillator used to help determine when an investment vehicle is reaching a condition of being overbought or oversold.
Developed by Donald Lambert, this technical indicator assesses price trend direction and strength, allowing traders to determine if they want to enter or exit a trade, refrain from taking a trade, or add to an existing position. In this way, the indicator can be used to provide trade signals when it acts in a certain way.”
You can read more about the CCI , its use cases and calculations here .
How do traders use overbought and oversold levels in their trading?
The oversold level, that is traditionally when the CCI is above the 100 level is typically interpreted as being 'overbought', and below the -100 level is typically considered 'oversold'. Traders will often use the CCI at an overbought level as a confluence for entry into a short position, and the CCI at an oversold level as a confluence for an entry into a long position. These levels do not mean that price will necessarily reverse at those levels in a reliable way, however. This is why this version of the CCI employs the triple timeframe overbought and oversold confluence, in an attempt to add a more confluence and reliability to this usage of the CCI . While traditionally, the overbought and oversold levels are below -100 for oversold, and above 100 for overbought, the default threshold settings of this indicator have been increased to provide fewer, stronger signals, especially suited to the low timeframes and highly volatile assets.

MTF CCI + Realtime DivergencesMulti-timeframe Commodity Channel Index (CCI) + Realtime Divergences + Alerts
This version of the CCI includes the following features:
- Optional 2x sets of triple-timeframe overbought and oversold signals with fully configurable timeframes and overbought and oversold thresholds, can indicate where 3 selected timeframes are all overbought or all oversold at the same time, with alert option.
- Optional divergence lines drawn directly onto the oscillator in realtime, with alert options.
- Configurable pivot periods to fine tune the divergences drawn in order to suit different trading styles and timeframes, including the ability to enable automatic adjustment of pivot period per chart timeframe.
- Alternate timeframe feature allows you to configure the oscillator to use data from a different timeframe than the chart it is loaded on.
- 'Hide oscillator' feature allows traders to hide the oscillator itself, leaving only the background colours indicating the overbought and oversold periods and/or MTF overbought and oversold confluences, as seen in the chart image.
- Also includes standard configurable CCI options, including CCI length and source type. Defaults set to length 20, and hlc3 source type.
- Optional Flip oscillator feature, allows users to flip the oscillator upside down, for use with Tradingviews 'Flip chart' feature (Alt+i), for the purpose of manually spotting divergences, where the trader has a strong natural bias in one direction, so that they can flip both the chart and the oscillator.
- Optional 'Fade oscillator' feature, which will fade out all but the most recent period, reducing visual noise on the chart.
While this version of the CCI has the ability to draw divergences in realtime along with related alerts so you can be notified as divergences occur without spending all day watching the charts, the main purpose of this indicator was to provide the triple-timeframe overbought and oversold confluence signals, in an attempt to add more confluence, weight and reliability to the single timeframe overbought and oversold states, commonly used for trade entry confluence. It's primary purpose is intended for scalping reversal trades on lower timeframes, typically between 1-15 minutes, which can be used in conjunction with the regular divergences the indicator can highlight. The triple timeframe overbought can often indicate near term reversals to the downside, with the triple timeframe oversold often indicating neartime reversals to the upside. The default timeframes for this confluence are set to check the 1m, 5m and 15m timeframes together, ideal for scalping the < 15 minute charts. The default settings for the MTF #1 timeframes (1m, 5m and 15m) are best used on a <5 minute chart.
Its design and use case is based upon the original MTF Stoch RSI + Realtime Divergences found here .
Commodity Channel Index (CCI)
Investopedia has described the popular oscillator as follows:
“The Commodity Channel Index (CCI) is a momentum-based oscillator used to help determine when an investment vehicle is reaching a condition of being overbought or oversold.
Developed by Donald Lambert, this technical indicator assesses price trend direction and strength, allowing traders to determine if they want to enter or exit a trade, refrain from taking a trade, or add to an existing position. In this way, the indicator can be used to provide trade signals when it acts in a certain way.”
You can read more about the CCI, its use cases and calculations here .
How do traders use overbought and oversold levels in their trading?
The oversold level, that is traditionally when the CCI is above the 100 level is typically interpreted as being 'overbought', and below the -100 level is typically considered 'oversold'. Traders will often use the CCI at an overbought level as a confluence for entry into a short position, and the CCI at an oversold level as a confluence for an entry into a long position. These levels do not mean that price will necessarily reverse at those levels in a reliable way, however. This is why this version of the CCI employs the triple timeframe overbought and oversold confluence, in an attempt to add a more confluence and reliability to this usage of the CCI. While traditionally, the overbought and oversold levels are below -100 for oversold, and above 100 for overbought, he default threshold settings of this indicator have been increased to provide fewer, stronger signals, especially suited to the low timeframes and highly volatile assets.
What are divergences?
Divergence is when the price of an asset is moving in the opposite direction of a technical indicator, such as an oscillator, or is moving contrary to other data. Divergence warns that the current price trend may be weakening, and in some cases may lead to the price changing direction.
There are 4 main types of divergence, which are split into 2 categories;
regular divergences and hidden divergences. Regular divergences indicate possible trend reversals, and hidden divergences indicate possible trend continuation.
Regular bullish divergence: An indication of a potential trend reversal, from the current downtrend, to an uptrend.
Regular bearish divergence: An indication of a potential trend reversal, from the current uptrend, to a downtrend.
Hidden bullish divergence: An indication of a potential uptrend continuation.
Hidden bearish divergence: An indication of a potential downtrend continuation.
How do traders use divergences in their trading?
A divergence is considered a leading indicator in technical analysis , meaning it has the ability to indicate a potential price move in the short term future.
Hidden bullish and hidden bearish divergences, which indicate a potential continuation of the current trend are sometimes considered a good place for traders to begin, since trend continuation occurs more frequently than reversals, or trend changes.
When trading regular bullish divergences and regular bearish divergences, which are indications of a trend reversal, the probability of it doing so may increase when these occur at a strong support or resistance level . A common mistake new traders make is to get into a regular divergence trade too early, assuming it will immediately reverse, but these can continue to form for some time before the trend eventually changes, by using forms of support or resistance as an added confluence, such as when price reaches a moving average, the success rate when trading these patterns may increase.
Typically, traders will manually draw lines across the swing highs and swing lows of both the price chart and the oscillator to see whether they appear to present a divergence, this indicator will draw them for you, quickly and clearly, and can notify you when they occur.
Setting alerts.
With this indicator you can set alerts to notify you when any/all of the above types of divergences occur, on any chart timeframe you choose, and also when the triple timeframe overbought and oversold confluences occur.
Configurable pivot period.
You can adjust the default pivot period values to suit your prefered trading style and timeframe. If you like to trade a shorter time frame, lowering the default lookback values will make the divergences drawn more sensitive to short term price action. By default, this indicator has enabled the automatic adjustment of the pivot periods for 4 configurable timeframes, in a bid to optimise the divergences drawn when the indicator is loaded onto any of the 4 timeframes. These timeframes and the auto adjusted pivot periods on each of them can also be reconfigured within the settings menu.
Disclaimer: This script includes code adapted from the Divergence for Many Indicators v4 by LonesomeTheBlue . With special thanks.

Delta StochasticThis is the Stochastic Oscillator but now instead of reading it raw we sum the stochastic over a window and then take the cumulative sum of the difference. This allows us to have a much smoother representation of the stochastic while seeing the true momentum relative to it. I hope you can find this useful!
Refresher on Stochastic: Stochastics are range bound momentum oscillators. They calculate values between 0 and 1 which are usually plotted as 2 lines. These indicators are primarily used for identifying overbought and oversold conditions, line crossovers, divergences and increases in buying or selling pressure.

Stochastic Moving Average Convergence Divergence (SMACD)This is my attempt at making a Stochastic MACD indicator. To get this to work I have introduced a DC offset to the MACD histogram output. I figured that if theirs a Stochastic RSI their might as well be a Stochastic everything else! lmao enjoy. Honestly, from what I can tell it's even faster than Stochastic Smooth RSI.
The Stochastic Oscillator (STOCH) is a range bound momentum oscillator. The Stochastic indicator is designed to display the location of the close compared to the high/low range over a user defined number of periods. Typically, the Stochastic Oscillator is used for three things; Identifying overbought and oversold levels, spotting divergences and also identifying bull and bear set ups or signals
MACD is an extremely popular indicator used in technical analysis. MACD can be used to identify aspects of a security's overall trend. Most notably these aspects are momentum, as well as trend direction and duration. What makes MACD so informative is that it is actually the combination of two different types of indicators. First, MACD employs two Moving Averages of varying lengths (which are lagging indicators) to identify trend direction and duration. Then, MACD takes the difference in values between those two Moving Averages (MACD Line) and an EMA of those Moving Averages (Signal Line) and plots that difference between the two lines as a histogram which oscillates above and below a center Zero Line. The histogram is used as a good indication of a security's momentum
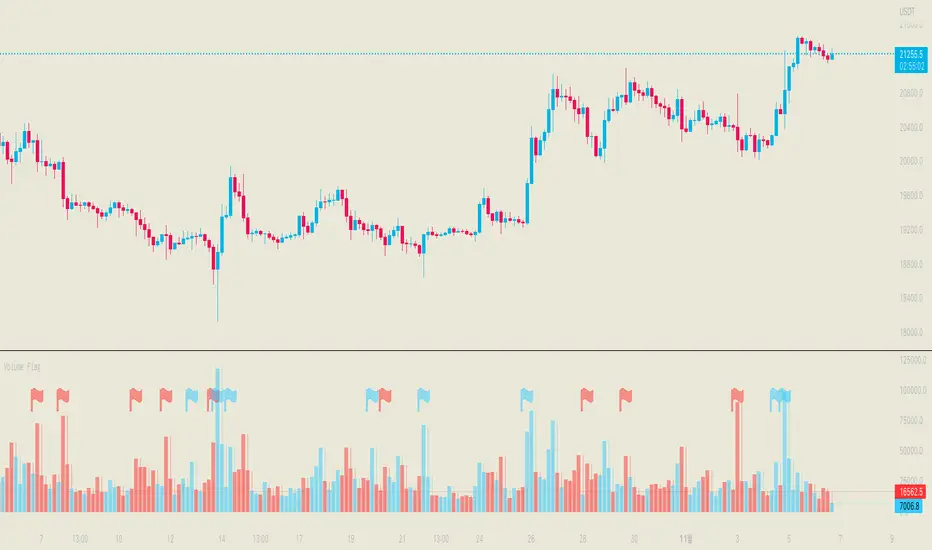
Volume FlagThis indicator shows the increased volume compared to the previous volume.
A flag is displayed when the trading volume increased by *n of the previous candle.
Receive a signal as an alert.
Thank you.
(Please comment and click on the rocket.)
-------------------
이 지표는 이전 캔들의 거래량 대비 증가된 거래량을 확인할 수 있습니다.
깃발을 사용하여 증가 감소를 확인할 수 있으며 n배 만큼의 증가 되었을때 표시됩니다.
그리고 깃발이 표시될 경우 알람을 받으실 수 있습니다.
감사합니다.
댓글과 로케트 클릭 부탁드립니다.
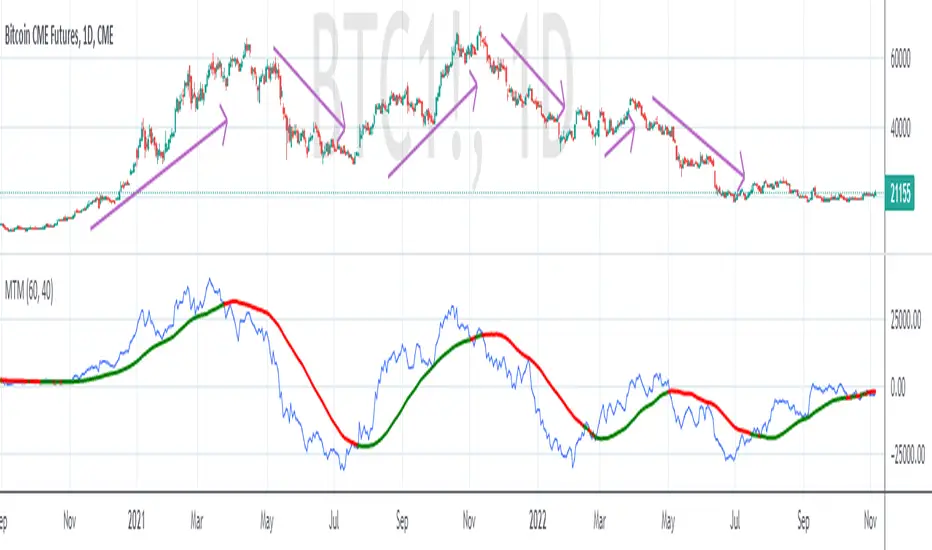
MTM - Momentum IndicatorMTM - Momentum
Description
The Momentum indicator is a speed of movement indicator that is designed to identify the speed (or strength) of price movement. This indicator compares the current close price to the close price N bars ago and also displays a moving average of this difference.
Category
Momentum Indicators
Parameters
N ( Default: 6 Min: 1 Max: 100 )
N1 ( Default: 6 Min: 1 Max: 100 )
Chart Script
MTM : CLOSE-REF(CLOSE,N);
MTMMA : MA(MTM,N1)
www.edgerater.com
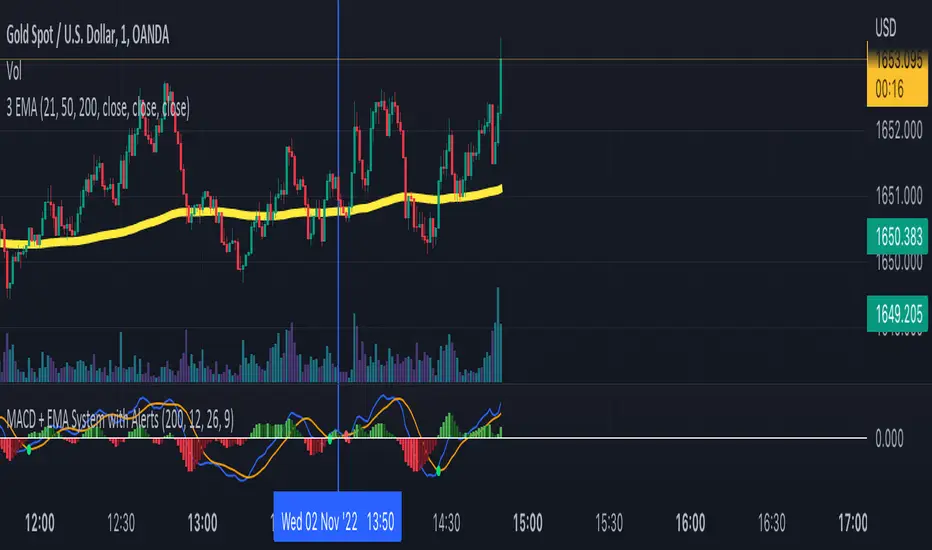
MACD + EMA System with AlertsSo I created the MACD Cross Strategy but not working alone by itself. I added EMA (Exponential Moving Average) filter to improve its winning rate so the MACD Signal only appears when in the same trend direction as Moving Average.
The Main Rules for Long Signal are:
- MACD Main Line Crossover the MACD Signal Line.
- The crossover happens below the MACD center line (0) so the momentum is strong.
- Price above the EMA 200 so it means the market is in a strong uptrend.
The Main Rules for Short Signal are :
- MACD Main Line Crossunder the MACD Signal Line.
- The crossover happens above the MACD center line (0) so the momentum is strong.
- Price below the EMA 200 so it means the market is in a strong downtrend.
The signal crossover & signal alert only generate as per the following rules above.
TMO ScalperTMO - (T)rue (M)omentum (O)scillator) MTF Scalper Version
TMO Scalper is a special custom version of the popular TMO Oscillator. Scalper version was designed specifically for the lower time frames (1-5min intraday scalps). This version prints in the signals directly on top of the oscillator only when the higher aggregations are aligned with the current aggregation (the big wheels must be spinning in order for a small wheel to spin). The scalper consist of three MTF TMO oscillators. First one is the one that plot signals (should be the fastest aggregation), second serves as a short term trend gauge (good rule of thumb is to us 2-5x of the chart time frame or the first aggregation). The third one (optional) is shaded in the background & should only serve as a trend gauge for the day (usually higher time frames 30min+).
Time Frames Preffered by Traders:
1. 1m / 5m / 30m - This one is perfect for catching the fastest moves. However, during choppy days the 1min can produce more false signals..
2. 2m / 10m / 30m - Healthy middle, the 2min aggregation nicely smooths out the 1min mess. Short term gauge is turning slowly (10min for a signal to confirm).
3. 3m / 30m / 60m - This TF is awesome for day traders that prefer to take it slow. Obviously, this combination will produce far less signals during the day.
Hope it helps.

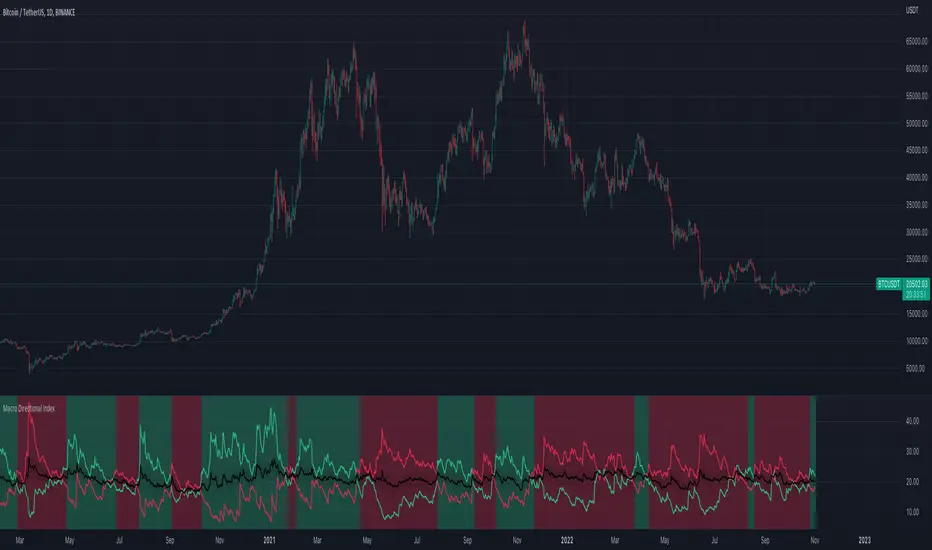
Macro Directional IndexCore to this indicator is the rate at which DI+ and DI- are moving away or towards each other. This is called The Rate of Change (ROC). The ROC length dictates how many bars back you want to compare to the current bar to see how much it has changed. It is calculated like this:
(source - source /source ) * 100
This indicator has 4 values in the status line:
DI+
DI-
Distance between DI+ and DI-
DI Rate of Change
DI Rate of Change
The rate of change is smoothed using an EMA. A shorter EMA length will cause the ROC to flip back and forth between positive and negative while a larger EMA length will cause the ROC to change less often. "Since the rate of change is used to indicate periods of 'consolidation', you want to find a setting that doesn't flip back and forth too often.
Directional Index Middle Channel
Between the DI+ and DI- is a black centerline. Offset from this centerline is a channel that is used to filter out false crosses of the DI+ and DI-. Sometimes, the DI+ and DI- lines will come together in this channel and cross momentarily before resuming the direction prior to the cross. When this happens, you don't want to flip your bias too soon. The wider the channel, the later the indicator will signal a DI reversal. A narrower channel will call it sooner but risks being more choppy and indicating a false cross."
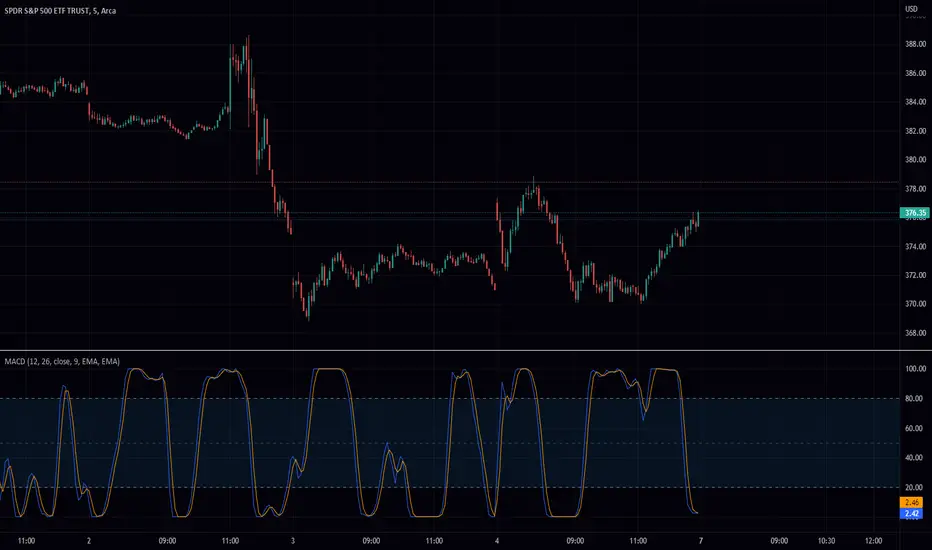
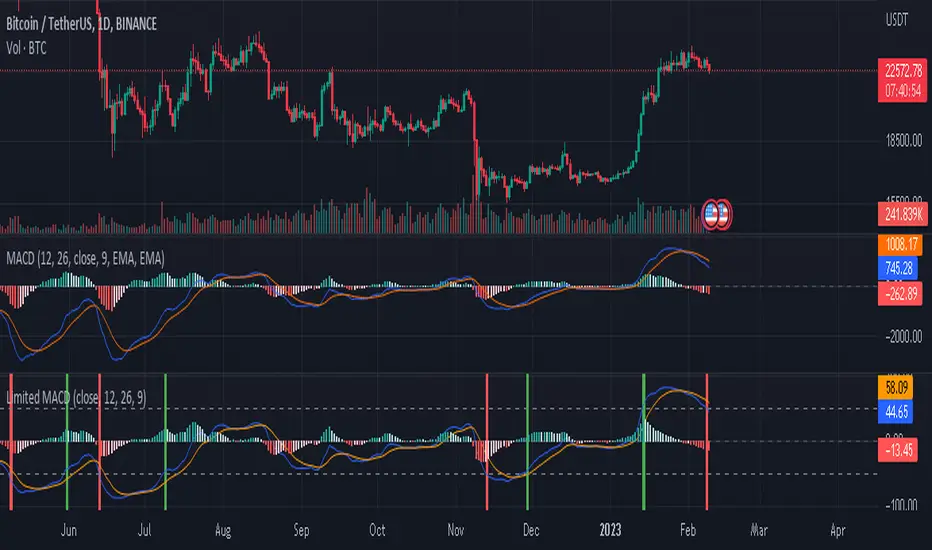
Limited MACDwhat is "Limited MACD"?
it is macd but it has some useful additional features.
what it does?
it takes limited values ??just like rsi. The highest value it can take is 100 and the lowest value is -100. this way it gets the same highs and lows for different symbols and time slots. which means we can set overbought and oversold values ??with it. he also paints candles according to their values. The closer the price is to the oversold values, the more red, and the closer to the overbought values, the greener.
how it does it?
macd values ??are limited by dividing by extreme values. The macd value is used as the variable for the color.rgb function, this is used to get a different color for each macd value.
how to use it?
The variables in the settings section are the same as standard macd.
Use the colors to identify overbought and oversold zones and to predict possible price reversal points. also the indicator will mark possible turning points. other than that, its use is similar to standard macd and its limits are up to your imagination.
four hour:
one hour:
five minute:
Rolling MACDThis indicator displays a Rolling Moving Average Convergence Divergence . Contrary to MACD indicators which use a fix time segment, RMACD calculates using a moving window defined by a time period (not a simple number of bars), so it shows better results.
This indicator is inspired by and use the Close & Inventory Bar Retracement Price Line to create an MACD in different timeframes.
█ CONCEPTS
If you are not already familiar with MACD, so look at Help Center will get you started www.tradingview.com
The typical MACD, short for moving average convergence/divergence, is a trading indicator used in technical analysis of stock prices, created by Gerald Appel in the late 1970s. It is designed to reveal changes in the strength, direction, momentum, and duration of a trend in a stock's price.
The MACD indicator(or "oscillator") is a collection of three time series calculated from historical price data, most often the closing price. These three series are: the MACD series proper, the "signal" or "average" series, and the "divergence" series which is the difference between the two. The MACD series is the difference between a "fast" (short period) exponential moving average (EMA), and a "slow" (longer period) EMA of the price series. The average series is an EMA of the MACD series itself.
Because RMACD uses a moving window, it does not exhibit the jumpiness of MACD plots. You can see the more jagged MACD on the chart above. I think both can be useful to traders; up to you to decide which flavor works for you.
█ HOW TO USE IT
Load the indicator on an active chart (see the Help Center if you don't know how).
Time period
By default, the script uses an auto-stepping mechanism to adjust the time period of its moving window to the chart's timeframe. The following table shows chart timeframes and the corresponding time period used by the script. When the chart's timeframe is less than or equal to the timeframe in the first column, the second column's time period is used to calculate RMACD:
Chart Time
timeframe period
1min 🠆 1H
5min 🠆 4H
1H 🠆 1D
4H 🠆 3D
12H 🠆 1W
1D 🠆 1M
1W 🠆 3M
You can use the script's inputs to specify a fixed time period, which you can express in any combination of days, hours and minutes.
By default, the time period currently used is displayed in the lower-right corner of the chart. The script's inputs allow you to hide the display or change its size and location.
Minimum Window Size
This input field determines the minimum number of values to keep in the moving window, even if these values are outside the prescribed time period. This mitigates situations where a large time gap between two bars would cause the time window to be empty, which can occur in non-24x7 markets where large time gaps may separate contiguous chart bars, namely across holidays or trading sessions. For example, if you were using a 1D time period and there is a two-day gap between two bars, then no chart bars would fit in the moving window after the gap. The default value is 10 bars.
//
This indicator should make trading easier and improve analysis. Nothing is worse than indicators that give confusingly different signals.
I hope you enjoy my new ideas
best regards
Chervolino

Multi-Indicator Divergence ScreenerHere is a new screener for everyone.
I have applied my Better Divergence On Any Indicator logic to scan 3 different indicators and up to 6 different assets at one time. Shoutout to LonesomeTheBlue and QuantNomad for their respective work on divergence and scanner scripts. I've implemented similar logic to put together this scanner.
So far, I have added support for RSI, OBV, MACD, MFI, Stochastic, and FSR, though I'm happy to add more by request. Please note, for simplicity, I have removed the logic to filter for only overbought/oversold divergences. Because this can scan both centered oscillators and non-centered indicators, overbought/oversold does not apply to all of them. I may try to find a way to work in back in later, as time allows.
Personally, I like to find confluences different types of indicators. For instance, agreeable divergence with a centered strength oscillator like RSI and a volume based indicator like OBV gives me more confidence that there will be follow-through.
Like in the Better Divergence script, you can opt to scan for confirmed divergences, potential divergences, or both.
You have the option to show or hide a table that will tell you exactly which assets have divergence, on which indicator they were found, and how many points of divergence were identified. By default, bull divergences will be green, bear will be red, but you can change these base colors to your liking. Confirmed divergences are shown with a solid background, while potentials (if selected) are shown with transparent background. If all 3 of your chosen indicators have divergence in the same direction, the asset name will show in the bull or bear color to highlight the confluence.
Alerts have also been set up to fire on bar close. The message will essentially tell you the same thing the table does, but in condensed format.
You can choose to have alerts fire any time there is any divergence detected across all assets, only when there are divergences on at least 2 of the chosen indicators for a given asset, or limit them to only when all 3 indicators show divergence in agreement.

Know Sure Thing - Weekly Candle VersionKnow Sure Thing - Plotted on weekly candles (source from Martin Pring)
Developed by Martin Pring, Know Sure Thing (KST) is a momentum oscillator based on the smoothed rate-of-change for four different timeframes.
Modifications:
Arrows representing long/short signals based on the timeframe (S for short term, M for mid term, L for long term)
