Candle Mania [starlord_xrp]This indicator locates and places markers on known bullish and bearish candles. All candles can be turned on/off in the settings. It also has a setting to display RSI/MFI/Stoch RSI indications of oversold and overbought areas in the background showing areas of higher interest. The last feature is a setting that allows you to see where Heiken-Ashi has switched from green to red and vice-versa. Please let me know if there is anything that you would like to see added or any improvements.
Candlestickpattern

DojiCandle body size RSI-SMMA filter MTF
DojiCandle body size RSI-SMMA filter MTF
Hi. I was inspired by a public script written by @ahmedirshad419, .
I thank him for his idea and hard work.
His script is the combination of RSI and Engulfing Pattern.
//------------------------------------------------------------
I decided to tweak it a bit with Open IA.
I have changed:
1) candle pattern to DojiCandle Pattern;
2) I added the ability for the user to change the size of the candlestick body;
3) Added SMMA 200;
4) Changed the colour of SMMA 200 depending on price direction;
5) Added a change in the colour of candlesticks, depending on the colour of the SMMA 200;
6) Added buy and sell signals with indicator name, ticker and close price;
7) Added ability to use indicator on multi time frame.
How it works
1. when RSI > 70 > SMMA 200 and form the bullish DojiCandle Pattern. It gives sell signal
2. when RSI < 30 < SMMA 200 and form the bearish DojiCandle Pattern. It gives buy signal
settings:
basic setting for RSI, SMMA 200 has been enabled in the script to set the levels accordingly to your trades
Enjoy

Pin Candle DetectionPin candles are a variation of hammer candles that are useful in technical analysis . In particular, when combined with volume profile studies, they can be a powerful set up for long entries or other decision making.
For example, when looking at volume profiles, a long entry would be a fair value area (i.e. 40%) below the close of a pin candle. When combined with a support level , the set up is stronger.
While most scripts look for hammer candles, pin candles are somewhat different in that the length of the wick is significant.
This script and its parameters was built for ES futures 15 min chart in mind.
This script is unique in that it allows for the below parameters to be adjusted to suit other instruments and timeframes:
1. Fib level: Candle must close within a certain retracement level). My preference is 0.55. Some traders like 0.5, while others prefer 0.33
2. Wick length: Pin candles differ from pure hammers in that the length of the wick must be significant. My preference is 7 points on ES (as in $ and not ticks)
Add this script to your alerts to no longer miss these set ups.

Strongest Supports And ResistancesDraws the best support and resistance lines. How it works:
1) Tries every possible line through lows, highs, opens, closes
2) Finds the total hit counts given the confidence interval as input to the candlesticks
3) Calculates the strength of every line according to hit count, total volumes on hits, and timestamps
4) Eliminates similar lines, confidence interval is set as input
5) Selects the strongest 20(changable as an input) lines and draws them on the graph.
Makes your work way easier!!!
Feel free to adjust the parameters for your own style!
Cheers!!

Detect BOS in Five Candles with MTF - Alert [MsF]Japanese below / 日本語説明は英文の後にあります。
-------------------------
*This indicator is based on azmathshah's "Last Three Candles each of Two HTF".
It's a very cool indicator. thank you.
You can detect trend reversal with candlesticks.
It's MTF compatible and can display up to 2 sets of 5 candles of any time frame on the right side of the chart.
By displaying the candles of the upper time frame bars, you can check the trend change and measure the entry timing with the lower time frame bars.
There are two types of alerts.
"Liquidity Sweep": This is an alert when the upper beard (high) of ③ is touched with the next foot.
"Candle Close": An alert when the upper whisker (high) of ③ is exceeded by the closing price of the next bar (generally a strong signal)
-------------------------
ローソク足でトレンド転換を検知するインジケーターです。
MTF対応となっておりチャートの右側に任意タイムフレームのローソク5本を最大2セット表示できます。
上位足のローソクを表示することにより、トレンド転換確認しながら、下位足でエントリータイミングを計ることができます。
アラートは2種類あります。
"Liquidity Sweep":③の上ヒゲ(high)を次の足でタッチした場合のアラートです
"Candle Close":③の上ヒゲ(high)を次の足の終値で上回った場合のアラートです(一般的には強力なシグナルとなります)

ChitukiProduced according to Bitcoin and Ethereum 1D, 1W, and 1M candle charts.
When you use it for general stock charts or altcoins, make sure to backtest it thoroughly before using it.
*To facilitate backtesting, this have a vertical line that allows you to easily specify the start time.😍
This indicator is simply based on the Engulfing patterns.
I focused on finding inflection points and wrote them based on 1D chart.
▲▼ Small and fat arrows: Displays simple engulfing patterns.
(Displays only those whose lengths differ by at least 1.2 times from each other)
↑↓ Slim and long arrows: Displays actual trading. (Backtesting reflects this.)
Compare the 7 lowest points to find the bullish Engulfing .
Compare the 14 highest points to find the Bearish Engulfing .
Switch the long and short positions to each other.
Long/short position entry at the market price, mid-price, and closing price of Engulfing Candles.
The charts from 2014 to January 2023 were back-tested and the error ranges were calculated and adjusted in detail.
In conclusion, you can think of it as an Engulfing Pattern Finder tailored to the Bitcoin chart.
This is how I did trading before I made this indicator, and I programmed the trading method as an indicator and I think it's pretty reliable but...
Please don't blindly trust ONLY the indicator(s).
///Properties setting Recommend///
Base currency : USD
Oder size : 18% of equity
Pyramiding : 21 (in plenty / Bcuz one deal is divided into three times.)
Commission : according to the exchange's commission
Recalculate : None
Margin : never less than 50%

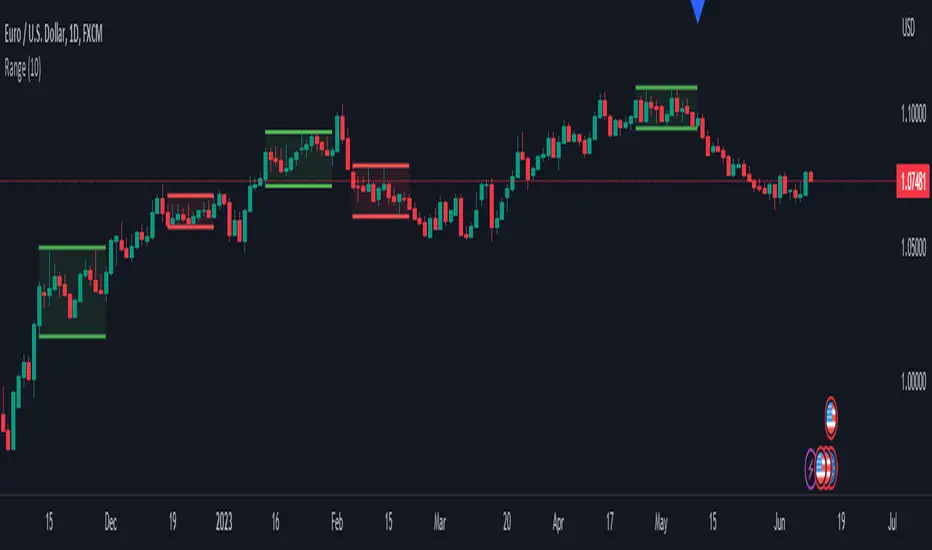
Range DetectionThis is a simple indicator to find the sideways market or ranging market.
It is mainly focused on BTCUSD as BTCUSD doesn’t make big moves each and every candle. It makes big breakouts with one candle and then goes sideways for a longer period of time.
So, this indicator identifies those big candles and plots high and lows of those big candles using lines. New range is created only when new candles close above or below previous major candles high or low.
The Candle Hunter Candlestick Pattern - by Karoshi TradingThe Candle Hunter Indicator - by Karoshi Trading
The Candle Hunter Indicator is based on specific Candlesticks and Patterns.
Activating this indicator will mark all specific Bullish & Bearish Candles on the Chart.
Depending on your settings, not all candles will be displayed on the chart.
The goal of this indicator is, to highlight all the important trending candles and ignore all ranging candles.
This can be helpful for rejecting/bouncing zones or S&R Levels. Or even if you like to trade reversals, you do not want to trade it on low volume ranging candles.
This indicator should only be used as a supplementary tool while trading, not as a stand alone.
Which Candles & Pattern will be marked on the chart?
1# Pinbar / Hammer (multiple Variations)
2# Marubozu Candles (multiple Variations)
3# Engulfing Candles (Multiple Variations)
How does this indicator works?
First of all, the indicator has to calculate 3 different parameters, before marking one of the given candle. To do so, we will need the average volume, average candle size and the specific candles.
1st Parameter: Defining the needed Candles
First of all, the indicator will calculate, based on the opening & closing price and also the wick (range of each candle). If one of the calculation is a match, for the mentioned candles above, we come to step 2.
2nd Parameter: Average Candle Size
The next one is the size of each candle, compared to the average candle on the chart.
You can customize the settings, but in this example, we want the specific candle be at least 1.5 times the size of the average last 14 candles.
3rd Parameter: Average Volume
The indicator will now calculate the average volume of the last selected candles period (default settings = 14) and compare it to the current candle. In this example, the current candle should be at least 1.5 times the average volume.
The indicator provides two possibilities to calculate the average volume:
1# Volume MA = Volume Moving Average
2# Volume SA = Volume Simple Average
Result: Colorizing the given Candle
After all parameters were met, the indicator will colorize and mark with a label + name all the candles on the chart.
Special Settings:
1st The Engulfing Candles, have 3 different options:
1# Classic = Only the body of the previous candle has to be engulfed by the current candle
2# Reinforced = The full candle + wick of the previous candle has to be engulfed
3# Multiple Candles = Minimum 3 previous candles has to be engulfed to be marked on the chart
The numbers of candles are changeable and you can have all 3 options simultaneously active.
That means, that the code will check all 3 options to see if there is a match.
2nd Marubozu Candle
You can set the ratio between body compared to wick in the settings. Depends if you want full marubozu candles or also the variations of it.
3rd Hammer Wick
You can decide how much bigger the wick should be, compared to the body of the candle. The default settings are set on 1.5 times.
You can also set the position of the body. As example if the settings are set on 30%, the body of the hammer should be on the upper half of a bullish hammer or the lower 30% of the candle if bearish.

Three Bar Gap (Simple Price Action - with 1 line plot)This script is tailored towards experienced traders who prefer to view raw price charts during live execution. It searches for a three-bar pattern of what is colloquially called "fair value gap", or "imbalance" and uses a single line to plot the results. The goal is to display price in a way that is as simple as possible so that chart readers who don't prefer to add indicators on their screen will still find this indicator as an acceptable option to consider for.
From a code perspective, this script explores a new PineScript feature called UDT (user-defined types). This is an incredible update because it brings developers one step close to having the ability to create abstract data types.
█ What is price action?
Experienced traders will tell you that the chart that they use for live execution is raw, clean, and uses no indicators. They say they execute on price action, so what exactly is price action?
There is no formal definition to it, but one can agree that it implies the process of analyzing price without considering the fundamentals, without needing to know what the news was about, and without needing to know any of the Greeks (except for the desire to “seek alpha” Ha.haa...). This is not to say that price action traders are executing in their own vacuums without the need to know what is happening around the world. Surely fundamentals and financial models can be used beforehand for developing a bias for what is being traded, but it’s price-first at the moment of execution. That said, Factor (A) is Price.
Factor (B) is time-perception, it’s how the trader reads the tape. How the trader perceives price to change with respect to time is valuable information. Interpretation of "time" will be elaborated in the next section that talks about candlestick patterns detected by this script.
Putting this together, price action means the analysis of price movement by only considering (A) price, and (B) time, to predict which direction the market will move. A speculative trader is timing the market with the expectation to make a quick in-and-out profit; she/she is using price action. On the other hand, a long term investor holding a diversified portfolio with a strategy based on modern portfolio theory combined with fundamental analysis (at this point candlesticks are irrelevant) but has one additional criteria of, say, can only go Long on a stock when it has closed Green on Daily; he/she is also considered to be executing on price action.
█ Candlestick patterns
This script calculates the displacement of highs and lows over three consecutive bars.
A) Down move = When High of the recent confirmed bar is lower than the Low of the previous-previous candle
B) Up move = When Low of the recent confirmed bar is higher than the High of the previous-previous candle
(Note that its the confirmed bar that is being talked about, so it does not repaint)
An ATR filter will be applied to reduce the number of lines generated as many times they might just be associated with minor price changes.
Interpretations:
When price moves quickly across three bars, it can be thought that it has gapped. Although the candle in the middle appears to be solid, it’s not from a conceptual perspective. This is because time itself is arbitrary; timeframes don’t necessarily have to be fixed intervals. Take stocks with regular trading hours for example, if price makes a breakaway gap and you bundle the after-hours and pre-market sessions together as one candle, never minding that intervals should be fixed, then you will see the exact three-bar-gap patterns. Similar happens during intraday sessions on lower timeframes, if you zoom-in closer, you’ll see that ticks within the middle candle are sparsely dispersed. This is why it's called a gap.
█ Parameters with fixed inputs & assumptions used:
ATR is used for filtering out minor movements that will likely be deemed as irrelevant by trader for the purpose of live execution. The following inputs are required:
A) ATR lookback period
B) Multiplier
The product of ATR(len=A) and B produces a threshold for minimum distance that price must gap by. Initially, it was proposed to be only based on one ATR, but often an ATR is too wide and using it will filter out too many lines. Because of this observation, a multiplier (Parameter B) has been introduced to allow users to apply fractional ATR as a threshold.
█ Applications:
For trend followers: Follow the direction of the gap. Entering above recent high/low points above/below the first impulse with a stop-limit order is a viable tactic.
For contrarians fading a trend: The mid-point is a good point of reference for predicting potential areas of support/resistance.

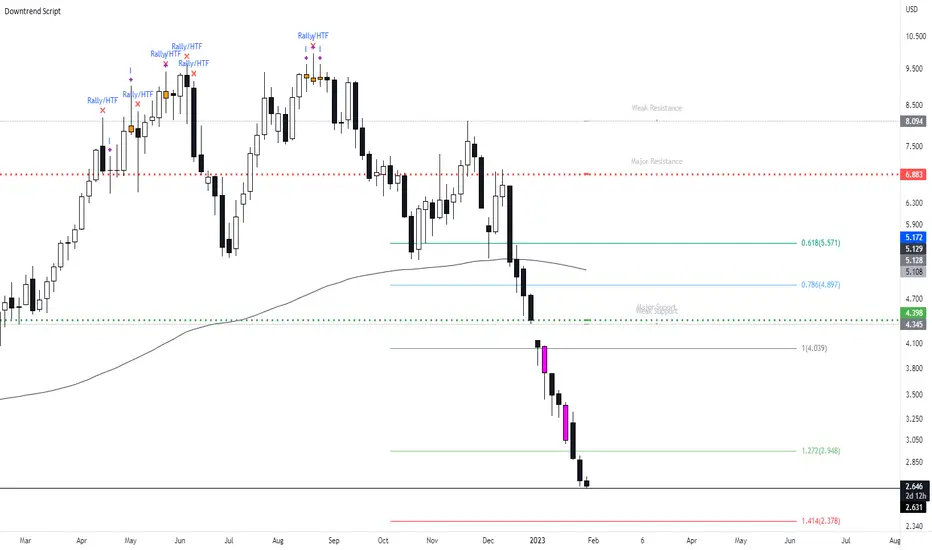
New Bearish Downtrend Script - Perfect for Short SellingIts been a while since i last uploaded a script, what i have for you today is a script which works very efficiently for downtrends and spotting reversals. This is a script i use on a weekly basis when looking to short sell.
This script includes :
Updated** Rally Candles for HTF and LTF ( End of Impulsive move signal) - The psychology of the candle when used with market information can be viewed as a end or near to the end of a big impulsive leg - when this candle occurs in BEARISH CONDITIONS, we can assume price is likely to move away short term.
Major and Minor Support Levels HTF (Areas of interest)
The Psychology on these levels is price will do something at these key levels - it takes in the last quarter price action of High Open Low Close to generate the price levels and when price comes into these areas we are likely to see a bounce or rejection from this area.
Bearish Breakout Volume Candle - This candle will paint a Purple colour bar when volume breaks above the 7day average - this shows strong momentum in the market and will usually be seen when price is in a downtrend with strong momentum.. However when this does occur we can expect a short term bounce or base so don't trade the volume bar alone.
Indecision Candles - Psychology of this candle is to show exhaustion in the trend and ideally what to see this candle appear with Rally Candles at key areas for stronger set up. When the trend is moving up, the bearish doji can appear - i tend to look at this situation as a pause in the trend.
200 EMA
Everything in this script has alert conditions to provide an edge in the markets
This is an example of how the script will look on the HTF I'm using the Daily Timeframe for reference on TSLA
This is an example of how the script looks like on the LTF, price hit the Major Resistance twice and failed to hit the 3rd time and on each leg of the impulse, the chart portrayed the LTF Rally Candles
Heres an example on how to use both Major Resistance ( Area of Interest) Rally Candle and Volume Breakout as a trade set up idea - This setup idea was on Crude Oil last week and into this week.
When added to confluences such as Supply Zones, Mitigation Levels, Quasimodo patterns etc... this will enhance the script.
I will answer any questions if i haven't made the script clear or take any requests to improve the script.
Also will be uploading the Bullish Uptrend Script soon.
RSI TREND FILTERRSI TREND Filter on Chart
RSI scaled to fit on chart instead of oscillator, Trend Analysis is easy and Hidden Divergence is revealed using this indicator. This indicator is an aim to reduce confusing RSI Situations. The Oversold and Overbought lines help to determine the price conditions so its easy to avoid Traps.
Oversold and Overbought conditions are marked on Chart to make it useful to confirm a Buy or Sell Signals.
RSI 50 level is plotted with reference to EMA50 and Oversold and Overbought Conditions are calculated accordingly.
Uptrend: RSI Cloud / Candles above RSI 50 Level
Down Trend: RSI Cloud / Candles below RSI 50 Level
Sideways : Candles in the Gray Area above and below RSI 50 Level
Default RSI (14) : is the Candlestick pattern itself
Disclaimer: Use Solely at your own Risk.

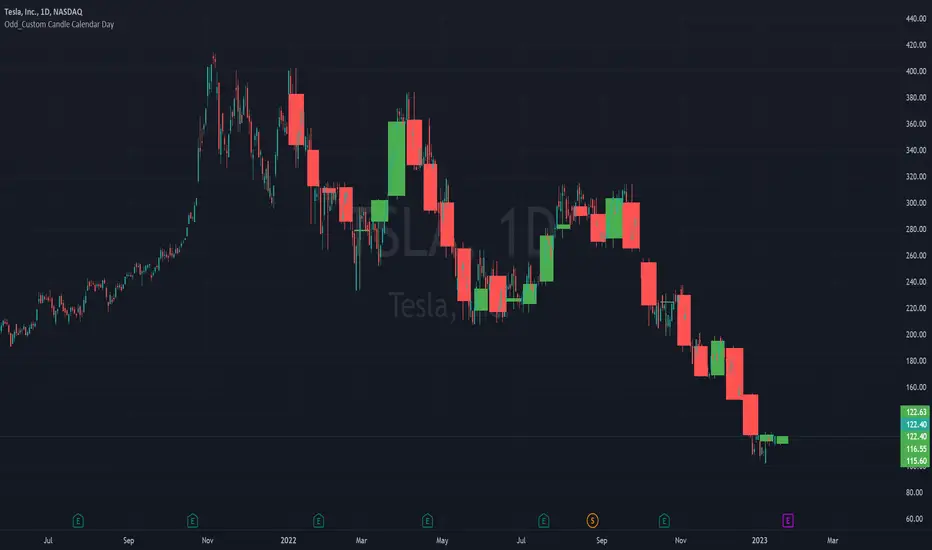
Odd_Custom Candle Calendar DayEver wonder how candles would look on a chart if they were tracked by calendar day instead of market days?
Option(s)-
📅Custom start date for candle formation
✖️Candle multiplier
🌈Up / Down Colors
Features-
📋Displays candle data with invisible plots
Use Move to Existing Pane to Overlay on chart.
Can only display a max of 500 candles!
Simple STRAT Tool by nnamWhat this Indicator Does
This indicator is a very simple tool created specifically for experienced Straters. It was created for those Straters who fully understand the 1-2-3 Strat Scenarios, are in need of an easy to use tool, and do not want or need a lot of messy markings on their chart.
The indicator simply allows the user to color code the Strat 1, 2 ,3 (Inside /Outside /Up / Down) Bars as desired and by default extends lines to the right of the chart from the Highs and Lows of the previous 2 Bars giving the user a simple reference for Strat scenario structure breaks.
As shown above, the bars are color coded, but the original bar color is maintained via the border and wick.
If a bar is an Outside Bar or an Inside Bar, it is still easy to identify whether or not the bar was a Bullish or Bearish 1 or 3.
The same goes for 2UP and 2Down Bars - It is easy to identify Bullish or Bearish UP or DOWN Bars.
Optionally, as show in the screenshot below, the user can extend the lines in both directions to get an "at a glance" better understanding of where price is currently vs previous support and resistance areas.
For Straters that prefer to trade only INSIDE BAR BREAKOUTS there is an optional input setting labeled "Trade Inside Bars ONLY".
This setting turns OFF the lines that extend from the 2nd previous bar back and only displays and extend lines from the previous bar IF and ONLY IF the current bar is an INSIDE (one) bar. .
The User Input settings allow for the following customizations:
1. Custom Outside Bar Color
2. Custom Inside Bar Color
3. Custom 2 Up Bar Color
4. Custom 2 Down Bar Color
5. Turn ON or OFF color coded bars
6. Trade only INSIDE Bar Breakouts
7. Extend Lines Both Directions
8. Hide all Lines
The customizable settings above allow the user to hide all lines and turn OFF color coding without having to fully remove the indicator from the chart. This is convenient when the user has another indicator that uses color coded bars or the lines conflict with another indicator and they need to be temporarily disabled.
If you have any questions regarding this indicator please let me know. If you have any suggestions for minor tweaks to the indicator do not hesitate to ask for them.
I hope you enjoy this indicator and get some usefulness from it... HAPPY TRADING!!
The Ganesh TrendThe Ganesh Trend is an indicator developed by Ganesh to help Traders to identify potential trend showing candle .This indicator identifies bullish and bearish candle with some specific rules. This gives fair idea of direction of market .It is very helpful if you use it on Nifty 50 index . Candlestick developed by me is my original work . It is very helpful for new traders looking for proper entry and exit . It has stop loss and target as well . red dot shows the stop loss and green dot shows the target . taking 2-3 trades a day is good . Thank You . NSE:NIFTY

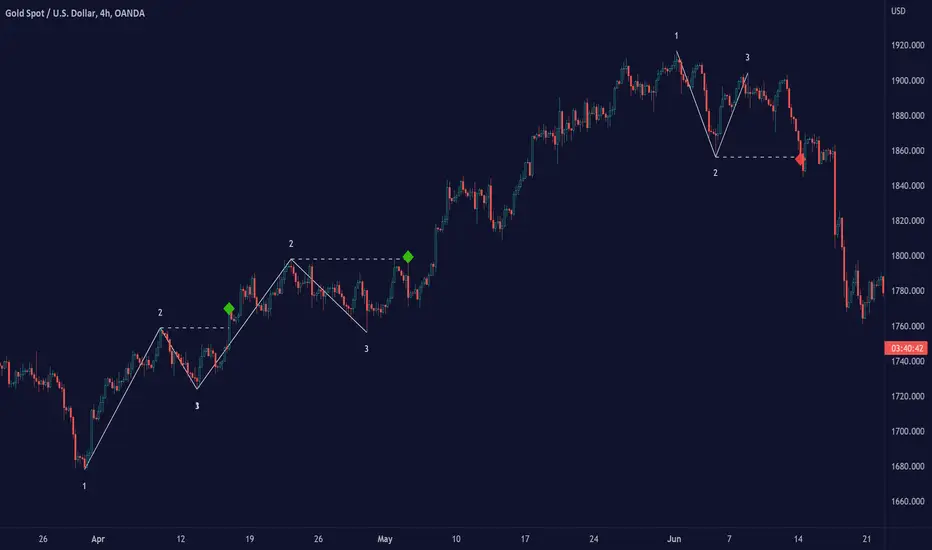
Ross Hook Pattern (Expo)█ Overview
The Ross Hook pattern is one of the most consistent and successful trading patterns that have been around for years. The Ross Hook is the first correction following the breakout of the 1-2-3 formation . This means that the Ross Hook only occurs in established trends. In other words, Ross Hook is a trend continuation setup. To fully understand the Ross Hook formation, you must understand the 1-2-3 pattern .
Ross Hook Pattern (Expo) is an indicator designed to detect the Ross Hook formation automatically and in real-time in any market and timeframe. With the inbuilt alert feature, the Ross Hook Pattern (Expo) Indicator analyzes the market for you and notifies you when the Ross Hook formations have been found.
█ How to use
Use this indicator to identify the Ross Hook pattern and to find good trend continuation setups. The formation can be used to determine when a trend is confirmed and established.
-----------------
Disclaimer
The information contained in my Scripts/Indicators/Ideas/Algos/Systems does not constitute financial advice or a solicitation to buy or sell any securities of any type. I will not accept liability for any loss or damage, including without limitation any loss of profit, which may arise directly or indirectly from the use of or reliance on such information.
All investments involve risk, and the past performance of a security, industry, sector, market, financial product, trading strategy, backtest, or individual's trading does not guarantee future results or returns. Investors are fully responsible for any investment decisions they make. Such decisions should be based solely on an evaluation of their financial circumstances, investment objectives, risk tolerance, and liquidity needs.
My Scripts/Indicators/Ideas/Algos/Systems are only for educational purposes!

1-2-3 Pattern (Expo)█ Overview
The 1-2-3 pattern is the most basic and important formation in the market. Almost every great market move has started with this formation. That is why you must use this pattern to detect the next big trend. In fact, every trader has used the 1-2-3 formation to detect a trend change without realizing it.
Our 1-2-3 Pattern (Expo) indicator helps traders quickly identify the 1-2-3 Reversal Pattern automatically. By analyzing the price action data, the indicator shows the pattern in real-time. When the pattern is discovered, the 1-2-3 Pattern (Expo) Indicator notifies you via its built-in alert feature! Catching the upcoming big move can't be that much simpler.
█ How to use
The 1-2-3 pattern is used to spot trend reversals. The pattern indicates that a trend is coming to an end and a new one is forming.
-----------------
Disclaimer
The information contained in my Scripts/Indicators/Ideas/Algos/Systems does not constitute financial advice or a solicitation to buy or sell any securities of any type. I will not accept liability for any loss or damage, including without limitation any loss of profit, which may arise directly or indirectly from the use of or reliance on such information.
All investments involve risk, and the past performance of a security, industry, sector, market, financial product, trading strategy, backtest, or individual's trading does not guarantee future results or returns. Investors are fully responsible for any investment decisions they make. Such decisions should be based solely on an evaluation of their financial circumstances, investment objectives, risk tolerance, and liquidity needs.
My Scripts/Indicators/Ideas/Algos/Systems are only for educational purposes!
Three Bars Play Strategy [JoseMetal]============
ENGLISH
============
- Description:
This strategy is based on two simple candlestick patterns (you can pick between 2 variants) with an extra option to require trigger candles to be opposite to the closing one (explained below).
There are several customizable settings such as take profit, stop loss and break even (all based on ATR).
You can customize starting and ending date for the testings.
Other options such as allow switch position if strategy SHORTs when you are LONG and vice versa.
There's an additional optional EMA filter.
- LONG / SHORT ENTRY:
Original pattern: for LONG, current candle must close ABOVE the HIGH of previous candle and the candle 3 positions back, opposite conditions for SHORT.
Variant pattern: for LONG, the current candle must close ABOVE the HIGH of the previous candle and the candle before that one too, opposite conditions for SHORT.
Optional: require the trigger candles to be opposite, ex: for LONG you need the previous candles to be RED (bearish).
Optional: EMA filter, price must be ABOVE for LONGs, below for SHORTs.
- EXIT CONDITION:
Stop Loss or Take Profit, based on ATR.
- Visual:
The script prints the Take Profit as a GREEN line, Stop Loss as a RED line and entry price with a WHITE line.
If enabled, the Break Even required price is BLUE, and the new Stop Loss level (for break even or protecting profit) is AQUA.
- Recommendations:
This strategy is great on DAILY on most assets, including crypto, forex and gold.
12H seems to work in most cases, lower timeframes are worse.
- Customization:
You can customize indicator settings (ATR, EMA...).
Stop Loss and Take Profit ATR multipliers are also customizable.
The break even is optional, required level and break even levels (also based on ATR) are custom too.
Almost everything is customizable, for colors and plotting styles check the "Style" tab.
Enjoy!
============
ESPAÑOL
============
- Descripción:
Ésta estrategia se basa en dos patrones simples de velas (puedes elegir entre 2 variantes) con una opción extra para requerir que las velas de activación sean opuestas a la de cierre (se explica más adelante).
Hay varios ajustes personalizables como el take profit, el stop loss y el break even (todos basados en el ATR).
Puedes personalizar la fecha de inicio y finalización de las pruebas.
Otras opciones como permitir el cambio de posición si la estrategia cambie a SHORT cuando está LONG y viceversa.
Hay un filtro de EMA opcional adicional.
- ENTRADA LARGA / CORTA:
Patrón original: para LONG, la vela actual debe cerrar POR ENCIMA del ALTO de la vela anterior y de la vela 3 posiciones atrás, condiciones opuestas para SHORT.
Patrón variante: para LONG, la vela actual debe cerrar POR ENCIMA del ALTO de la vela anterior y la vela anterior a esa también, condiciones opuestas para SHORT.
Opcional: requiere que las velas de activación sean opuestas, por ejemplo: para LONG requiere que las velas anteriores sean ROJAS (bajistas).
Opcional: fltro EMA, el precio debe estar POR ENCIMA para los LONGs, por debajo para los SHORTs.
- CONDICIÓN DE SALIDA:
Stop Loss o Take Profit, basado en el ATR.
- Visual:
El script dibuja el Take Profit como una línea VERDE, el Stop Loss como una línea ROJA y el precio de entrada con una línea BLANCA.
Si está habilitado, el precio de break even requerido es AZUL, y el nuevo nivel de Stop Loss (para el break even o asegurar ganancias) es CELESTE.
- Recomendaciones:
Ésta estrategia es estupenda en DIARIO en la mayoría de los activos, incluyendo criptos, fórex y oro.
En 12H parece funcionar en la mayoría de los casos, las temporalidades inferiores son peores.
- Personalización:
Puedes personalizar la configuración de los indicadores (ATR, EMA...).
Los multiplicadores de Stop Loss y Take Profit ATR también son personalizables.
El break even es opcional, el nivel requerido y los niveles de break even (también basados en ATR) son personalizables también.
Casi todo es personalizable, para los colores y estilos de trazado compruebe la pestaña "Estilo".
¡Que lo disfrutes!

Candlestick - Kicker PatternNot many candlestick patterns hurt traders on the other side of the trade more than this signal, when it happens, think of it as kicking in the teeth, the pain is real.
An upwards signal is painted when you have a two-bar formation, the one on the left is a bearish one whereas the successive one is bullish, when you have fat bodies in both candles, meaning the open is close to the high and the close is close to the low for the first candle, while the open is close to the low and the close is close to the high for the adjacent candle, the pain is ever more excruciating, the other important condition is the open of the first candle must be lower than the open of the latter one.
The downwards signal is vice versa of the upwards signal.
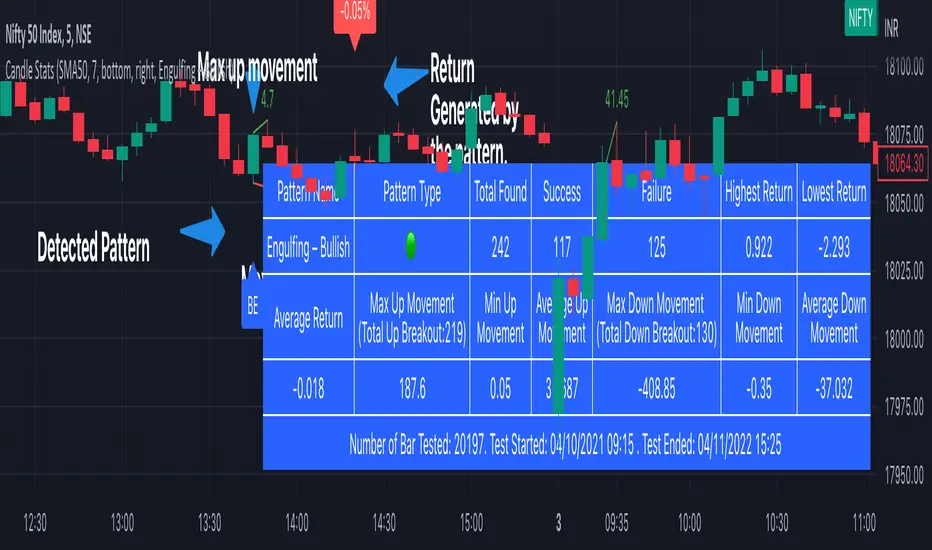
Candlestick Stats [tanayroy]The script detects candlestick patterns and stats related to the pattern. We have included 44 candle patterns to select. You can get stats for any timeframe and holding period. If a particular pattern is not available, the script will give an error.
What is available.
You can view the composite stat in the table panel.
Pattern Name: The pattern name
Pattern Type: Bullish(🟢)/ Bearish(🔴)/ Neutral(⚫)
Total Found: Number of time pattern appeared in the chart
Success: Number of time the pattern generated a positive return
Failure: Number of time the pattern generated a negative return
Highest Return: Highest return generated by the pattern (assuming trade taken at the open of the next candle and closed at the close price of the last candle of the holding period).
Lowest Return: Lowest return generated by the pattern
Average return: Average return generated by the pattern
Total Up Breakout: Number of time patterns take an up breakout(break above high).
Max Up Movement: Maximum up movement recorded by the pattern(distance between pattern high and highest high candle in given holding period).
Min up movement: Minimum up movement recorded by the pattern.
Average Up Movement: Average up movement recorded
Total Down Breakout: Number of time patterns take a down breakout(break below low).
Max Down Movement: Maximum down movement recorded by the pattern.
Min Down Movement: Minimum down movement recorded by the pattern.
Average Down Movement: Average down movement recorded
You can find the number of bars tested, start date and end date in the panel.
You can visually inspect the candle pattern performance in the chart.
Available options:
Detect Trend: You can detect trends based on SMA 50, SMA 50/200 or No detection.
Stat bars: Holding period after detecting the pattern.
Panel position: Position the stat table as per your choice.
Select pattern: Select available predefined pattern.
Label color: choose color according to your choice.
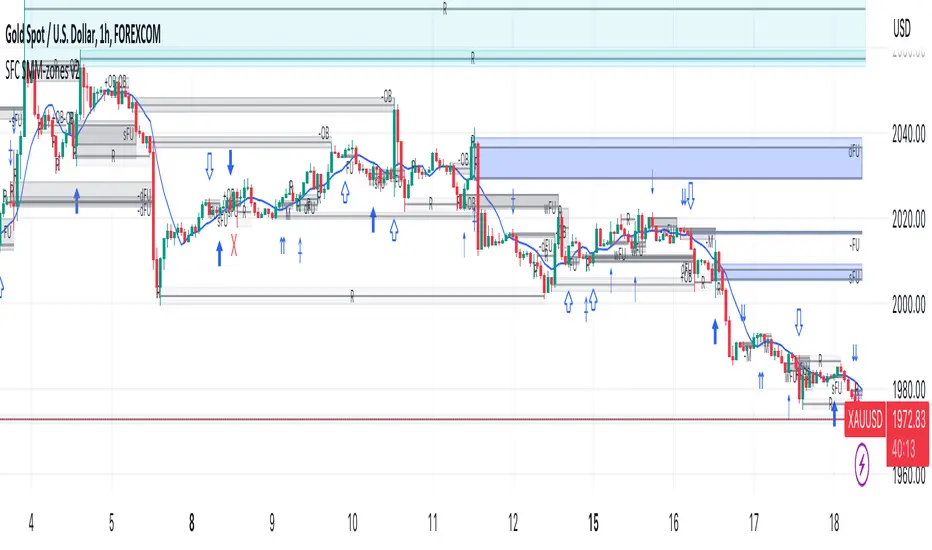
SFC Smart Money Manipulation - MTF ZonesThis indicator shows the most important manipulated zones - true support and resistance.
The indicator can show the zones from different time frames - 1H, 4H, D and the current TF.
Order Block definition - small candle or few consecutive candles, where banks place buy and sell orders in order to manipulate the price. After price is manipulated and moved in one direction, the banks are in draw down, that is why they manipulate the price one more time before the true move, retesting these candles (closing losing positions).
FU candles
FU candles are most manipulated candles and create very strong reaction zones. These are the true zones, where the banks place their orders.
Why they are so strong? The answer is very simple - these candles clear the liquidity from the previous ones. After the liquidity is cleared ( all stop losses/pending orders are triggered), price reveal the true direction and move very fast.
FU candles are type of Order Blocks - the most powerful one.
Because the most volume is in the body of the order block. The indicator shows not only the FU candle, but the body of the order block.
There are two types of FU candles :
(only full FU candles are displayed as zones, because they are much significant)
1) Full fu, where the current candle completely engulf the previous one, after taking the liquidity. (displayed as F)
2) Current candle only take liquidity from the previous one, but failed to engulf it. (displayed as A)
9 day simple moving average is also displayed. When the price form Fu candle above/under the MA, there is a better chance for reversal.
When FU candles are retested the transparency will change, showing that the zones may have less impact.
Order Blocks
Only the current order blocks are displayed. Price react very often from the 50% level, that is why this level is also displayed.
Rejections
Rejections are doji candles or candles with big wicks. These rejections very often lead to reversals or deep pullbacks. But before the true move, price test the rejection levels. The retest is not always, but very often of the 50% of the wick.
The rejections are very important price zone.
The indicator can show the zones from different time frames - 1H, 4H, D and the current TF. When wicks are retested the transparency and colour will change, showing that the wicks may have less impact or no more impact.
Settings
-The colour and transparency of the zones can be changed.
- Multi time frames zones could be disabled.
- Doji settings
- Length of the moving average
How to use
If price reach one of the displayed zones. The trader should be prepared for price reaction. This reaction could lead to reversal, pull back or trading range.
The trader should have bias from the higher time frames and watch for signs of manipulations on smaller time frames.
Candlestick OB FinderIntroduction
Hello, this here is a non-repainting candlestick indicator which is able to detect OB looking candlestick formations.
Usage
It can be used to confirm entries, but be aware that it produces a lot of false signals.
Somehow the swings tend to reverse at these points.
I recommend the 10–15 minutes timeframe.
I hope you enjoy this small indicator. :)
Pro Trading Art - Candlestick Patterns with alertAll candlestick pattern based on "Japanese candlestick charting techniques".
Currently Supported List of Candlestick Patterns :
Hammer
Hanging Man
Inverted Hammer
Shooting Star
Morning Star
Evening Star
Bullish Engulfing
Bearish Engulfing
Important Points:
1. You can create alert for all patterns.
2. You can modify multiplier(Length Of Shadow) for Hammer, Hanging Man, Inverted Hammer and Shooting Star
3. You can modify EMA length for upward and downward validation of any pattern.

Wall St. Cheat SheetThis is my best attempt to recreate the famous Wall St. Cheat Sheet BAR/CANDLE Colors. There is a lot of exotic math, oscillators, and other underlying functions that help determine the appropriate colors based on emotional sentiment.
There are some new colors like Purple that help to represent fractal patterns.
White candles help to show over-bought and over-sold conditions.
