virgin wick theorybased off of www.youtube.com strategy.
shows levels for the next HTF period to trade off of
make sure to check your htf to double check as the max lookback doesnt cover some levels occasionally
Candlestick analysis

Engulfing Strategy Core Concept:
This is a price action trading strategy that identifies high-probability trade setups by combining multi-timeframe engulfing patterns with Current Market Price (CMP) validation.
How It Works:
H4 Setup Zone (Primary Timeframe)
Identifies Bullish or Bearish Engulfing patterns on the 4-hour timeframe
When detected, marks a zone at the high and low of the engulfed candle
This zone represents the initial setup area
M30 Trade Control Zone (Confirmation Timeframe)
Looks for Engulfing patterns on the 30-minute timeframe
These patterns must form within or near the H4 setup zone
Acts as a confirmation that the setup is valid
CMP Validation (Current Market Price)
Monitors where price is currently trading relative to the zones
Validates whether the pattern is still active or has been invalidated
Helps determine entry timing and stop loss placement
Trade Setup:
Bullish Setup: Red candle engulfed by green candles → Zone marked at red candle's high/low → Wait for M30 confirmation → Enter when CMP validates the pattern
Bearish Setup: Green candle engulfed by red candles → Zone marked at green candle's high/low → Wait for M30 confirmation → Enter when CMP validates the pattern

NY Open Line + 60-Min Box - V3This draws a box on the first candle of the New York Stock Exchange. It is often used to determine a good strategy.

Updated OTC VC📊 Overview
Display candles from any higher timeframe directly on your current chart! OTC-5 shows the current and previous candles from your selected timeframe (like Daily on a 1-hour chart) with customizable styling and positioning.
✨ Key Features
Multi-Timeframe Visualization: View daily (or any timeframe) candles on any lower timeframe chart
Customizable Display: Show 0-10 previous candles alongside the current one
Smart Positioning: Adjust horizontal offset and spacing between candles
Visual Customization:
Custom colors for bullish/bearish candles (body, wick, border)
Optional label showing time remaining in current candle
Choose between default or custom color schemes
Real-time Countdown: Label shows exact time left in the current higher timeframe candle
🎯 Use Cases
Swing Traders: View daily/weekly trends while trading on lower timeframes
Support/Resistance: Identify key levels from higher timeframes
Context Awareness: Maintain bigger picture perspective during intraday trading
Multi-timeframe Analysis: Combine timeframe analysis without switching charts
⚙️ Settings
TimeFrame: Select any higher timeframe (D, W, 4H, etc.)
Number of Previous Candles: 0-10 previous candles to display
Position Controls: Adjust horizontal offset and candle spacing
Color Customization: Separate colors for bullish/bearish candles
Label Options: Show/hide time countdown, customize label colors

WN 5-20-50 SMA Setup (Discrete Lines = SL TP) Multiple Entries Pretty Simple Script as I got this idea from a YouTuber that showed us how to use AI to make TradingView Indicators.
When the 5 day Simple Moving Average Goes Above the 20 day Simple Moving Average it issues a BUY Signal when the Trend itself is over the 50 day Simple Moving Average.
When the 5 day Simple Moving Average Goes Below the 20 day Simple Moving Average it issues a SELL Signal when the Trend itself is under the 50 day Simple Moving Average.
The Green Cloud Represents price over the 50 day Simple Moving Average. BUY signals will only show up in the green cloud.
The Red Cloud Represents price under the 50 day Simple Moving Average. SELL signals will only show up in the green cloud.
The lines represent Stop Loss and two Take Profit Levels. Take Profit 1 is 1.5x the stop loss and Take Profit 2 is 3x the Stop Loss.
This version of the Script has multiple Trend signals for entries so you can scale into a trade when the Trend is being aggressive.

VC OTC updated📊 Overview
Display candles from any higher timeframe directly on your current chart! OTC-5 shows the current and previous candles from your selected timeframe (like Daily on a 1-hour chart) with customizable styling and positioning.
✨ Key Features
Multi-Timeframe Visualization: View daily (or any timeframe) candles on any lower timeframe chart
Customizable Display: Show 0-10 previous candles alongside the current one
Smart Positioning: Adjust horizontal offset and spacing between candles
Visual Customization:
Custom colors for bullish/bearish candles (body, wick, border)
Optional label showing time remaining in current candle
Choose between default or custom color schemes
Real-time Countdown: Label shows exact time left in the current higher timeframe candle
🎯 Use Cases
Swing Traders: View daily/weekly trends while trading on lower timeframes
Support/Resistance: Identify key levels from higher timeframes
Context Awareness: Maintain bigger picture perspective during intraday trading
Multi-timeframe Analysis: Combine timeframe analysis without switching charts
⚙️ Settings
TimeFrame: Select any higher timeframe (D, W, 4H, etc.)
Number of Previous Candles: 0-10 previous candles to display
Position Controls: Adjust horizontal offset and candle spacing
Color Customization: Separate colors for bullish/bearish candles
Label Options: Show/hide time countdown, customize label colors
📈 Perfect For
Traders who want to see the bigger picture while focusing on entry timing. Whether you're day trading with daily context or swing trading with weekly trends, OTC-5 keeps you aligned with higher timeframe structure.

Gold Smart Scalper V3 - Clean ChartOverview
The Gold Smart Scalper V3 is a trend-following momentum strategy specifically optimized for XAU/USD (Gold). It focuses on catching "value pullbacks" within a strong trend, avoiding the noise of sideways markets. Unlike many scalpers that use lagging indicators for exits, this version uses fixed ATR-based targets to lock in profits during high-volatility moves common in Gold.
Core Methodology
The strategy operates on three layers of confirmation:
Macro Trend (HTF Filter): Uses a 50-period EMA to ensure trades are only taken in the direction of the higher-timeframe momentum.
The Value Zone: Instead of "chasing" green or red candles, the script waits for a pullback to the space between the 9 EMA and 21 EMA. This ensures a better risk-to-reward entry point.
The Trigger: A trade is only executed when price confirms the resumption of the trend by crossing back over the signal EMA after the pullback.
Key Features
Fixed Profit Targets: Replaced dynamic trailing stops with fixed Take Profit (TP) and Stop Loss (SL) levels based on ATR, ensuring exits aren't "hunted" by Gold's signature volatility spikes.
C lean Chart Interface : All moving average plots are hidden. The only visuals provided are the active TP/SL levels when a trade is live, keeping your workspace clutter-free.
Single-Trade Logic: The script includes a "One Trade Per Cross" gate, preventing the strategy from over-trading or "stacking" positions during choppy price action.
Settings & OptimizationATR Multipliers :
Stop Loss (SL): Default $2.0 \times ATR$. Protects against standard market noise.Take Profit (TP): Default $3.0 \times ATR$. Designed for a high Risk/Reward profile.Timeframe Recommendation: Optimized for 15m and 1H for swing scalping, or 5m for aggressive scalping.Instrument: Specifically tuned for Gold (XAU/USD), but applicable to other high-volatility pairs like GBP/JPY or NASDAQ.
Disclaimer
This script is for educational and backtesting purposes only. Past performance does not guarantee future results. Always practice proper risk management.

ProTradersNetwork - Inefficiency Candle Middle CandleProTradersNetwork
See inefficiency candles with ease.

UT Bot + Hull MA Close-Cross Confirm (Strategy)UT Bot + Hull MA Close-Cross Confirm (Strategy)
This strategy combines the classic UT Bot ATR trailing stop with a Hull Moving Average (HMA) close-cross confirmation to reduce false signals and improve trade quality.
The system works in two stages:
UT Bot Signal Detection
A volatility-adjusted ATR trailing stop identifies potential trend shifts using a 1-period EMA crossover. This provides early buy and sell signals based on momentum and volatility.
Hull MA Close-Cross Confirmation
UT Bot signals are only confirmed once price closes across the Hull Moving Average. If a UT signal occurs on the wrong side of the Hull MA, the strategy waits until a valid close-cross occurs before triggering an entry. This confirmation step helps filter chop and late-trend reversals.
Key Features
Non-repainting logic (uses bar-close confirmation)
Futures-friendly design (fixed contracts, point-based TP/SL)
Supports Long, Short, or Both directions
Built-in Take Profit & Stop Loss
Configurable Hull MA type (HMA / EHMA / THMA)
Optional Heikin Ashi signal source
Clean Buy/Sell alerts for automation and webhook execution
Trade Logic Summary
Long Entry:
UT Bot buy signal + confirmed close above Hull MA
Short Entry:
UT Bot sell signal + confirmed close below Hull MA
Exit:
Fixed Take Profit or Stop Loss (user-defined in points)
Alerts & Automation
The strategy includes dedicated Buy Alert and Sell Alert conditions designed for webhook automation (e.g., trade logging, execution engines, or external dashboards). Alerts trigger only on confirmed bar closes, matching backtest behavior.
Intended Use
This strategy is designed for futures markets (e.g., MNQ, ES, GC) and performs best on intraday timeframes. Session filters, risk rules, and trade management can be handled externally if desired.
Disclaimer
This script is provided for educational and research purposes only and is not financial advice. Always test thoroughly and use proper risk management.

ProTradersNetwork-inefficiencyInefficiency Candles Colored, No matter the timeframe, ensures clear visibility of which candles had the most momentum.

BulletProof Long Wick Reversal Markers with LinesThis custom Pine Script indicator for TradingView identifies and marks potential reversal points on your chart based on long wick candles at swing highs (tops) and lows (bottoms). It focuses on candles where the wick is significantly longer than the body (e.g., shooting stars or hammers) and where the subsequent price reversal exceeds a minimum percentage move. Markers appear as colored circles (green for tops, red for bottoms), with horizontal lines extending from each marker to the current bar for easy reference as support/resistance levels.Key Features and InterpretationMarkers (Dots): Green circles at tops: Indicate a potential bearish reversal where price was pushed down after a long upper wick candle.
Red circles at bottoms: Indicate a potential bullish reversal where price was pushed up after a long lower wick candle.
These only appear if the wick-to-body ratio meets the threshold (default 2.0) and the reversal move is at least the minimum percentage (default 1%).
Lines: Horizontal lines extend from each marker to the current bar (updating in real-time). Use these as dynamic levels—e.g., a green top line might act as resistance, while a red bottom line could be support. Lines do not extend into the future blank space on the chart.
Time Filtering: By default, only markers from the last 7 days are shown to reduce clutter. Set to 0 to display all historical ones.
Best Used On: 1-hour charts as per your request, but it works on any timeframe. It's ideal for spotting reversals in trending markets or confirming entries/exits with other indicators.

GuidedByGod-Vertical Timestamp-GOD MODEmaximum 15 custom vertical lines for time based study-timing might be off by Hour or so , will fix in future iteration , for now does the job

Candle Strength + Trend Analyzer by The Ultimate Bull RunCandle Strength + Trend Analyzer:
The Composite Trend Score (-100 to +100)
The trend score aggregates 6 independent data-driven components, each measuring a different aspect of market behavior:
Trend Score = Σ (Component_i × Weight_i)
Score Range Classification
+70 to +100 🚀 EXTREMELY BULLISH
+40 to +70 📈 BULLISH
-40 to +40 ➖ NEUTRAL
-70 to -40 📉 BEARISH
-100 to -70 💥 EXTREMELY BEARISH

MM_DashboardThis is a panel for observing and judging the structural relationship between POC and VWAP.

Ichimoku MTF Heatmap WITH ALERT meeting D and W conditionsThis is a version of the Ichimoku Cloud Heatmap but adds a can't miss alert when it meets Daily and Weekly conditions. The cloud metric is still being refined and the qualifier is ignoring just the cloud for now. As of 12/21/2025 GLD is meeting the conditions to set this flag.

ORB 5 Min Break & Retest + Alerts By Khan 0.1 verORB 5-Minute Break & Retest Indicator
This indicator plots the high and low of the first 5-minute candle of the trading session (Opening Range). It then monitors price for a breakout above or below the ORB levels and triggers an alert when price retests the broken level and holds.
Designed to help identify high-probability ORB continuation setups with clear visual levels and TradingView alerts.

diy OKX:BTCUSDT26Z2025
diyBuy-sell signal
Visual display of indicators simplification
买卖信号显示
直观显示指标简化

Main line in K-line trend indicator
Main line in K-line trend indicator
The chart must be pinned. Otherwise, the chart coloring cannot be seen.
主线在k线染色趋势指标
图表必须置顶。不然看不到图表染色

JokerStyle 🤡 Joker Style Indicator
Welcome to Joker Style — where the market stops acting normal… and starts telling the truth.
This indicator is built for one purpose:
finding clean, repeatable opportunities when liquidity gets trapped and panic kicks in.
No clutter.
No guessing.
No overthinking.
Just one timeframe, one time of day, and clear rules.
⸻
🕘 How to Use It
• Timeframe: 1 minute
• Time: 9:45 AM (New York time)
• Track the first 15-minute range
• Let the market sweep liquidity
• When the 🤡 appears — that’s your signal
BUY and SL levels are drawn automatically.
You manage risk — the indicator handles structure.
⸻
💰 Opportunities & Risk
• Opportunities appear almost every trading day
• Some days you’ll see multiple setups
• Minimum target: 4:1 Risk–Reward
• 8:1 RR is realistic and often achievable when momentum expands
This isn’t about tiny scalps.
It’s about catching the real move.
⸻
🤡 What Makes It Different
• Combines liquidity sweeps, precision entries, and fair value gaps
• Bullish and bearish logic never fight each other
• One active setup at a time — clean, focused, intentional
• Built specifically for high-volatility open conditions

Automatic chart pattern recognition, channel, wedge, triangle. OKX:BTCUSDT26Z2025
Automatic chart pattern recognition, channel, wedge, triangle.
自动图表形态识别,通道、楔形、三角形

MFVB - Macro-Filtered Volatility Breakout策略核心與原創性: 山寨幣 (Altcoins) 的走勢與比特幣高度相關,單純的技術突破往往會因為大盤下跌而變成假動作。 MFVB (宏觀濾網波動突破策略) 並非一般的技術指標,而是一套由**「跨資產同步演算引擎」**驅動的趨勢系統。本策略內建了硬編碼的邏輯,會自動抓取並分析比特幣 (BINANCE:BTCUSDT) 的即時趨勢數據。透過這種獨特的跨市場分析,系統能確保僅在宏觀環境有利時才執行小幣的突破交易。
主要功能與邏輯:
宏觀守門機制 (Macro Gating): 程式會在背景處理外部的 BTC 趨勢數據 (EMA 200)。這是一個強制性的市場狀態濾網:如果比特幣處於空頭趨勢,即使小幣出現技術面突破,系統也會強制過濾訊號,避免逆勢操作。
波動率突破: 使用經過參數調教的肯特納通道 (Keltner Channels) 來偵測動能爆發。只有在價格突破上軌且通過宏觀濾網檢測時,才會觸發進場。
動態風控: 內建 ATR 動態追蹤止損演算法(圖表上的紅線),會隨著價格波動自動調整以鎖定獲利;若價格跌回通道中線則視為趨勢破壞,立即離場。
用法:
適用標的: 各類具備趨勢性的山寨幣 (如 SOL, ETH, MNT, DOGE 等)。
圖表說明: 藍線為通道範圍,紅線為追蹤止損點。
Concept & Originality: Trading Altcoins is risky because the crypto market is highly correlated with Bitcoin. Standard technical breakouts often fail ("fakeouts") when the broader market is bearish. MFVB is not a standard indicator but a specialized trend system driven by a proprietary Cross-Asset Synchronization Engine. It automatically fetches and analyzes Bitcoin's real-time trend data (BINANCE:BTCUSDT) to filter signals on Altcoins. This hard-coded inter-market logic ensures that trades are only taken when the macro environment is favorable.
Key Features & Logic:
Macro Gating Mechanism (The Gatekeeper): The script processes external BTC trend data (EMA 200) in the background. It applies a Market Regime Filter that forbids long positions on Altcoins if Bitcoin is in a downtrend. This logic is hard-coded to prevent trading against the tide.
Volatility Breakout: Utilizes tuned Keltner Channels to identify genuine volatility expansions. A signal is triggered only when the price breaches the Upper Band AND the Macro Filter is confirmed bullish.
Dynamic Risk Management: Features a built-in ATR-based trailing stop (visualized as the Red Line) which automatically adjusts to volatility to lock in profits, alongside a trend-invalidation exit at the channel median.
Usage:
Target Assets: Any trending Altcoins (e.g., SOL, ETH, MNT, DOGE, etc.).
Visuals:
Blue Lines: Volatility Channel.
Red Line: Dynamic Trailing Stop.

Volume package OKX:BTCUSDT26Z2025
Volumn heat map, can clearly see more than 1.5 times 2.5 or 3.5. The parameters can be changed by yourself Chinese version. Color customization. Added moving average filtering. When the volume is greater than 1.5 times, an alarm can be set. Explain that the volume is large
成交量热图,能明显看到大于1.5倍数2.5或者3.5。参数可以自行改。中文版本。颜色自定义。加了均线过滤。当成交量大于1.5倍时,可以警报。说明成交量大

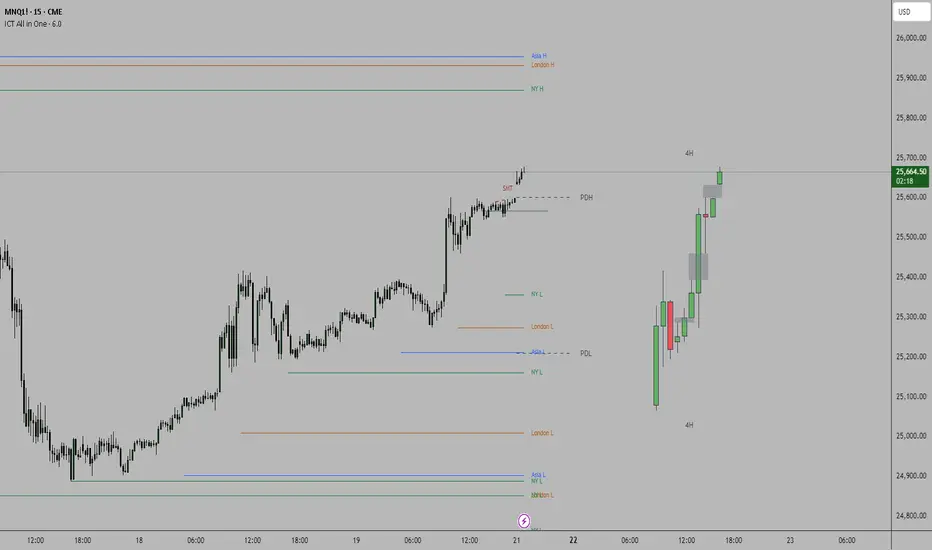
ICT all in oneSessions, PDH, PDL, High Time Frame Candles and Inversion Fair Value gap detector.
This indicator helps detect FVG's on the higher time frame for you to mark with the HTF candles.
Helps see Session sweeps, Small SMT's, Previous day high and low and one Inversion closes to price on the current time frame for possible entry.