Opening Range with Breakouts & Targets w/ Alerts [LuxAlgo]This is the exact Lux Algo opening range with Breakouts and Targets, but added the ability to fire alerts on buy and sell signals
Candlestick analysis

Obsidian Flux Matrix# Obsidian Flux Matrix | JackOfAllTrades
Made with my Senior Level AI Pine Script v6 coding bot for the community!
Narrative Overview
Obsidian Flux Matrix (OFM) is an open-source Pine Script v6 study that fuses social sentiment, higher timeframe trend bias, fair-value-gap detection, liquidity raids, VWAP gravitation, session profiling, and a diagnostic HUD. The layout keeps the obsidian palette so critical overlays stay readable without overwhelming a price chart.
Purpose & Scope
OFM focuses on actionable structure rather than marketing claims. It documents every driver that powers its confluence engine so reviewers understand what triggers each visual.
Core Analytical Pillars
1. Social Pulse Engine
Sentiment Webhook Feed: Accepts normalized scores (-1 to +1). Signals only arm when the EMA-smoothed value exceeds the `sentimentMin` input (0.35 by default).
Volume Confirmation: Requires local volume > 30-bar average × `volSpikeMult` (default 2.0) before sentiment flags.
EMA Cross Validation: Fast EMA 8 crossing above/below slow EMA 21 keeps momentum aligned with flow.
Momentum Alignment: Multi-timeframe momentum composite must agree (positive for longs, negative for shorts).
2. Peer Momentum Heatmap
Multi-Timeframe Blend: RSI + Stoch RSI fetched via request.security() on 1H/4H/1D by default.
Composite Scoring: Each timeframe votes +1/-1/0; totals are clamped between -3 and +3.
Intraday Readability: Configurable band thickness (1-5) so scalpers see context without losing space.
Dynamic Opacity: Stronger agreement boosts column opacity for quick bias checks.
3. Trend & Displacement Framework
Dual EMA Ribbon: Cyan/magenta ribbon highlights immediate posture.
HTF Bias: A higher-timeframe EMA (default 55 on 4H) sets macro direction.
Displacement Score: Body-to-ATR ratio (>1.4 default) detects impulses that seed FVGs or VWAP raids.
ATR Normalization: All thresholds float with volatility so the study adapts to assets and regimes.
4. Intelligent Fair Value Gap (FVG) System
Gap Detection: Three-candle logic (bullish: low > high ; bearish: high < low ) with ATR-sized minimums (0.15 × ATR default).
Overlap Prevention: Price-range checks stop redundant boxes.
Spacing Control: `fvgMinSpacing` (default 5) avoids stacking from the same impulse.
Storage Caps: Max three FVGs per side unless the user widens the limit.
Session Awareness: Kill zone filters keep taps focused on London/NY if desired.
Auto Cleanup: Boxes delete when price closes beyond their invalidation level.
5. VWAP Magnet + Liquidity Raid Engine
Session or Rolling VWAP: Toggle resets to match intraday or rolling preferences.
Equal High/Low Scanner: Looks back 20 bars by default for liquidity pools.
Displacement Filter: ATR multiplier ensures raids represent genuine liquidity sweeps.
Mean Reversion Focus: Signals fire when price displaces back toward VWAP following a raid.
6. Session Range Breakout System
Initial Balance Tracking: First N bars (15 default) define the session box.
Breakout Logic: Requires simultaneous liquidity spikes, nearby FVG activity, and supportive momentum.
Z-Score Volume Filter: >1.5σ by default to filter noisy moves.
7. Lifestyle Liquidity Scanner
Volume Z-Scores: 50-bar baseline highlights statistically significant spikes.
Smart Money Footprints: Bottom-of-chart squares color-code buy vs sell participation.
Panel Memory: HUD logs the last five raid timestamps, direction, and normalized size.
8. Risk Matrix & Diagnostic HUD
HUD Structure: Table in the top-right summarizes HTF bias, sentiment, momentum, range state, liquidity memory, and current risk references.
Signal Tags: Aggregates SPS, FVG, VWAP, Range, and Liquidity states into a compact string.
Risk Metrics: Swing-based stops (5-bar lookback) + ATR targets (1.5× default) keep risk transparent.
Signal Families & Alerts
Social Pulse (SPS): Volume-confirmed sentiment alignment; triangle markers with “SPS”.
Kill-Zone FVG: Session + HTF alignment + FVG tap; arrow markers plus SL/TP labels.
Local FVG: Captures local reversals when HTF bias has not flipped yet.
VWAP Raid: Equal-high/low raids that snap toward VWAP; “VWAP” label markers.
Range Breakout: Initial balance violations with liquidity and imbalance confirmation; circle markers.
Liquidity Spike: Z-score spikes ≥ threshold; square markers along the baseline.
Visual Design & Customization
Theme Palette: Primary background RGB (12,6,24). Accent shading RGB (26,10,48). Long accents RGB (88,174,255). Short accents RGB (219,109,255).
Stylized Candles: Optional overlay using theme colors.
Signal Toggles: Independently enable markers, heatmap, and diagnostics.
Label Spacing: Auto-spacing enforces ≥4-bar gaps to prevent text overlap.
Customization & Workflow Notes
Adjust ATR/FVG thresholds when volatility shifts.
Re-anchor sentiment to your webhook cadence; EMA smoothing (default 5) dampens noise.
Reposition the HUD by editing the `table.new` coordinates.
Use multiples of the chart timeframe for HTF requests to minimize load.
Session inputs accept exchange-local time; align them to your market.
Performance & Compliance
Pure Pine v6: Single-line statements, no `lookahead_on`.
Resource Safe: Arrays trimmed, boxes limited, `request.security` cached.
Repaint Awareness: Signals confirm on close; alerts mirror on-chart logic.
Runtime Safety: Arrays/loops guard against `na`.
Use Cases
Measure when social sentiment aligns with structure.
Plan ICT-style intraday rebalances around session-specific FVG taps.
Fade VWAP raids when displacement shows exhaustion.
Watch initial balance breaks backed by statistical volume.
Keep risk/target references anchored in ATR logic.
Signal Logic Snapshot
Social Pulse Long/Short: `sentimentEMA` gated by `sentimentMin`, `volSpike`, EMA 8/21 cross, and `momoComposite` sign agreement. Keeps hype tied to structural follow-through.
Kill-Zone FVG Long/Short: Requires session filter, HTF EMA bias alignment, and an active FVG tap (`bullFvgTap` / `bearFvgTap`). Labels include swing stops + ATR targets pulled from `swingLookback` and `liqTargetMultiple`.
Local FVG Long/Short: Uses `localBullish` / `localBearish` heuristics (EMA slope, displacement, sequential closes) to surface intraday reversals even when HTF bias has not flipped.
VWAP Raids: Detect equal-high/equal-low sweeps (`raidHigh`, `raidLow`) that revert toward `sessionVwap` or rolling VWAP when displacement exceeds `vwapAlertDisplace`.
Range Breakouts: Combine `rangeComplete`, breakout confirmation, liquidity spikes, and nearby FVG activity for statistically backed initial balance breaks.
Liquidity Spikes: Volume Z-score > `zScoreThreshold` logs direction, size, and timestamp for the HUD and optional review workflows.
Session Logic & VWAP Handling
Kill zone + NY session inputs use TradingView’s session strings; `f_inSession()` drives both visual shading and whether FVG taps are tradeable when `killZoneOnly` is true.
Session VWAP resets using cumulative price × volume sums that restart when the daily timestamp changes; rolling VWAP falls back to `ta.vwap(hlc3)` for instruments where daily resets are less relevant.
Initial balance box (`rangeBars` input) locks once complete, extends forward, and stays on chart to contextualize later liquidity raids or breakouts.
Parameter Reference
Trend: `emaFastLen`, `emaSlowLen`, `htfResolution`, `htfEmaLen`, `showEmaRibbon`, `showHtfBiasLine`.
Momentum: `tf1`, `tf2`, `tf3`, `rsiLen`, `stochLen`, `stochSmooth`, `heatmapHeight`.
Volume/Liquidity: `volLookback`, `volSpikeMult`, `zScoreLen`, `zScoreThreshold`, `equalLookback`.
VWAP & Sessions: `vwapMode`, `showVwapLine`, `vwapAlertDisplace`, `killSession`, `nySession`, `showSessionShade`, `rangeBars`.
FVG/Risk: `fvgMinTicks`, `fvgLookback`, `fvgMinSpacing`, `killZoneOnly`, `liqTargetMultiple`, `swingLookback`.
Visualization Toggles: `showSignalMarkers`, `showHeatmapBand`, `showInfoPanel`, `showStylizedCandles`.
Workflow Recipes
Kill-Zone Continuation: During the defined kill session, look for `killFvgLong` or `killFvgShort` arrows that line up with `sentimentValid` and positive `momoComposite`. Use the HUD’s risk readout to confirm SL/TP distances before entering.
VWAP Raid Fade: Outside kill zone, track `raidToVwapLong/Short`. Confirm the candle body exceeds the displacement multiplier, and price crosses back toward VWAP before considering reversions.
Range Break Monitor: After the initial balance locks, mark `rangeBreakLong/Short` circles only when the momentum band is >0 or <0 respectively and a fresh FVG box sits near price.
Liquidity Spike Review: When the HUD shows “Liquidity” timestamps, hover the plotted squares at chart bottom to see whether spikes were buy/sell oriented and if local FVGs formed immediately after.
Metadata
Author: officialjackofalltrades
Platform: TradingView (Pine Script v6)
Category: Sentiment + Liquidity Intelligence
Hope you Enjoy!

bcon's bemas (5,8,13,21)simple ribbin i use for scalps. the 5 8 13 and 21 ema. like to see them lined up when i see a cross thats my sign to take profit

Instant Volume Flow1. Volume Bars (Green/Red)
Shows instantly whether buyers or sellers are dominant.
2. Delta Volume Histogram
Green = net buying pressure
Red = net selling pressure
This lets you spot:
Big sell dumps
Sudden buy absorption
Volume momentum shifts
3. Spike Alerts
You get alerts when volume is more than 2× the 20-MA average volume.

OFM Key LevelsDaily and Weekly Levels Only
Daily Levels Calculated from RTH Sessions
Weekly Levels Calculated ETH

RBR/DBD Zones JaRBR and DBD zones with multiple timeframe. designed to identify support and resistance area on the chart

Position Size Calculator - Fixed Risk Per BarThis indicator calculates the max contracts allowed per bar based on your determined fixed risk.

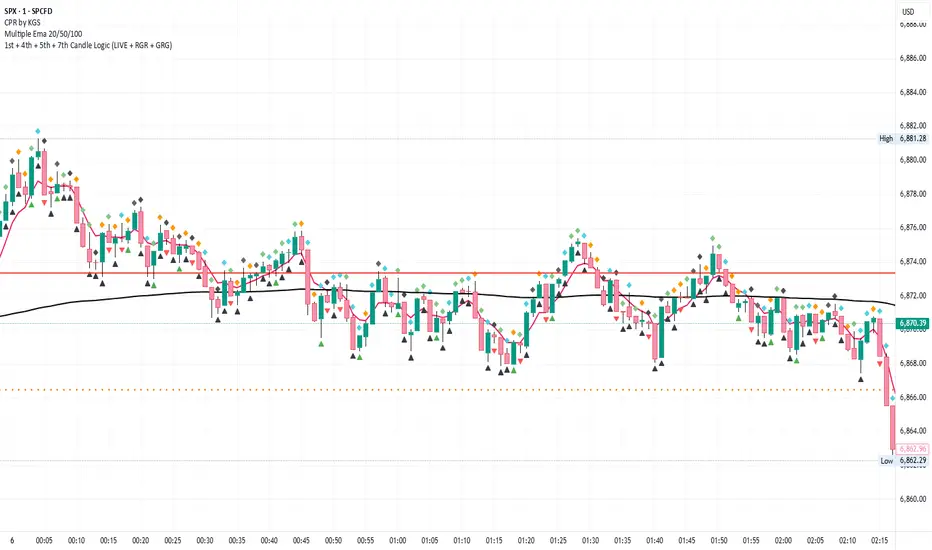
1st + 4th + 5th + 7th Candle Logic (LIVE + RGR + GRG)it analyses 1st + 4th + 5th + 7th Candle based that 8th ot 10 candle can be traded
LTD Buy/Sell With Trend V3.9 (No Signal Table)This indicator is based upon Stoch, MACD and RSI overbought/oversold levels. In addition some 200 EMAs are added for trend confirmation. Some more features will be added on next version
Here are the following features it have
- Multiple EMAs filter added for trend based signals only
- Added Pullback Protection with volume
- Added Buy only or Sell only filters

Scalp Boost LONG✦ Overview
Scalp Boost LONG is a visual tool designed to highlight potential short-term upward impulses.
A signal is generated only when multiple market conditions align at the candle close, combining momentum dynamics, local probability shifts, and abnormal volume behavior.
The indicator does not repaint.
✦ Concept
The tool focuses on selective situations where the market shows signs of micro-breakout potential.
If all internal conditions are confirmed — a LONG event is displayed.
If not — the chart remains clean.
This builds a low-noise signal model, prioritizing quality over frequency.
✦ Signal Logic
The LONG signal requires confirmation of all core conditions:
• Local impulse dynamics
Identifies short-term acceleration suggesting a breakout from a compressed price structure.
• Probability beyond a statistical zone
Uses relative breakout probability instead of fixed levels, checking whether price exceeds expected local ranges.
• Abnormal volume activity
Highlights candles with monetary flow above a custom threshold, signaling increased market interest.
• Anti-overheat filter
Conditions avoiding exhausted or low-momentum phases where continuation is less likely.
Only when all filters are aligned a LONG marker appears.
✦ Visual Structure
The chart display is intentionally minimal:
• ROC Curve
Subdued line, showing short-term momentum without distraction.
• LONG Marker
Green triangle below the candle on confirmed events.
• Candle Highlight
Soft background highlight on the signal bar.
• Volume Marker
Small red dot at the bottom of candles with abnormal monetary flow.
All visual elements appear only on candle close.
✦ Alerts
A clean event structure is available for notifications:
LONG Signal
This allows receiving alerts during chart analysis or in automated workflows while keeping full control over decision-making.
✦ Notes & Guidelines
This tool:
is not a trading system,
does not provide targets or stops,
may trigger against the dominant trend,
should be combined with the user’s own methodology.
Signals are rare by design.
Do not interpret each event as a trend continuation — it highlights conditions, not outcomes.
✦ Suggested Use
-(Non-mandatory ideas for advanced users)
-identifying potential micro-breakouts,
-timing entries around volume spikes,
-adding context to scalping models,
-filtering impulsive moves from noise.
-suitable for a 5-minute timeframe
The indicator can be helpful as a confirmation layer, not a standalone decision tool.

Custom ORB (Adjust Time, Color, + Alerts)Set Opening Range Break Out for whatever time range you choose for current day only. 15 min, 30 min etc. You can add alerts on ORB High Low and change color of Lines.

Мой скриптinputs:
window(1),
type(0), // 0: close, 1: high low, 2: fractals up down, 3: new fractals
persistent(False),
exittype(1),
nbars(160),
adxthres(40),
nstop(3000);
vars:
currentSwingLow(0),
currentSwingHigh(0),
trailStructureValid(false),
downFractal(0),
upFractal(0),
breakStructureHigh(0),
breakStructureLow(0),
BoS_H(0),
BoS_L(0),
Regime(0),
Last_BoS_L(0),
Last_BoS_H(0),
PeakfilterX(false);
BoS(window,persistent,type,Bos_H,BoS_L,upFractal,downFractal,breakStructureHigh,breakStructureLow);
//BOS Regime
If BoS_H <> 0 then begin
Regime = 1; // Bullish
Last_BoS_H = BoS_H ;
end;
If BoS_L <> 0 Then begin
Regime = -1; // Bearish
Last_BoS_L = BoS_L ;
end;
//Entry Logic: if we are in BoS regime then wait for break swing to entry
if ADX(5) of data2 < adxthres then begin
if time>900 and Regime = 1 and EntriesToday(date)= 0 and Last_BoS_H upFractal then buy next bar at market;
end;
if time>900 and EntriesToday(date)= 0 and Regime = -1 and Last_BoS_L>downFractal then
begin
if close < downFractal then sellshort next bar at market;
end;
end;
// Exits: nbars or stoploss or at the end of the day
if marketposition <> 0 and barssinceentry >nbars then begin
sell next bar at market;
buytocover next bar at market;
end;
setstoploss(nstop);
setexitonclose;

ICT Asian & London Range + First Presented FVGIndicator: ICT Sessions + First Presented FVG
What it does: This tool automates the markup of key ICT (Inner Circle Trader) timeframes and entry signals. It allows you to trade on higher timeframes (like the 5m or 15m) while the script automatically "looks inside" the 1-minute chart to find specific setups for you.
Key Features:
Session Ranges (Asian & London)
Automatically highlights the Asian Session (8 PM - Midnight NY) and London Open (2 AM - 5 AM NY).
Draws a shaded box for the session's High and Low.
New: Extends the High and Low lines to 4:00 PM NY (end of the trading day) so you can use them as liquidity targets.
The "First Presented" FVG (Sniper Logic)
It detects the very first Fair Value Gap (FVG) that forms on the 1-minute chart immediately after a session starts.
It draws this 1-minute gap on your current chart, regardless of what timeframe you are viewing.
The FVG box automatically extends to the end of the trading day (4 PM NY), showing you where price might return to "mitigate" or react later in the day.

TraderForge - Genesis Daily ATR HistoryMaps today’s ATR range plus historical days.
Genesis Daily ATR History projects Open Plus ATR and Open Minus ATR for the current session and prior sessions, giving you a clear view of how price reacts to volatility boundaries across multiple days. Perfect for spotting recurring reversal zones, volatility shifts, and range behavior at a glance.
TraderForge – Simple indicators. Powerful results.

TraderForge - Genesis Daily ATR Opening RangeClean, current-day ATR projection only.
Genesis Daily ATR Opening Range draws today’s Open ± ATR as two flat, full-session lines using a dynamic line.new() logic. No historical overlays, just a sharp, focused volatility envelope for intraday setups, PCS/CCS planning, and scalp zones.
TraderForge – Simple indicators. Powerful results.

TraderForge - Everest Auto Top & BottomEverest is a price action tool designed to help traders instantly spot market structure by automatically plotting swing highs and lows. It detects key reversal points using built-in pivot logic and visually marks each top and bottom on your chart with clean labels and connecting lines.
Customizable sensitivity lets you fine-tune the indicator to match any timeframe or asset. Clean visual markers and dashed swing connectors help you quickly recognize market direction and key reversal zones.
Everest works across all assets — from SPX and futures to crypto and stocks — making it a versatile companion for intraday scalpers or swing traders alike.
Whether you’re tracking higher highs and lower lows or identifying fresh support and resistance, Everest keeps your structure clear and your chart clean.
TraderForge – Simple indicators. Powerful results.

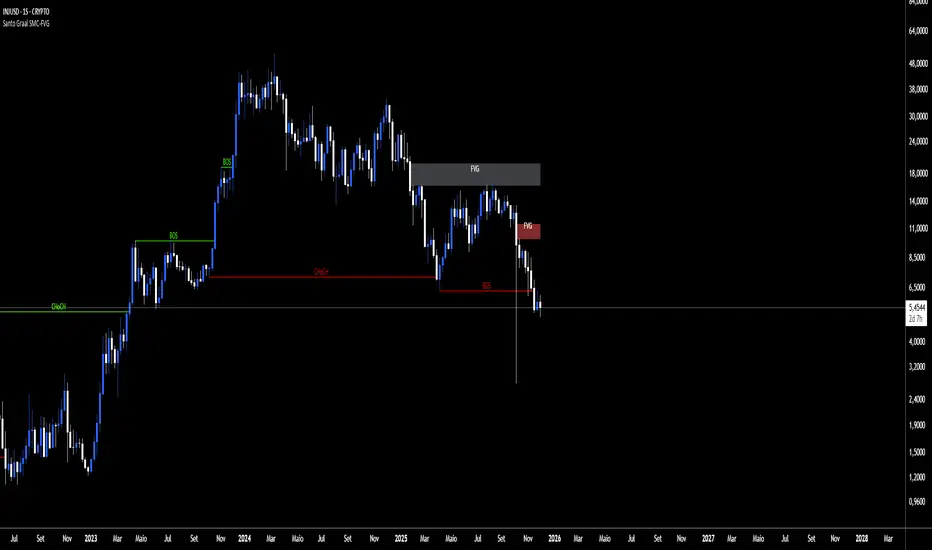
Santo Graal SMC-FVGReading Structures (BOS & CHoCH)
BOS (Break of Structure): shows the trend is still rolling.
BOS up → bullish trend.
BOS down → bearish trend.
CHoCH (Change of Character): heads‑up for a possible flip.
CHoCH up → start of an uptrend.
CHoCH down → start of a downtrend.
Playing with FVG (Fair Value Gaps)
The tool auto‑marks the fair value gaps for you.
Entry: when price comes back to fill/mitigate the gap.
Confirmation: if the gap holds, it backs up the trend direction.
Pro tip: when the bands stick tight (purple), buckle up — a big move is about to pop.
Santo Graal MMAQuick summary: Blue line above and open = buy Blue line below and open = sell Bands stuck together (purple) = get ready, it’s about to blow!
That’s literally it. Stick to these 3 simple rules and this indicator prints money all year long.
Best timeframes (2025):
5min & 15min → mini index, mini dollar, crypto
1h & 4h → crypto (BTC, SOL, ETH) and stocks
Daily → swing trades lasting weeks (crazy profits with just a few trades)

ASR / ADR by Vanya_zvwey
🇺🇦 Детальний Опис та Інструкція Користувача Індикатора ASR/ADR Grid
Цей індикатор є інструментом для візуалізації волатильності, який використовує історичні дані для прогнозування потенційних цінових рівнів розширення та корекції. Він будує сітки на основі середнього діапазону сесії (ASR) та середнього денного діапазону (ADR).
🔑 Ключові Концепції
ASR (Average Session Range): Середній діапазон High-Low, який зазвичай досягається протягом обраної торгової сесії (Азія, Лондон, Нью-Йорк) за останні N днів.
ADR (Average Daily Range): Середній діапазон High-Low, досягнутий протягом цілого 24-годинного торгового дня за останні N днів.
Синхронізація Часового Поясу: На відміну від багатьох індикаторів, цей індикатор залежить від введеного саме вами Session Timezone. Він гарантує, що ваші сесії та денні відкриття розраховуються правильно, незалежно від часового поясу вашого графіку.
⚙️ Посібник із Налаштування (Вхідні Параметри)
Налаштування згруповані для зручності:
1. General Settings (Загальні Налаштування)
Session Timezone: Виберіть часовий пояс, який використовуватиметься як єдиний орієнтир для всіх часів Start/End. Це може бути "UTC+2", "America/New_York" тощо.
Lookback Period (Days): Кількість днів, що використовується для обчислення середнього значення ASR та ADR.
Grid Direction:
"Up": Сітки будуються від поточного Low сесії/дня і розширюються вгору.
"Down": Сітки будуються від поточного High сесії/дня і розширюються вниз.
Grid Step %: Крок для внутрішніх ліній сітки (наприклад, 25% дасть лінії 25%, 50%, 75%).
2. Session Settings (Asia, London, New York)
Show : Увімкнення/вимкнення відображення сітки для конкретної сесії.
Start Time (HH:MM) / End Time (HH:MM): Час початку та кінця сесії, який відповідає вибраному вами Session Timezone.
3. ADR (Daily) Grid (Сітка Денного Діапазону)
Show ADR Grid: Увімкнення/вимкнення сітки, що охоплює весь день.
ADR Anchor: Визначає, від якої ціни починається відлік ADR (0%):
"Day Open": Як якір використовується ціна відкриття дня (00:00 у вашому часовому поясі).
"Day Low/High": Як якір використовується поточний денний екстремум (Low, якщо напрямок "Up", або High, якщо напрямок "Down").
📈 Використання та Інтерпретація
Сітка складається з рівнів від 0% до 100%, які візуалізують, наскільки далеко ціна просунулася щодо середнього історичного діапазону.
Структура Сітки
0% Рівень (Границя): Це якірна точка (High або Low) поточної сесії/дня, з якої починається розрахунок. Лінія суцільна.
100% Рівень (Границя): Це ціновий рівень, що дорівнює 0% Якір + ASR/ADR. Це статистично очікуваний максимальний рух. Лінія суцільна.
Внутрішні Рівні (Grid Step): Пунктирні лінії (25%, 50%, 75% тощо), які показують проміжні цілі або зони корекції.
Торгова Інтерпретація
Рух до 50%: Ціна досягла половини середнього діапазону.
Досягнення 100%: Ціна досягла "середнього" діапазону волатильності. Це часто служить хорошою ціллю для фіксації прибутку або точкою, де можна очікувати корекції/розвороту, оскільки рух вже відповідає історичним нормам.
Рух за межі 100% (Екстремум): Рух, що перевищує 100% ASR/ADR, вважається нетипово сильним або екстремальним.
🇬🇧 Detailed Description and User Guide for the ASR/ADR Grid Indicator
This indicator is a robust volatility visualization tool designed to project potential price extension and retracement levels based on historical data. It constructs price grids using the Average Session Range (ASR) and the Average Daily Range (ADR).
🔑 Key Concepts
ASR (Average Session Range): The average High-to-Low range typically achieved during a selected trading session (Asia, London, New York) over the last N days
ADR (Average Daily Range): The average High-to-Low range achieved during the entire 24-hour trading day over the last N days.
Timezone Synchronization: This is critical. The indicator relies on a single Session Timezone input to correctly calculate all session start/end times and daily opens, ensuring accuracy regardless of your charting platform's native exchange time.
⚙️ Setup Guide (Input Parameters)
The settings are organized into logical groups:
1. General Settings
Session Timezone: Select the timezone that will serve as the single reference point for all Start/End times below (e.g., "UTC+2", "America/New_York").
Lookback Period (Days): The number of preceding days used to compute the average ASR and ADR values.
Grid Direction:
"Up": The grids are anchored at the current session/day's Low and extend upwards.
"Down": The grids are anchored at the current session/day's High and extend downwards.
Grid Step %: The percentage increment for the inner grid lines (e.g., 25% will plot lines at 25%, 50%, 75%).
2. Session Settings (Asia, London, New York)
Show : Toggles the visibility of the grid for that specific session.
Start Time (HH:MM) / End Time (HH:MM): The start and end times for the session, which must correspond to your chosen Session Timezone. The script supports overnight sessions (e.g., starting at 22:00 and ending at 02:00 the next day).
3. ADR (Daily) Grid
Show ADR Grid: Toggles the visibility of the grid covering the entire trading day.
ADR Anchor: Determines the price point from which the ADR (0%) is measured:
"Day Open": The anchor is the day's opening price (at 00:00 in your chosen timezone).
"Day Low/High": The anchor is the current day's extreme (Low if Direction is "Up", or High if Direction is "Down").
📈 Usage and Interpretation
The grid levels, ranging from 0% to 100%, visualize how far the price has traveled relative to the average historical volatility for that specific period.
Grid Structure
0% Level (Border): This is the anchor point (High or Low) of the current session/day, serving as the starting reference for the calculation. This line is solid.
100% Level (Border): This is the price level equal to the 0% Anchor + ASR/ADR. It represents the statistically expected average maximum move. This line is also solid.
Inner Levels (Grid Step): These dotted lines (25%, 50%, 75%, etc.) serve as intermediate targets or potential zones for pullback.
Trading Interpretation
Reaching 50%: The price has achieved half of the average range.
Reaching 100%: The price has fulfilled the "average" volatility range. This level often acts as an excellent profit target or a point where you might expect correction or reversal, as the move has met historical norms.
Moving Beyond 100% (Extreme): A price move that exceeds 100% ASR/ADR is considered unusually strong or extreme volatility.

Key Support and ResistanceKEY SUPPORT AND RESISTANCE - USER GUIDE
========================================
OVERVIEW
This indicator automatically identifies and displays key support and resistance levels based on swing highs and swing lows. It uses pivot point detection to mark significant price levels where the market has previously shown reactions, helping traders identify potential entry/exit points and key decision zones.
KEY FEATURES
• Automatic Level Detection: Identifies swing highs (resistance) and swing lows (support) using pivot point analysis
• Dynamic Line Management: Displays only recent levels within a specified lookback period to keep charts clean
• Auto-Extending Lines: Projects support/resistance levels forward to anticipate future price interactions
• Color-Coded Levels: Red lines for resistance, green lines for support for easy visual identification
========================================
PARAMETERS
========================================
Left Bars (Default: 10)
• Minimum: 5 bars
• Number of bars to the left of the pivot point
• Higher values = more significant levels but fewer signals
• Lower values = more sensitive detection but may include minor swings
Right Bars (Default: 10)
• Minimum: 5 bars
• Number of bars to the right of the pivot point
• Must be confirmed by price action before the level is drawn
• Balances between confirmation delay and signal accuracy
Show Last N Bars (Default: 200)
• Minimum: 10 bars
• Only displays support/resistance levels detected within the most recent N bars
• Keeps your chart clean by removing outdated levels
• Adjust based on your trading timeframe and style
Line Extension Length (Default: 48)
• Minimum: 1 bar
• How many bars forward the support/resistance lines extend
• Helps visualize potential future price interactions
• Longer extensions useful for swing trading, shorter for day trading
========================================
HOW TO USE
========================================
FOR SWING TRADERS
1. Use default settings (10/10) or increase to 15/15 for more significant levels
2. Set "Show Last N Bars" to 300-500 to capture longer-term levels
3. Look for price reactions when approaching these levels
4. Combine with volume analysis for confirmation
FOR DAY TRADERS
1. Consider reducing Left/Right Bars to 7-8 for more frequent signals
2. Set "Show Last N Bars" to 100-150 to focus on recent action
3. Reduce "Line Extension Length" to 20-30 bars
4. Watch for intraday bounces or breakouts at these levels
TRADING STRATEGIES
Bounce Trading (Mean Reversion)
• Enter long when price approaches green support lines
• Enter short when price approaches red resistance lines
• Use stop loss just beyond the support/resistance level
• Best in ranging or consolidating markets
Breakout Trading (Trend Following)
• Wait for price to break through resistance (bullish) or support (bearish)
• Confirm with increased volume
• Previous resistance becomes new support (and vice versa)
• Best in trending markets
Multi-Timeframe Analysis
• Check higher timeframe levels for major support/resistance zones
• Use lower timeframe levels for precise entry/exit timing
• Confluence of multiple timeframe levels creates strong zones
========================================
IMPORTANT NOTES
========================================
Line Confirmation Delay
• Lines appear with a delay equal to "Right Bars" parameter
• This delay ensures the pivot point is confirmed
• Real-time level detection requires price action confirmation
Chart Clarity
• Maximum 500 lines can be displayed (TradingView limitation)
• Adjust "Show Last N Bars" if chart becomes too cluttered
• Old lines automatically delete when outside the lookback period
False Signals
• Not all support/resistance levels will hold
• Use additional confirmation (volume, candlestick patterns, other indicators)
• Markets can break through levels, especially during high-impact news
BEST PRACTICES
1. Combine with Other Analysis: Use alongside trend indicators, volume, and price action patterns
2. Context Matters: Consider overall market trend and structure
3. Risk Management: Always use stop losses; don't rely solely on S/R levels
4. Market Conditions: More effective in liquid, actively traded markets
5. Backtesting: Test settings on your specific instrument and timeframe before live trading
TROUBLESHOOTING
Too Many Lines?
• Increase "Left Bars" and "Right Bars" values
• Decrease "Show Last N Bars" value
Too Few Lines?
• Decrease "Left Bars" and "Right Bars" values
• Increase "Show Last N Bars" value
Lines Not Appearing?
• Ensure sufficient price data is loaded on your chart
• Check that "Right Bars" have passed since the last swing point
• Verify indicator is properly loaded (refresh if needed)
TECHNICAL DETAILS
• Uses ta.pivothigh() and ta.pivotlow() functions for level detection
• Implements array-based line management for efficient rendering
• Automatic cleanup of outdated lines to maintain performance
• Overlay indicator - displays directly on price chart
Disclaimer: This indicator is for educational and informational purposes only. It does not constitute financial advice. Always conduct your own research and risk assessment before making trading decisions.
========================================
中文使用指南
========================================
概述
本指標自動識別並顯示基於波段高點和低點的關鍵支撐阻力位。使用樞軸點檢測標記市場先前反應的重要價格水平,幫助交易者識別潛在的進出場點和關鍵決策區域。
主要功能
• 自動水平檢測:使用樞軸點分析識別波段高點(阻力)和波段低點(支撐)
• 動態線條管理:僅顯示指定回看期內的近期水平,保持圖表清晰
• 自動延伸線條:將支撐阻力水平向前投影,預測未來價格互動
• 顏色編碼:紅線表示阻力,綠線表示支撐,便於視覺識別
========================================
參數說明
========================================
左側K棒數(預設:10)
• 最小值:5根K棒
• 樞軸點左側的K棒數量
• 數值越高 = 水平越重要但訊號越少
• 數值越低 = 檢測更敏感但可能包含次要波動
右側K棒數(預設:10)
• 最小值:5根K棒
• 樞軸點右側的K棒數量
• 必須經過價格行為確認後才繪製水平
• 在確認延遲和訊號準確性之間取得平衡
顯示最近N根K棒內的點(預設:200)
• 最小值:10根K棒
• 僅顯示最近N根K棒內檢測到的支撐阻力水平
• 透過移除過時水平保持圖表清晰
• 根據您的交易時間框架和風格調整
線條延伸長度(預設:48)
• 最小值:1根K棒
• 支撐阻力線向前延伸的K棒數
• 幫助視覺化潛在的未來價格互動
• 較長延伸適合波段交易,較短適合當沖交易
========================================
使用方法
========================================
波段交易者
1. 使用預設設定(10/10)或增加至15/15以獲得更重要的水平
2. 將「顯示最近N根K棒」設為300-500以捕捉長期水平
3. 觀察價格接近這些水平時的反應
4. 結合成交量分析進行確認
當沖交易者
1. 考慮將左右側K棒減少至7-8以獲得更頻繁的訊號
2. 將「顯示最近N根K棒」設為100-150以專注於近期行情
3. 將「線條延伸長度」減少至20-30根K棒
4. 觀察日內在這些水平的反彈或突破
交易策略
反彈交易(均值回歸)
• 當價格接近綠色支撐線時做多
• 當價格接近紅色阻力線時做空
• 在支撐阻力水平之外設置止損
• 在區間或盤整市場中效果最佳
突破交易(趨勢跟隨)
• 等待價格突破阻力(看漲)或支撐(看跌)
• 以增加的成交量確認
• 先前的阻力成為新的支撐(反之亦然)
• 在趨勢市場中效果最佳
多時間框架分析
• 檢查更高時間框架的主要支撐阻力區域
• 使用較低時間框架進行精確的進出場時機
• 多個時間框架水平的匯合創造強大區域
========================================
重要注意事項
========================================
線條確認延遲
• 線條出現時會有等於「右側K棒數」參數的延遲
• 此延遲確保樞軸點被確認
• 實時水平檢測需要價格行為確認
圖表清晰度
• 最多可顯示500條線(TradingView限制)
• 如果圖表變得太雜亂,請調整「顯示最近N根K棒」
• 超出回看期的舊線會自動刪除
假訊號
• 並非所有支撐阻力水平都會守住
• 使用額外確認(成交量、K棒型態、其他指標)
• 市場可能突破水平,特別是在重大新聞期間
最佳實踐
1. 結合其他分析:與趨勢指標、成交量和價格行為型態一起使用
2. 背景很重要:考慮整體市場趨勢和結構
3. 風險管理:始終使用止損;不要僅依賴支撐阻力水平
4. 市場條件:在流動性高、活躍交易的市場中更有效
5. 回測:在實盤交易前,在您的特定商品和時間框架上測試設定
故障排除
線條太多?
• 增加「左側K棒數」和「右側K棒數」數值
• 減少「顯示最近N根K棒」數值
線條太少?
• 減少「左側K棒數」和「右側K棒數」數值
• 增加「顯示最近N根K棒」數值
線條未出現?
• 確保圖表上載入了足夠的價格數據
• 檢查自上次波動點以來是否已過「右側K棒數」
• 驗證指標是否正確載入(如需要請刷新)
技術細節
• 使用 ta.pivothigh() 和 ta.pivotlow() 函數進行水平檢測
• 實施基於陣列的線條管理以實現高效渲染
• 自動清理過時線條以保持性能
• 疊加指標 - 直接顯示在價格圖表上
免責聲明:本指標僅供教育和資訊目的。不構成財務建議。在做出交易決策前,請務必進行自己的研究和風險評估。

Accumulation and Distribution Divergence with SignalsUse this indicator on the 1 minute chart for small cap stocks with news. They must be one of the leading gappers in the entire market for this to work best.

Smart Money Concepts by Rakesh Sharma🎯 SMART MONEY CONCEPTS - TRADE WITH INSTITUTIONS
Reveal where banks, hedge funds, and institutional traders enter the market. Trade alongside smart money, not against them!
✨ FEATURES:
- Order Blocks (OB) - Institutional buying/selling zones
- Fair Value Gaps (FVG) - Market inefficiencies to exploit
- Break of Structure (BOS) - Trend continuation signals
- Change of Character (ChoCh) - Early reversal detection
- Liquidity Sweeps - Stop hunt identification
- Premium/Discount Zones - Buy cheap, sell expensive
- Live Dashboard - Real-time market structure
🎯 HOW TO USE:
✓ BUY in Discount Zone at Bullish Order Blocks
✓ SELL in Premium Zone at Bearish Order Blocks
✓ Wait for ChoCh or BOS confirmation
✓ Follow institutional footprints for high-probability setups
📊 PERFECT FOR:
All markets - Nifty, Bank Nifty, Stocks, Forex, Crypto
All timeframes - 5m (scalping), 15m (intraday), Daily (swing)
⚡ TRADING EDGE:
Stop trading like retail. Start trading like institutions. See where smart money accumulates and distributes. Catch reversals early with ChoCh signals.
Created by: Rakesh Sharma | Version 1.0

