Marubozu and Strong Candle DetectorMarubozu and Strong Candle Detector - Indicator Description
This TradingView Pine Script indicator identifies powerful price action signals by detecting two key candle types that can signal strong market momentum:
What It Detects
1. Marubozu Candles: These are candles with little to no wicks, where the body makes up almost the entire candle. Marubozu means "bald head" or "shaved head" in Japanese, referring to the absence of shadows (wicks).
o Bullish Marubozu: A green/up candle with minimal wicks, showing buyers controlled the entire session
o Bearish Marubozu: A red/down candle with minimal wicks, showing sellers dominated the session
2. Strong Candles: These are candles that are significantly larger than the recent average, suggesting exceptional momentum.
o Strong Bullish: Large green/up candles showing powerful buying pressure
o Strong Bearish: Large red/down candles showing powerful selling pressure
Trading Significance
• Bullish Marubozu/Strong Bullish Candles: Often signal the beginning of bullish trends or strong continuation of existing uptrends. These can be excellent entry points for long positions.
• Bearish Marubozu/Strong Bearish Candles: Often indicate the start of bearish trends or powerful continuation of existing downtrends. These can be good entry points for short positions or exit points for long positions.
Key Features
• Customizable Parameters: Adjust sensitivity for body ratio threshold and size comparison
• Visual Indicators: Easy-to-spot markers appear on your charts
• Information Display: Shows key metrics about the current candle
• Alert System: Set notifications for when significant candles form
How To Use This Indicator
1. For Entry Signals:
o Look for bullish Marubozu/strong bullish candles at support levels or after pullbacks
o Look for bearish Marubozu/strong bearish candles at resistance levels or after rallies
2. For Exit Signals:
o Consider taking profits on long positions when bearish Marubozu/strong bearish candles appear
o Consider taking profits on short positions when bullish Marubozu/strong bullish candles appear
3. For Trend Confirmation:
o Multiple signals in the same direction strengthen the case for a trend
This indicator works best on larger timeframes (1H, 4H, Daily) where candle formations have more significance, but can be applied to any timeframe based on your trading style.
Formacje świecowe

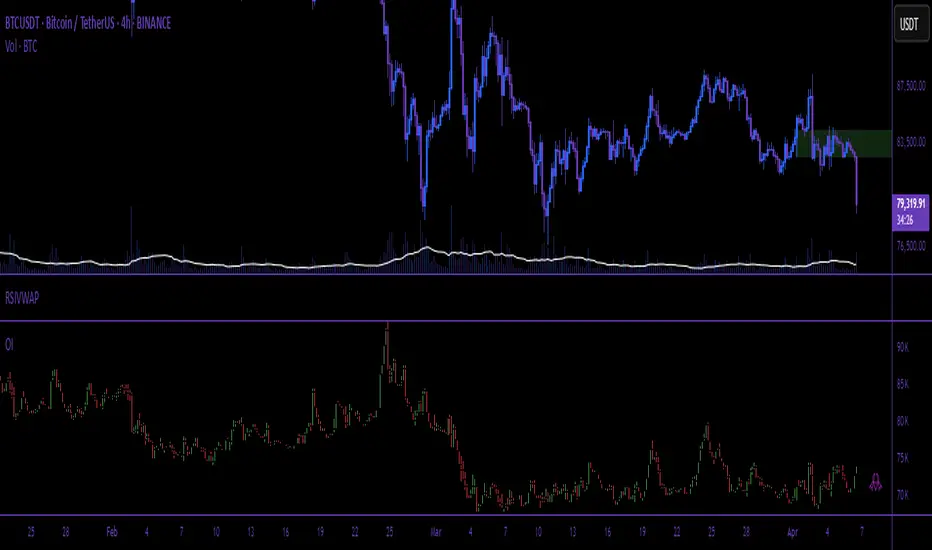
Open Interest (Multiple Exchanges for Crypto)On some cryptocurrencies and exchanges the OI data is nonexistent or deplorable. With this indicator you can see OI data from multiple exchanges (or just the best one) from USD,USDT, or USD+USDT pairs whether you are using a perpetuals chart or not.
Hope you all like it!
The 950 Bar StrategyNQ 9:50 AM Candle Strategy v3 (Trade at 9:55AM) - 1 Contract
Also called the 950 Standard. The 950 Strategy.
This strategy places its trade at 9:55am each day based on the close of the 9:50am candle. Uses 5min timeframe candles. If candle closes red, or bearish, the strategy goes short. If candle closes green, or bullish, the strategy goes long. Brackets are 150tick TP and 200tick SL.

[EmreKb] Pinbar AnalysisDescription
The Pinbar Analyzer tool will count how many ltf candles are inside the wick and the total volume inside the wick.
How it works?
Calculate candle count of inside wick and volumes. Than display like below image
T/iW: Total Candle / Total inside Wick
ROiW: Rate of inside wick candle count
TV/WV: Total volume / Wick volume

LRLR [TakingProphets]LRLR (Low Resistance Liquidity Run) Indicator
This indicator identifies potential liquidity runs in areas of low resistance, based on ICT (Inner Circle Trader) concepts. It specifically looks for a series of unmitigated swing highs in a downtrend that form without any bearish fair value gaps (FVGs) between them.
What is an LRLR?
- A Low Resistance Liquidity Run occurs when price creates a series of lower highs without any bearish fair value gaps in between
- The absence of bearish FVGs indicates there is no significant resistance in the area
- These formations often become targets for smart money to collect liquidity above the swing highs
How to Use the Indicator:
1. The indicator will draw a diagonal line connecting a series of qualifying swing highs
2. A small "LRLR" label appears to mark the pattern
3. These areas often become targets for future price moves, as they represent zones of accumulated liquidity with minimal resistance
Key Points:
- Minimum of 4 consecutive lower swing highs
- No bearish fair value gaps can exist between these swing highs
- The diagonal line helps visualize the liquidity run formation
- Can be used for trade planning and identifying potential reversal zones
Settings:
- Show Labels: Toggle the "LRLR" label visibility
- LRLR Line Color: Customize the appearance of the diagonal line
Best Practices:
1. Use in conjunction with other ICT concepts and market structure analysis
2. Pay attention to how price reacts when returning to these levels
3. Consider these areas as potential targets for smart money liquidity grabs
4. Most effective when used on higher timeframes (4H and above)
Note: This is an educational tool and should be used as part of a complete trading strategy, not in isolation.

Candle Emotion Index (CEI) StrategyThe Candle Emotion Index (CEI) Strategy is an innovative sentiment-based trading approach designed to help traders identify and capitalize on market psychology. By analyzing candlestick patterns and combining them into a unified metric, the CEI Strategy provides clear entry and exit signals while dynamically managing risk. This strategy is ideal for traders looking to leverage market sentiment to identify high-probability trading opportunities.
How It Works
The CEI Strategy is built around three core oscillators that reflect key emotional states in the market:
Indecision Oscillator . Measures market uncertainty using patterns like Doji and Spinning Tops. High values indicate hesitation, signaling potential turning points.
Fear Oscillator . Tracks bearish sentiment through patterns like Shooting Star, Hanging Man, and Bearish Engulfing. Helps identify moments of intense selling pressure.
Greed Oscillator . Detects bullish sentiment using patterns like Marubozu, Hammer, Bullish Engulfing, and Three White Soldiers. Highlights periods of strong buying interest.
These oscillators are averaged into the Candle Emotion Index (CEI):
CEI = (Indecision + Fear + Greed) / 3
This single value quantifies overall market sentiment and drives the strategy’s trading decisions.
Key Features
Sentiment-Based Trading Signals . Long Entry: Triggered when the CEI crosses above a lower threshold (e.g., 0.1), indicating increasing bullish sentiment. Short Entry: Triggered when the CEI crosses above a higher threshold (e.g., 0.2), signaling rising bearish sentiment.
Volume Confirmation . Trades are validated only if volume exceeds a user-defined multiplier of the average volume over the lookback period. This ensures entries are backed by significant market activity.
Break-Even Recovery Mechanism . If a trade moves into a loss, the strategy attempts to recover to break-even instead of immediately exiting at a loss. This feature provides flexibility, allowing the market to recover while maintaining disciplined risk management.
Dynamic Risk Management . Maximum Holding Period: Trades are closed after a user-defined number of candles to avoid overexposure to prolonged uncertainty. Profit-Taking Conditions: Positions are exited when favorable price moves are confirmed by increased volume, locking in gains. Loss Threshold: Trades are exited early if the price moves unfavorably beyond a set percentage of the entry price, limiting potential losses.
Cooldown Period . After a trade is closed, a cooldown period prevents immediate re-entry, reducing overtrading and improving signal quality.
Why Use This Strategy?
The CEI Strategy combines advanced sentiment analysis with robust trade management, making it a powerful tool for traders seeking to understand market psychology and identify high-probability setups. Its unique features, such as the break-even recovery mechanism and volume confirmation, add an extra layer of discipline and reliability to trading decisions.
Best Practices
Combine with Other Indicators . Use trend-following tools (e.g., moving averages, ADX) and momentum oscillators (e.g., RSI, MACD) to confirm signals.
Align with Key Levels . Incorporate support and resistance levels for refined entries and exits.
Multi-Market Compatibility . Apply this strategy to forex, crypto, stocks, or any asset class with strong volume and price action.

Star Pattern IdentifierThe Star Pattern Identifier is a custom TradingView indicator designed to detect and mark Morning Star (MS) and Evening Star (ES) candlestick patterns, which are powerful reversal signals. This indicator offers a flexible and customizable approach by incorporating adjustable parameters for both the size and volume of the third candle in the pattern.
Key Features:
Morning Star (MS) : A bullish reversal pattern that occurs after a downtrend.
Evening Star (ES) : A bearish reversal pattern that occurs after an uptrend.
Adjustable Parameters:
Third Candle Size Multiplier : Define how large the body of the third candle should be relative to the second candle (default is 2x).
Third Candle Volume Multiplier : Control the minimum volume of the third candle in relation to the second candle (default is 0.5x).
The script ensures that the third candle’s volume is at least 50% of the second candle's volume and that its body is at least twice the size of the second candle, to filter out weaker signals.
The patterns are marked directly on the chart with "MS" (Morning Star) or "ES" (Evening Star) labels for easy identification.
Practical Use:
Use this indicator to spot potential trend reversals with more confidence by ensuring strong candlestick body and volume conditions.
Customize the parameters to suit your trading strategy and preferences.
How it Works:
The indicator looks for a bearish first candle , followed by a bullish or indecisive second candle , and a bullish third candle for the Morning Star pattern.
For the Evening Star, the indicator looks for a bullish first candle , followed by a bearish or indecisive second candle , and a bearish third candle .
The size and volume of the third candle are checked to ensure it meets the set parameters, confirming the strength of the reversal signal.
This tool is perfect for traders seeking to spot reversal signals in the market.

Candle Emotion Index (CEI)The Candle Emotion Index (CEI) is a comprehensive sentiment analysis indicator that combines three sub-oscillators—Indecision Oscillator, Fear Oscillator, and Greed Oscillator—to provide a single, unified measure of market sentiment. By analyzing bullish, bearish, and indecisive candlestick patterns, the CEI delivers a holistic view of market emotions and helps traders identify key turning points.
How It Works
Indecision Oscillator: Measures market uncertainty using Doji and Spinning Top candlestick patterns. Scores their presence and normalizes the results over a user-defined lookback period.
Fear Oscillator: Measures bearish sentiment using Shooting Star, Hanging Man, and Bearish Engulfing candlestick patterns. Scores their presence and normalizes the results over a user-defined lookback period.
Greed Oscillator: Measures bullish sentiment using Marubozu, Bullish Engulfing, Hammer, and Three White Soldiers candlestick patterns. Scores their presence and normalizes the results over a user-defined lookback period.
Candle Emotion Index Calculation: The CEI is calculated as the average of the Indecision, Fear, and Greed Oscillators: CEI = (Indecision Oscillator + Fear Oscillator + Greed Oscillator) / 3
Plotting: The CEI is plotted as a single line on the chart, representing overall market sentiment.
Reference lines are added to indicate Low Emotion, Neutral, and High Emotion levels.
The Candle Emotion Index provides a unified perspective on market sentiment by blending indecision, fear, and greed into one easy-to-interpret metric. It serves as a powerful tool for traders seeking to gauge market psychology and identify high-probability trading opportunities. For best results, use the CEI in conjunction with other technical indicators to confirm signals.

HTF CandlestickHTF Candlestick
This indicator that visualizes a specific candle from a user-defined timeframe (1D, 1H, etc.) and its associated properties on the chart. Below is a detailed explanation:
1 - Inputs and Initialization:
timeframeInput: Allows the user to select the desired timeframe (e.g., daily).
pos: Adjusts the horizontal position of the drawn candle on the chart.
2 - Custom Data Type (type bar):
The bar type stores data for the open, high, low, and close (OHLC) values, as well as the start time of the candle.
It also includes graphical elements like body, wick, and start lines.
3 - Logic:
A variable b is initialized to represent the custom candle.
The script checks for changes in the selected timeframe and creates a new bar when the timeframe changes.
4 - Methods:
update(): Updates the OHLC values of the bar if a new high or low occurs.
display(): Draws the candle on the chart, including:
The candle body.
The wick (shadow).
Labels showing the open, high, and low values.
Horizontal and vertical dotted lines for visual aid.
5 - Candle Redrawing:
The script clears all graphical elements (lines, labels, boxes) for the current candle on the last bar of the chart (barstate.islast) and redraws them using the display() method.
6 - Table Display:
A small table is displayed at the right-hand side of the chart showing:
The selected timeframe.
The opening value of the candle.
The difference between the close and open prices, highlighted with the appropriate color.
Kod Açıklaması
Bu Pine Script, kullanıcı tarafından seçilen bir zaman dilimine (1D, 1H vb.) ait bir mum çubuğunu ve onun özelliklerini grafik üzerinde görselleştiren özel bir indikatördür. İşte detaylı açıklaması:
1- Girdiler ve Başlangıç:
timeframeInput: Kullanıcının istediği zaman dilimini seçmesine olanak tanır (ör. günlük).
pos: Çizilen mumun grafikte yatay pozisyonunu ayarlamak için kullanılır.
2 - Özel Veri Tipi (type bar):
bar türü, açılış, yüksek, düşük ve kapanış (OHLC) değerlerini ve mumun başlangıç zamanını saklar.
Ayrıca, grafik öğeleri için body, wick ve start gibi alanlar içerir.
3- Mantık:
b değişkeni, seçilen mum çubuğunu temsil etmek için tanımlanmıştır.
Seçilen zaman diliminde bir değişiklik olup olmadığını kontrol eder ve değişiklik olduğunda yeni bir bar oluşturur.
4 - Metotlar:
update(): Daha yüksek bir zirve veya daha düşük bir dip meydana gelirse, mumun OHLC değerlerini günceller.
display(): Grafik üzerinde mum çubuğunu çizer. Bu işlem şunları içerir:
Mum gövdesi.
Fitil (gölge).
Açılış, yüksek ve düşük değerlerini gösteren etiketler.
Görsel yardım için yatay ve dikey kesik çizgiler.
5- Mum Yeniden Çizimi:
Grafik üzerindeki tüm grafiksel elemanları (çizgiler, etiketler, kutular) temizler ve mevcut mumun son çubuğunda (barstate.islast) bunları yeniden çizer.
6 - Tablo Görüntüsü:
Grafik üzerinde sağ tarafta küçük bir tablo gösterilir. Bu tabloda:
Seçilen zaman dilimi.
Mumun açılış değeri.
Kapanış ve açılış fiyatları arasındaki fark, uygun renkte vurgulanarak gösterilir.
Bu kod, kullanıcıya belirli bir zaman dilimindeki mum çubuğunun görsel bir analizini ve temel bilgilerini sağlar.

CHAKRA RISS ENGULFING CANDLESTICK STRATEGYChakra RISS Engulfing Candlestick Strategy
Type: Technical Indicator & Strategy
Platform: TradingView
Script Version: Pine Script v6
Overview:
The Chakra RISS Engulfing Candlestick Strategy combines a momentum-based approach using the Relative Strength Index (RSI) with Engulfing Candlestick Patterns to generate buy and sell signals. The strategy filters trades based on price movement relative to a 50-period Simple Moving Average (SMA), making it a trend-following strategy.
The indicator uses color-coded bars to visually represent market conditions, helping traders easily identify bullish and bearish trends. The strategy is designed to be dynamic, adapting to changing market conditions and filtering out noise using key technical indicators.
How It Works:
RSI-Based Color Conditions:
Green Bars: When the RSI crosses above a specified UpLevel (default: 50), indicating a bullish momentum and signaling potential buy conditions.
Red Bars: When the RSI crosses below a specified DownLevel (default: 50), indicating a bearish momentum and signaling potential sell conditions.
Buy Signal:
Triggered when the following conditions are met:
RSI crosses from below the UpLevel (default: 50) to above it, signaling increasing bullish momentum.
The close price is above the 50-period Simple Moving Average (SMA), confirming an uptrend.
The Buy Signal is plotted below the bar with a green arrow and a "BUY" label.
Sell Signal:
Triggered when the following conditions are met:
RSI crosses from above the DownLevel (default: 50) to below it, signaling increasing bearish momentum.
The close price is below the 50-period Simple Moving Average (SMA), confirming a downtrend.
The Sell Signal is plotted above the bar with a red arrow and a "SELL" label.
Stop Loss and Take Profit:
For long trades (buy signals), the stop loss is placed below the previous bar's low, and the take profit is set at 3% above the entry price.
For short trades (sell signals), the stop loss is placed above the previous bar's high, and the take profit is set at 3% below the entry price.
Dynamic Bar Coloring:
The bar colors change dynamically based on RSI levels:
Green Bars: Indicating a potential uptrend (bullish).
Red Bars: Indicating a potential downtrend (bearish).
These visual cues help traders quickly identify market trends and potential reversals.
Trend Filtering:
The 50-period Simple Moving Average (SMA) is used to filter trades based on the overall market trend:
Buy signals are only considered when the price is above the moving average, indicating an uptrend.
Sell signals are only considered when the price is below the moving average, indicating a downtrend.
Alerting System:
Alerts can be set for both buy and sell signals. These alerts notify traders in real-time when potential trades are generated, allowing them to act promptly.
Alerts can be configured to send notifications through email, SMS, or a webhook for integration with other services like IFTTT or Zapier.
Key Features:
RSI and Moving Average-Based Signals: Combines RSI with a moving average for more accurate trade signals.
Stop Loss and Take Profit: Dynamic risk management with custom stop loss and take profit levels based on previous high and low prices.
Buy and Sell Alerts: Provides real-time alerts when a buy or sell signal is triggered.
Trend Confirmation: Uses the 50-period Simple Moving Average to filter signals and confirm the direction of the trend.
Visual Bar Color Changes: Makes it easy to identify bullish or bearish trends with color-coded bars.
Usage:
This strategy is suitable for traders who prefer a trend-following approach and want to combine momentum indicators (RSI) with price action (Engulfing Candlestick patterns). It is particularly useful in volatile markets where quick identification of trend changes can lead to profitable trades.
Best Used For: Day trading, swing trading, and trend-following strategies.
Timeframes: Works well on various timeframes, from 1-minute charts for scalping to daily charts for swing trading.
Markets: Can be applied to any market with sufficient liquidity (stocks, forex, crypto, etc.).
Settings:
UpLevel: The RSI level above which the market is considered bullish (default: 50).
DownLevel: The RSI level below which the market is considered bearish (default: 50).
SMA Length: The period of the Simple Moving Average used to filter trades (default: 50).
Risk Management: Customizable stop loss and take profit settings based on price action (default: 3% above/below the entry price).

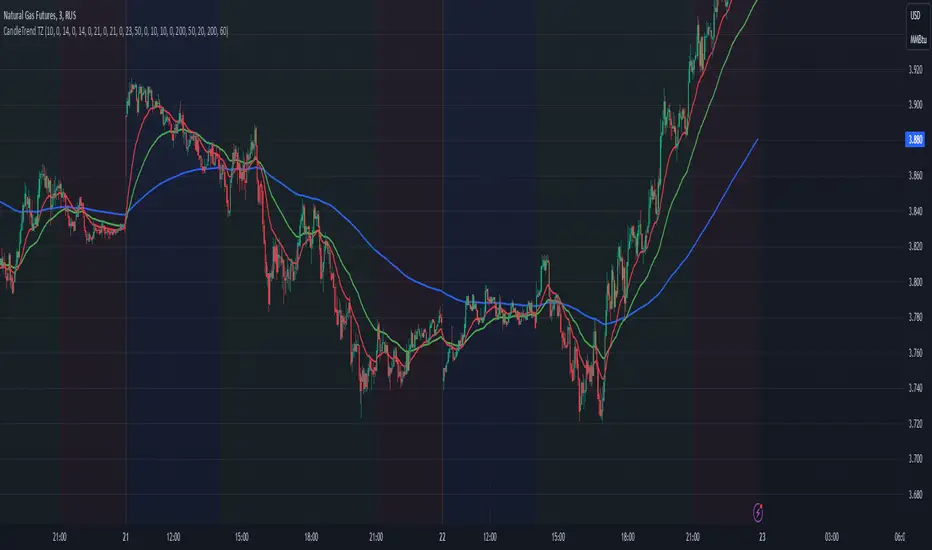
Dynamic Time Zone EMA with Candle Trend AnalysisCandleTrend TZ is a powerful analytical tool that integrates time zones, exponential moving averages (EMA), and custom candle coloring based on trend direction. This indicator is ideal for traders looking to analyze market trends within specific time sessions effectively.
Key Features:
Time Zones:
Divides the chart into four distinct time intervals, each highlighted with a unique background color.
Fully customizable start and end times for each interval, allowing for adaptation to various trading schedules.
Exponential Moving Averages (EMA):
Displays three EMAs with user-defined lengths:
EMA 200 (blue) for long-term trends.
EMA 50 (green) for medium-term trends.
EMA 20 (red) for short-term trends.
Helps identify trend direction and strength.
Custom Candle Coloring:
Utilizes smoothed Heiken Ashi and Triple EMA (TEMA) calculations for enhanced candle coloring:
Green candles indicate an upward trend.
Red candles signal a downward trend.
Filters out market noise, providing a clear visual representation of market dynamics.
Customization Options:
Time Zones:
Adjustable start and end times for each of the four sessions:
Input hour and minute for start and end times (e.g., Interval 1 Start/End Hour/Minute).
Background colors are pre-defined but can be modified in the code.
EMAs:
User-defined lengths for each EMA:
EMA 200 Length (default: 200)
EMA 50 Length (default: 50)
EMA 20 Length (default: 20)
TEMA Settings:
Parameters for trend smoothing:
TEMA Length (default: 55)
EMA Length (default: 60)
Use Cases:
Intraday Session Analysis:
Use time zones to differentiate between morning, afternoon, and evening market activity.
The background colors make it easy to track session-specific trends.
Trend Trading:
Analyze EMA crossings and their slopes to confirm market direction.
Green candles indicate buying opportunities, while red candles highlight selling signals.
Noise Reduction:
TEMA smoothing removes market noise, allowing you to focus on the primary market trend.
Adaptation to Custom Strategies:
By adjusting time intervals, you can tailor the indicator to specific trading styles or market conditions.
Benefits:
Versatility for both trending and sideways markets.
Intuitive and user-friendly setup.
Suitable for traders of all skill levels, from beginners to professionals.
CandleTrend TZ is an indispensable tool for understanding market dynamics, enhancing your trading precision, and making well-informed decisions. 🚀
RSI MACD Combined Color StrategyOverview
This indicator combines RSI and MACD signals to create a powerful visual trading system, inspired by TrendSpider's AI Strategy Coder examples. It colors candles based on the alignment of three key technical conditions, providing clear visual signals for potential trend strength and direction.
Technical Components
Core Conditions
RSI (Relative Strength Index) > 50
Indicates bullish momentum when price is trading above the centerline
Traditional indicator of trend strength
MACD Line > Signal Line
Shows positive momentum
Classic signal for potential upward movement
MACD Line > 0
Confirms bullish territory
Indicates overall positive momentum
Color Coding System
🟢 Green Candles: All three conditions are met
Strongest bullish signal
Suggests high probability trading opportunities
⚪ Grey Candles: One or two conditions are met
Neutral or transitioning market
Suggests caution or waiting for stronger confirmation
🔴 Red Candles: No conditions are met
Bearish signal
Suggests potential downward pressure
How to Use This Indicator
For Entry Signals
Look for transitions from red or grey to green candles
Green candles suggest strong bullish alignment
Consider entering long positions when candles turn green
For Exit Signals
Watch for color transitions from green to grey or red
Consider taking profits when candles change from green to grey
Consider stop losses when candles turn red
Risk Management
Use color transitions as part of your broader strategy
Don't rely solely on color changes for trading decisions
Combine with other technical analysis tools and risk management practices
Customizable Parameters
RSI Length (default: 14)
MACD Fast Length (default: 12)
MACD Slow Length (default: 26)
MACD Signal Length (default: 9)
Best Practices
Use multiple timeframes for confirmation
Look for confluences with support/resistance levels
Consider volume and market context
Start with default settings and adjust based on your trading style
Backtest different parameter combinations
Notes
This indicator works best in trending markets
Grey candles can indicate transition periods
Consider market conditions and volatility when interpreting signals
Credits
Inspired by TrendSpider's AI Strategy Coder examples and adapted for TradingView using Pine Script v5.
Disclaimer
This technical indicator is for informational purposes only. Always conduct your own analysis and consider risk management principles before making trading decisions. Past performance does not guarantee future results.

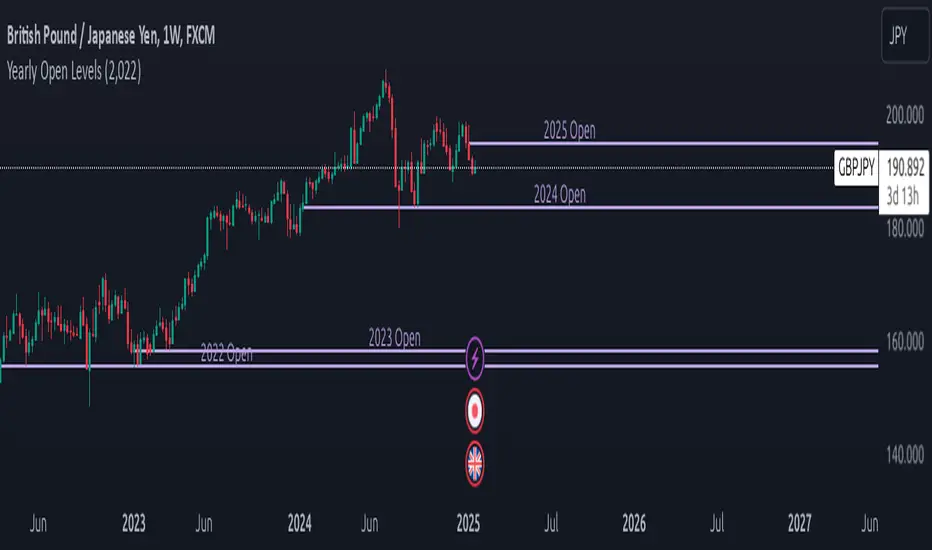
Yearly Open LevelsThe Yearly Open Levels indicator is designed to help traders visualize the opening price of each year on a price chart.
Key Features:
Yearly Open Display: Automatically calculates and displays the opening price for each year starting from a user-defined starting year. This helps traders quickly spot where the price opens each year.
Customizable Start Year: Users can set a specific year to begin displaying opening levels. The default starting year is 2022, but this can be adjusted based on individual trader needs.
Visual Lines and Labels: Each yearly open is represented by a horizontal line that extends to the right of the chart, making it easy to see the level throughout the year.
A label is placed next to the line, indicating the year and the opening price, enhancing clarity and reference while analyzing price movements.
Color Customization: Traders can choose the color of the lines and labels to fit their charting style or preferences, enhancing the visual representation on different market charts.
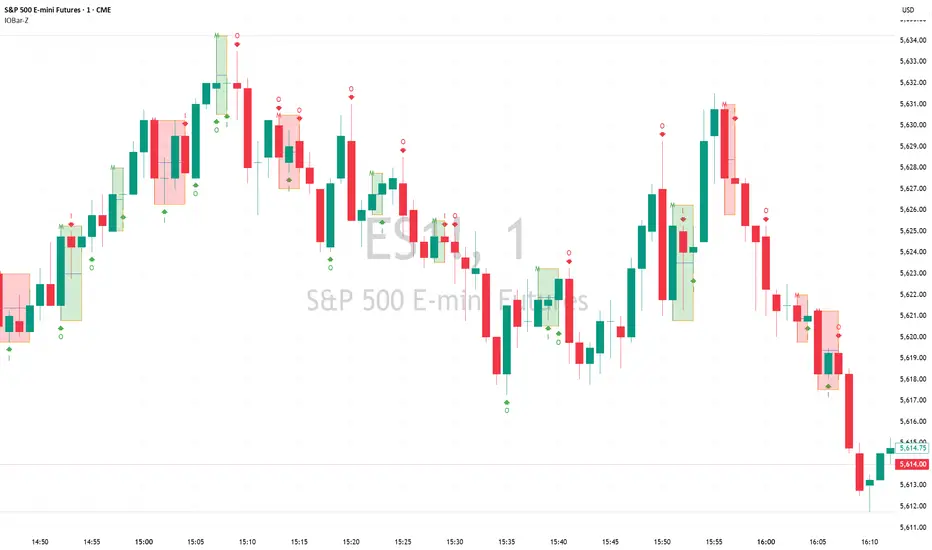
Inside Bar/Outside Bar/Mother Bar Box By SmartTrader888This Indicator shows:
1. Inside Bar
2. Outside Bar
3. Mother Bar box (Box the mother bar and all subsequent inside bars)
This indicator handles correctly the edge conditions such as:
1. bar close = bar open
2. current bar low equals to mother bar low or current bar high equals mother bar high
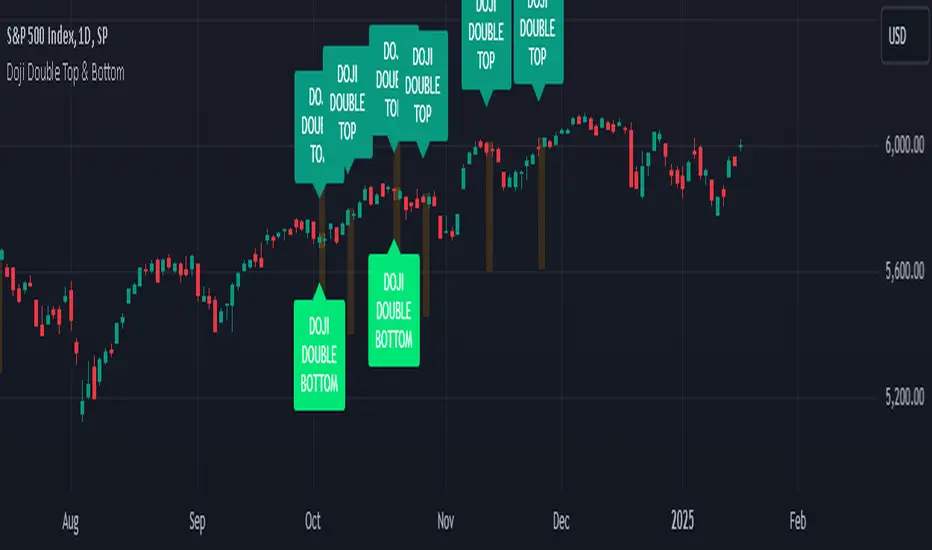
Doji Double Top & Double Bottom
FUNCTION :
This indicator checks if 2 consecutive candlesticks are formed in such a way that both the lows or both the highs of the consecutive candlesticks are almost at the same level and either of them is a doji
TIMEFRAMES :
it works on daily, weekly, monthly and higher timeframes
CRITERIA :
There is maximum difference value between 2 consecutive candlesticks' lows or 2 consecutive candlesticks' highs
Minimum value of the doji's wick size
Maximum value of the doji's body size
These 3 conditions need to be fulfilled for the 2 consecutive candlesticks to be considered as a Double top or Double bottom by this indicator
EXAMPLES :
Here the indicator is giving only double Bottom signals on CRUDE OIL chart
Here the indicator is giving only double top signals on GOLD chart
Here the indicator gives both double top & double bottom signals on EUR/USD Daily chart
Here the indicator is giving both double top & double bottom signals on EUR/USD Half-Yearly chart
DEFINITIONS :
There are 2 types -
DOJI DOUBLE BOTTOM - if the lows of 2 consecutive candlesticks are almost at the same level & either of them is doji then it is called Double Bottom and market is supposed to go higher after forming it.
DOJI DOUBLE TOP - if the highs of 2 consecutive candlesticks are almost at the same level & either of them is doji then it is called Double Top and market is supposed to go lower after forming it.
SETTINGS :
There are options to change the value of each of the 3 parameters within the indicator's settings for daily, weekly & monthly chart [
LIMITATIONS :
You should not trade based on the signals from this indicator solely, you should check other parameters too before making trading decision
Candle 1 2 3 on XAUUSD (by Veronica)Description
Discover the Candle 1 2 3 Strategy, a simple yet effective trading method tailored exclusively for XAUUSD on the 15-minute timeframe. Designed by Veronica, this strategy focuses on identifying key reversal and continuation patterns during the London and New York sessions, making it ideal for traders who prioritise high-probability entries during these active market hours.
Key Features:
1. Session-Specific Trading:
The strategy operates strictly during London (03:00–06:00 UTC) and New York (08:30–12:30 UTC) sessions, where XAUUSD tends to show higher volatility and clearer price movements.
Pattern Criteria:
- Works best if the first candle is NOT a pin bar or a doji.
- Third candle should either:
a. Be a marubozu (large body with minimal wicks).
a. Have a significant body with wicks, ensuring the close of the third candle is above Candle 2 (for Buy) or below Candle 2 (for Sell).
Callout Labels and Alerts:
Automatic Buy and Sell labels are displayed on the chart during qualifying sessions, ensuring clarity for decision-making.
Integrated alerts notify you of trading opportunities in real-time.
Risk Management:
Built-in Risk Calculator to estimate lot sizes based on your account size, risk percentage, and stop-loss levels.
Customizable Table:
Displays your calculated lot size for various stop-loss pip values, making risk management seamless and efficient.
How to Use:
1. Apply the indicator to XAUUSD (M15).
2. Focus on setups appearing within the London and New York sessions only.
3. Ensure the first candle is neither a pin bar nor a doji.
4. Validate the third candle's body placement:
For a Buy, the third candle’s close must be above the second candle.
For a Sell, the third candle’s close must be below the second candle.
5. Use the generated alerts to streamline your entry process.
Notes:
This strategy is meant to complement your existing knowledge of market structure and price action.
Always backtest thoroughly and adjust parameters to fit your personal trading style and risk tolerance.
Credit:
This strategy is the intellectual property of Veronica, developed specifically for XAUUSD (M15) traders seeking precision entries during high-volume sessions.

BarbellFX ORBThe Opening Range Breakout (ORB) strategy is a popular day trading method that focuses on the first few minutes or hours of trading. Here's how it works:
The opening range is defined as a specific time period after the market opens (commonly the first 15-30 minutes)
Traders identify the high and low prices during this opening range
These prices become support and resistance levels
Trading signals are generated when the price breaks above or below these levels:
A breakout above the opening range high suggests going long
A break below the opening range low suggests going short
PENTAD THEORY 30 MINUTE INITIAL BALANCE With Candle HighlightThis indicator is designed to highlight the 30-minute initial balance range, visualize key retracement levels, and provide insights into market behavior based on defined conditions. It also enhances clarity by applying specific color changes to the :06 and :36 minute candle in relative 30-minute intervals.
Key Features:
Initial Balance Box:
Automatically creates a price range (box) representing the first 6 minutes of each 30-minute interval.
The box dynamically updates during this period to capture the high and low prices.
Color-Coded Zones:
Inside the Box: Yellow background indicates price trading within the range.
Above the Box: Green background shows price breaking above the range.
Below the Box: Red background reflects price breaking below the range.
EMA Overlay:
Plots 3 customizable EMAs (default lengths: 9, 21, 55).
Each EMA can be toggled on/off and colored individually for trend analysis.
Retracement Levels:
Automatically calculates and displays key Fibonacci retracement levels (61.8% and 38.2%) based on the box size.
Adds a midline for additional price reference.
Candle Highlighting:
The :06 and :36 minute candle in relative 30-minute intervals is highlighted with a customizable blue color to draw attention to specific market activity.
The break above or below the 6 minute candle or the close of the 6 minute candle outside the box can help determine the direction of the 30-minute interval.
How to Use:
Trend Confirmation:
Use the EMAs to identify overall trend direction. For example, a bullish trend is indicated when shorter EMAs (e.g., 9 EMA) are above longer ones (e.g., 55 EMA).
Breakout and Retracement Analysis:
Watch for price breaking out of the initial balance box.
Observe retracement levels (61.8% and 38.2%) as potential areas for reversal or continuation.
Candle Highlight:
Pay special attention to the :06 or :36 minute candle, which is highlighted to signify its relevance in the relative 30-minute cycle.
Customization:
Adjust colors and EMA settings via the input menu to align with your trading style and chart aesthetics.
Ideal For:
Intraday traders looking to analyze initial balance ranges.
Traders focused on breakout, retracement, and trend-following strategies.
Those who benefit from visual clarity and real-time market insights.
Notes:
Ensure your chart is set to a 3-minute timeframe or lower for optimal performance.
This indicator is most effective when combined with other confluence factors, such as support/resistance zones and volume analysis.

Candles Volume HeatMap [BigBeluga]Candles Volume HeatMap
The Candle Volume HeatMap indicator is a unique and advanced tool that visualizes lower timeframe volume activity within higher timeframe candles, offering traders a granular perspective on volume distribution.
⚠️Important note: before using the indicator, it is necessary to apply it to the candles
🔵Key Features:
Volume HeatMap Visualization: The indicator breaks down each higher timeframe candle into 10 equal vertical segments (boxes) based on its high-to-low range. Each box represents a lower timeframe candle's volume activity, with more intense colors indicating stronger volume levels.
Lower Timeframe Integration: Automatically uses a timeframe 10x lower than the current chart. For example, on a 10-hour chart, it uses 1-hour candles to extract volume data.
POC (Point of Control): The highest volume box within each candle is marked with the volume value. The indicator also plots a horizontal POC line at the level of this box, highlighting significant areas of price interest. The POC line is removed once the price crosses it, ensuring the chart stays clean.
Delta Display (Optional): Traders can enable the Delta feature to analyze buyer vs. seller activity within each higher timeframe candle.
Delta is calculated by summing 10 lower timeframe candles: a bullish candle adds to buyers, while a bearish candle adds to sellers. Displays the net Delta percentage: positive values (white) indicate buyer dominance, while negative values (red) indicate seller dominance.
Dynamic Volume Scaling: The highest volume value in each candle is displayed inside its respective box, providing quick insights into critical price-volume levels.
🔵How It Works:
For each higher timeframe candle, the indicator analyzes 10 lower timeframe candles and maps their volume into 10 segments (boxes) between the high and low of the current candle.
The intensity of each box's color corresponds to the relative volume of the lower timeframe candle it represents.
The POC highlights the price level with the highest concentration of volume, aiding in identifying potential support/resistance zones.
Delta analysis offers additional insights into market sentiment by breaking down buyer and seller activity in each candle.
🔵Use Cases:
Spotting key volume areas within higher timeframe candles to identify support and resistance levels.
Analyzing volume concentration for potential breakout or reversal zones.
Leveraging Delta analysis to gauge market sentiment and confirm volume-based trends.
This indicator is ideal for traders seeking to combine volume analysis with price action, offering precise insights into volume distribution and market dynamics.

HTF CandlesHTF Candles, Plot of a Higher/Lower Timeframe Candles on any chart.
This HTF / LTF candle plot displays the previous 3 daily candles with the current update of the price with reference to a lower time frame.
Candles includes 3 Candles of HTF
last HTF candle includes 4 previous candles from LTF
Candle High Low Open Close are plotted.
these OHLC values act as Support and Resistance With reference to current Price.
very useful in making HTF and LTF analysis with reference to current timeframe.

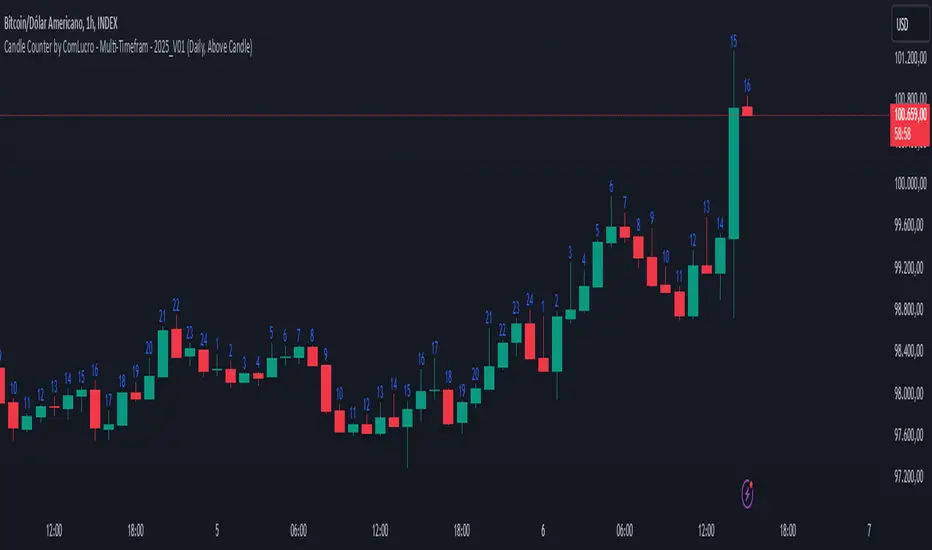
Candle Counter by ComLucro - Multi-Timefram - 2025_V01Candle Counter by ComLucro - Multi-Timeframe - 2025_V01
The Candle Counter by ComLucro - Multi-Timeframe is a highly customizable tool designed to help traders monitor the number of candles across various timeframes directly on their charts. Whether you're analyzing trends or tracking specific market behaviors, this indicator provides a seamless and efficient way to enhance your technical analysis.
Key Features:
Flexible Timeframe Selection: Track candle counts on yearly, monthly, weekly, daily, or hourly intervals to suit your trading style.
Dynamic Label Positioning: Choose to display labels above or below candles, offering greater control over your chart layout.
Customizable Colors: Adjust label text colors to match your chart's aesthetics and improve visibility.
Clean and Organized Visualization: Automatically generates labels for each candle without overcrowding your chart.
How It Works:
Select a Timeframe: Choose from yearly, monthly, weekly, daily, or hourly intervals based on your analysis needs.
Automatic Counting: The indicator calculates and displays the number of candles for the selected period directly on your chart.
Label Customization: Adjust the position (above or below the candles) and color of the labels to align with your preferences.
Why Use This Indicator?
This script is perfect for traders who need a clear and visual representation of candle counts in specific timeframes. Whether you're monitoring trends, evaluating price action, or developing strategies, the Candle Counter by ComLucro adapts to your needs and helps you make informed decisions.
Disclaimer:
This script is intended for educational and informational purposes only. It does not constitute financial advice. Always practice responsible trading and ensure this tool aligns with your strategies and risk management practices.
About ComLucro:
ComLucro is dedicated to providing traders with practical tools and educational resources to improve decision-making in the financial markets. Discover other scripts and strategies developed to enhance your trading experience.
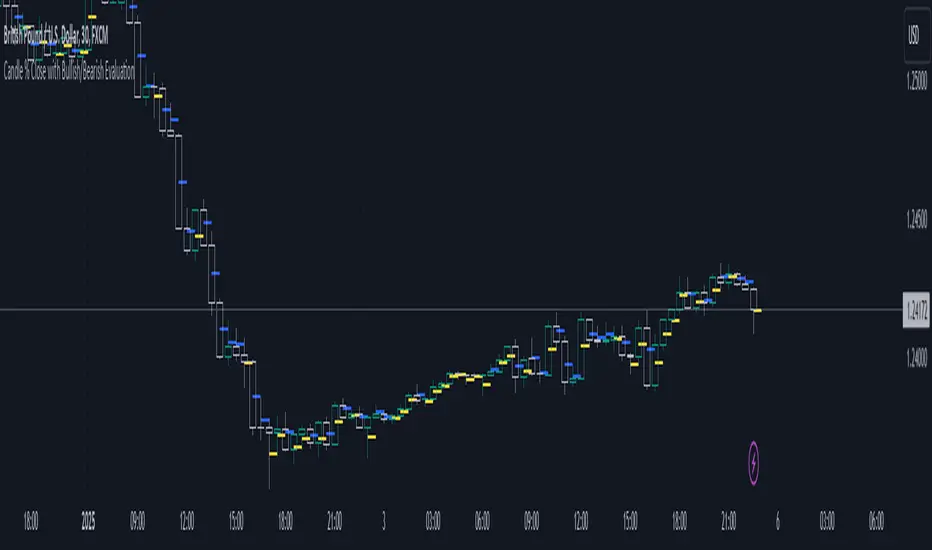
Candle % Close with Bullish/Bearish EvaluationI created the indicator to more quickly define the polarity of candles. For a large number of candles, it is straightforward to determine whether a candle is bullish or bearish. However, candles with long wicks often appear, making it uncertain whether the candle is bullish or bearish from a price action perspective. It is not a rule that a red candle is bearish and a green candle is bullish.
From a more advanced price action standpoint, how these candles close is important. Therefore, I created the 'Percent range' input. By default, it is set to 50% (high-low)/2. This way, the indicator precisely determines 50% of the candle's entire range. This allows us to determine whether a bearish candle truly closed below 50% of its range. If not, such a candle is considered bullish, even if it is a negative candle. The same applies to bullish candles, but conversely. If a positive candle closes below 50% of its range, from a price action perspective, it is considered a bearish candle.
Since in price action it is common for the price to return to 50% of the previous candle and, after filling, to continue in the established trend, I added the line extension option. Whatever high value you enter, the line extension follows the current candle. This option works only when the stop line checkbox is enabled. This way, you can plot 50% of the candle's range that the market has historically not returned to due to a strong trend. Often, this line is plotted on a candle where there is also an FVG, which can help you more easily find a point of interest.
Stop line extension : Ensures the interruption of line plotting when the candle is touched by the body or wick.
PreannFXExplanation of the PreannFX indicator:
Candle Body Size:
The body of the current candle is larger than the previous candle.
Bullish Engulfing:
The current candle closes higher than the previous candle's high.
The body size is larger than the previous candle.
Bearish Engulfing:
The current candle closes lower than the previous candle's low.
The body size is larger than the previous candle.
Entry and Exit:
Bullish: Enter at the previous candle's open or high, stop loss at the previous low, and take profit is 1:1 with the stop loss.
Bearish: Enter at the previous candle's open or low, stop loss at the previous high, and take profit is 1:1 with the stop loss.
Visualization:
Green upward arrows for bullish engulfing patterns.
Red downward arrows for bearish engulfing patterns.
