BB Buy SellBollinger Bantları kullanarak alım ve satım sinyalleri tespit etmelerine yardımcı olur.
Bollinger Bantları:
Üst Bollinger Bandı (Upper Bollinger Band): Fiyatın üst sınırını belirler. Fiyat bu bandın üstüne çıktığında aşırı alım durumu olabilir.
Alt Bollinger Bandı (Lower Bollinger Band): Fiyatın alt sınırını belirler. Fiyat bu bandın altına düştüğünde aşırı satım durumu olabilir.
Orta Bandı (Basis): 20 periyotluk Basit Hareketli Ortalama (SMA) kullanılarak hesaplanır. Bu, fiyatın orta noktasıdır.
Alım ve Satım Sinyalleri:
Fiyat, orta bandı yukarı doğru keserse (crossover), bu bir "al" sinyali olarak değerlendirilir ve küçük yeşil üçgenlerle gösterilir.
Fiyat, orta bandı aşağı doğru keserse (crossunder), bu bir "sat" sinyali olarak değerlendirilir ve küçük kırmızı üçgenlerle gösterilir.
İkinci Mumda Arka Plan Rengi:
Fiyat orta bandı kesip iki mum sonra, ilgili sinyal mavi arka plan rengiyle vurgulanır. Bu, yatırımcılara ek bir görsel ipucu sağlar.
Bollinger Bantlarını Plotlama:
Üst, alt ve orta Bollinger bantları grafikte farklı renklerde gösterilir. (Üst bant kırmızı, alt bant yeşil, orta bant mavi)
Bu gösterge, yatırımcılara grafik üzerinde alım ve satım noktalarını daha kolay belirlemelerine yardımcı olur ve fiyat hareketlerini daha net bir şekilde görselleştirir.
Wstęgi Bolingera (BB)

BB + SMA120Custom Bollinger Band with SMA Alert Indicator
This script is a customized Bollinger Band indicator with added alerts based on specific conditions related to a 120-period Simple Moving Average (SMA). This indicator is designed for traders who want to receive alerts when certain interactions occur between the Bollinger Bands and the SMA levels, providing potentially valuable signals in trend-following or mean-reversion strategies.
Key Features:
Bollinger Bands Calculation:
The script calculates a standard 25-period Bollinger Band using a customizable standard deviation. The bands consist of an upper, middle (basis), and lower line, allowing traders to observe volatility and potential support/resistance levels.
120 SMA High and Low Levels:
A 120-period SMA of high and low prices is added to the chart, providing a reference for longer-term trend direction and creating a range within which the Bollinger Bands can be evaluated.
Conditional Alerts:
Scenario 1: An alert is triggered when the Bollinger Bands remain above the 120 SMA high and low, and the price taps the lower Bollinger Band. This can be useful for spotting potential buy entries in an uptrend when prices retrace to the lower band.
Scenario 2: An alert is triggered when the Bollinger Bands remain below the 120 SMA high and low, and the price taps the upper Bollinger Band. This may help identify potential sell entries in a downtrend when prices retrace to the upper band.
Visual Aids:
The 120 SMA high and low lines are plotted on the chart with color fills, making it easy to visualize the trend and range boundaries.
Color-coded Bollinger Bands help highlight potential areas of interest based on volatility.
How to Use:
Add this indicator to your chart, configure the Bollinger Band length, and set your alert preferences. Alerts can be managed through TradingView's alert panel, where you can select the scenarios based on price interaction with the bands.
Recommended Use:
This indicator can be helpful for price action traders and mean-reversion strategies in Forex, stocks, and other markets where Bollinger Bands and moving averages are used.
Alerts may provide early signals for potential trade setups, although further confirmation and analysis are advised before entry.

#Hussarya Bollinger Bands mod v 3.0
Bollinger Bands.
Double ribbon drawing.
Two different settings for each band.
Filling areas when the faster band goes beyond the slow band.
Possibility to add EMA with price shading.
All ribbons and shading can be turned on independently.

Bollinger Band SignalCara Membaca Indikator :
1. Bollinger Bands:
--> Terdiri dari tiga garis: garis tengah (Middle Band), garis atas (Upper Band), dan garis bawah (Lower Band).
--> Middle Band adalah rata-rata bergerak sederhana (SMA) dari harga penutupan dalam periode tertentu
--> Upper Band dan Lower Band dihasilkan dengan menambahkan dan mengurangi deviasi standar harga dari Middle Band, dengan faktor pengali tertentu
2. Stochastic RSI:
--> Digunakan untuk mengukur kekuatan tren harga relatif terhadap rentang waktu tertentu.
Menggunakan kombinasi dari Slow%K dan Slow%D untuk menentukan kondisi jenuh beli atau jenuh jual.
--> Sinyal beli dihasilkan saat Stochastic RSI berada di bawah Lower Limit (default 20) dan melewati garis bawah Bollinger Bands.
--> Sinyal jual dihasilkan saat Stochastic RSI berada di atas Upper Limit (default 80) dan melewati garis atas Bollinger Bands.
3. Kondisi Bearish dan Bullish:
--> Bearish: Ditandai dengan harga penutupan saat ini di bawah Upper Band setelah harga penutupan sebelumnya berada di atas Upper Band. Bersamaan dengan itu, Stochastic RSI juga harus berada di atas Upper Limit. Jika ini terjadi, indikator menampilkan label "Jual" di atas bar.
--> Bullish: Ditandai dengan harga penutupan saat ini di atas Lower Band setelah harga penutupan sebelumnya berada di bawah Lower Band. Pada saat yang sama, Stochastic RSI harus berada di bawah Lower Limit. Jika kondisi ini terpenuhi, indikator menampilkan label "Beli" di bawah bar.

Pivot Bollinger BandThis is a special kind of Bollinger Bands indicator that adapts to the market's pivot points. Instead of using regular price data, it first finds important swing highs and lows in the market (called pivot points). It then uses these pivot points to create a center line, which is like a moving average of where the market is pivoting.
Around this center line, it draws the classic Bollinger Bands - an upper and lower band that show where prices might find resistance or support. The distance between these bands changes based on market volatility, just like regular Bollinger Bands. You can adjust how sensitive it is to pivot points and how wide the bands should be.
By using pivot point based Bollinger Bands, we expect band breakout can be captured more effectively.

Breakout & Distribution DetectorHow the Script Works:
1. Bollinger Bands:
• The upper and lower Bollinger Bands are used to detect volatility and potential breakouts. When the price closes above the upper band, it’s considered a bullish breakout. When the price closes below the lower band, it’s a bearish breakout.
2. RSI (Relative Strength Index):
• The RSI is used for momentum confirmation. A bullish breakout is confirmed if the RSI is above 50, and a bearish breakout is confirmed if the RSI is below 50.
• If the RSI enters overbought (above 70) or oversold (below 30) levels, it signals a distribution phase, indicating the market may be ready to reverse or consolidate.
3. Moving Average:
• A simple moving average (SMA) of 20 periods is used to ensure we’re trading in the direction of the trend. Breakouts above the upper Bollinger Band are valid if the price is above the SMA, while breakouts below the lower Bollinger Band are valid if the price is below the SMA.
4. Signals and Alerts:
• BUY Signal: A green “BUY” label appears below the candle if a bullish breakout is detected.
• SELL Signal: A red “SELL” label appears above the candle if a bearish breakout is detected.
• Distribution Phase: The background turns purple if the market enters a distribution phase (RSI in overbought or oversold territory).
• Alerts: You can set alerts based on these conditions to get notifications for breakouts or when the market enters a distribution phase.

Trend, Momentum and Price value analysis Extended [deepakks444]Trend, Momentum, and Price Value Analysis Extended
This Pine Script™ indicator is designed to offer traders a comprehensive overview of price trends, momentum, and market strength through the use of several widely-recognized technical analysis tools. The indicator integrates multiple signals and plots directly on the chart, as well as a customizable table to help visually organize and interpret the data. Here’s an overview of the key features included:
Key Features:
VWAP (Volume-Weighted Average Price): Calculates the average price weighted by volume to give insight into whether the price is above or below the market's fair value.
Alligator Indicator: Uses a combination of three moving averages (jaw, teeth, and lips) to help identify trending conditions.
Supertrend: A trend-following indicator that signals potential buy or sell opportunities based on price movements relative to a dynamically calculated support/resistance line.
20-period Moving Average (MA): A basic moving average to smooth out price data and highlight the underlying trend.
MACD (Moving Average Convergence Divergence): Helps identify changes in the strength, direction, and momentum of a trend.
Volume with Moving Average: Compares current volume against its moving average to identify potential volume spikes.
RSI (Relative Strength Index): Measures the speed and change of price movements, signaling overbought or oversold conditions.
ADX (Average Directional Index): An indicator used to quantify trend strength, helping traders determine whether the market is trending or in a range.
Pivot Points: Calculates daily pivot points and identifies support and resistance levels based on price movements.
Bollinger Bands: A volatility indicator that uses standard deviation to highlight potential overbought or oversold conditions.
Customization Options:
Modify the length of the price and volume moving averages.
Adjust RSI thresholds for buy and sell signals.
Set the thresholds for ADX to differentiate between weak, average, and strong trends.
Toggle the visibility of the 20-period MA and Supertrend on the chart.
Choose to display the percentage difference between the current price and indicator values in the table.
Table Display:
The indicator includes a table that summarizes the status of all signals, showing:
Signal (Buy/Sell/Neutral): Based on each indicator's interpretation of price action.
Percentage Difference: Optional display of how far the price is from the reference level (e.g., the difference between the price and VWAP, Supertrend line, or Moving Average).
The table allows traders to quickly assess the current market conditions across several indicators in one place, making it easier to gauge overall market sentiment.
Signal Logic:
This indicator uses a scoring system to calculate the percentage of indicators signaling a buy or sell. If the buy or sell score reaches 70% or higher, the indicator will plot buy or sell signals on the chart. The combined signal logic is displayed in the table as "Buy," "Sell," or "No Signal," based on the majority of the contributing indicators.
Intended Use:
This tool is designed to assist traders in their technical analysis by consolidating multiple popular indicators into one script. It provides a clear visual representation of various market signals, helping traders to make informed decisions about potential trade entries and exits. However, this indicator is for educational purposes and should not be used as financial advice. Traders should always use proper risk management and conduct their own research before making any trading decisions.
Disclaimer: This script is for educational purposes only and does not constitute financial advice. Trading involves risk, and past performance of an indicator does not guarantee future results. Please use it alongside proper risk management practices.

BBPCT For Loop | viResearchBBPCT For Loop | viResearch
Conceptual Foundation and Innovation
The "BBPCT For Loop" script is designed to combine Bollinger Bands with a percentage calculation to identify market trends and mean reversion opportunities. Bollinger Bands Percentage (BBPCT) evaluates where the current price stands between the upper and lower bands of Bollinger Bands, providing a more dynamic view of price extremes. This script incorporates a loop-based scoring mechanism that further refines the analysis, giving traders a clearer indication of potential trend shifts or reversion zones.
By incorporating both the BBPCT and a for-loop system, this indicator enhances the ability to spot overbought or oversold conditions, helping traders make more informed decisions based on market momentum.
Technical Composition and Calculation
The "BBPCT For Loop" script uses Bollinger Bands to establish dynamic upper and lower boundaries around price, calculated using standard deviation. Here’s how the core components are structured:
Bollinger Bands Percentage (BBPCT): BBPCT calculates the position of the price relative to the upper and lower Bollinger Bands. This creates a percentage range from 0% to 100%, with values near 0% indicating proximity to the lower band (potentially oversold) and values near 100% signaling closeness to the upper band (potentially overbought).
For-Loop Scoring System: The script employs a loop that iterates over a range of values. For each value, it evaluates whether the BBPCT is above or below a threshold, adjusting the score accordingly. This scoring mechanism helps detect when price action is shifting toward a bullish or bearish trend.
Mean Reversion Zones: The script defines specific "green" and "red" zones based on the BBPCT value. These zones visually highlight potential mean reversion areas where price may reverse direction.
Features and User Inputs
This script offers a variety of customizable inputs that allow traders to fine-tune it for different market conditions:
BBPCT Length: Controls the lookback period for calculating the Bollinger Bands. Adjusting this period affects how reactive the indicator is to price changes.
Standard Deviation Multiplier: This input adjusts the width of the Bollinger Bands, influencing the sensitivity of the BBPCT calculation.
Thresholds: The script includes user-defined thresholds for detecting uptrends and downtrends based on the BBPCT score. Traders can adjust these thresholds to make the indicator more or less sensitive to market shifts.
Bar Coloring: The script optionally colors bars based on detected trends, providing a visual cue for potential bullish or bearish conditions.
Alerts: Alerts are triggered when the BBPCT crosses above or below the user-defined thresholds, notifying traders of potential long or short opportunities.
Practical Applications
The "BBPCT For Loop" script is ideal for traders who employ mean reversion or trend-following strategies. Its application can be particularly effective in:
Spotting Overbought and Oversold Conditions: The BBPCT provides a dynamic measure of where the price is within the Bollinger Bands, helping to detect when the market is approaching an extreme, signaling potential reversion opportunities.
Confirming Trend Shifts: The for-loop scoring mechanism offers a more detailed analysis of whether the market is entering an uptrend or downtrend, helping traders to time their entries or exits more effectively.
Mean Reversion Trading: The inclusion of green and red zones helps highlight areas where the price may be more likely to revert to the mean, providing valuable insight for mean reversion traders.
Advantages and Strategic Value
This script enhances the traditional Bollinger Bands indicator by introducing a loop-based scoring system and mean reversion zones. These additions make the indicator more versatile and adaptable to various trading styles. By dynamically adjusting to market conditions, the BBPCT For Loop helps reduce the risk of false signals and improves the accuracy of identifying overbought or oversold conditions.
Summary and Usage Tips
The "BBPCT For Loop" script is a powerful tool that combines the flexibility of Bollinger Bands with a robust scoring system. Traders can use it to identify overbought or oversold conditions, confirm trend shifts, and improve the timing of trades. Adjust the Bollinger Bands length and standard deviation multiplier based on the asset you're trading to get the best results.
Remember to test the script across different market conditions and timeframes to understand how it performs. Backtests are essential for gauging its effectiveness, but keep in mind that past performance does not guarantee future results.

Theoretical price by volumeThis code is used to calculate a theoretical price range based on volume and price change and display it on the chart. Specifically, it calculates the “theoretical price volatility” based on price changes and volume, from which the upper and lower price limits are derived.
The price volatility is calculated by dividing the price change by the volume as the change unit volume.
Based on this volatility, we calculate the theoretical variation relative to the current price (“Theoretical Variance Difference”).
Based on the results, **Theoretical High Price (p_price) and Theoretical Low Price (m_price)** are calculated.
The chart displays the upper and lower bounds of these theoretical prices in color, and also calculates their mean and standard deviation (in the form of a Bollinger band) and plots them.
The background color on the chart indicates whether the price is within the theoretical price range, and at the same time, the mean and standard deviation of the theoretical prices are used to visualize price movements in more detail.
This indicator helps traders understand the impact of volume on price movements and helps them determine if prices are staying within the theoretical range or if there are unusual movements.

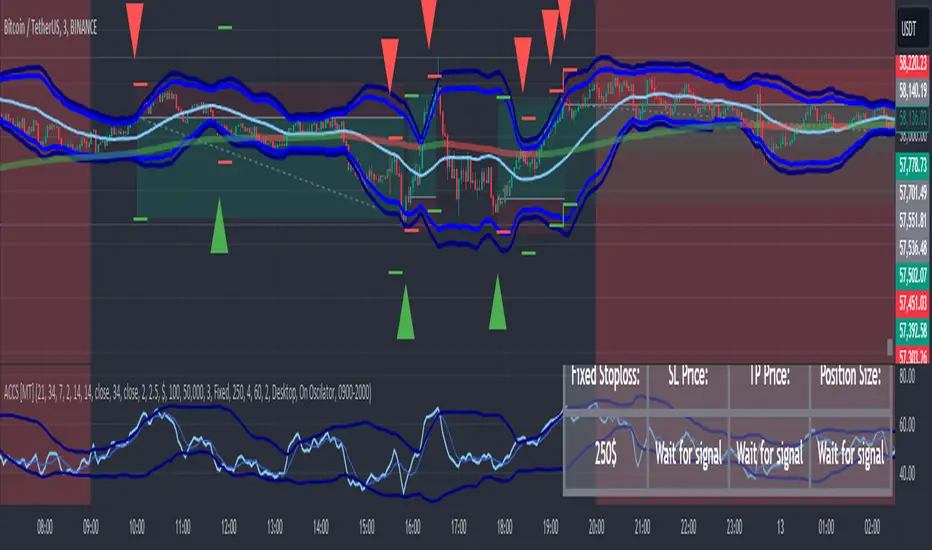
ACCScanner[MaximizedTrading]- ACCScanner -
ACCScanner is a highly advanced and versatile TradingView indicator, specifically designed to enhance and simplify your trading experience. Whether you are a beginner or an experienced trader, ACCScanner provides all the tools you need to make informed and timely trading decisions. With a user-friendly settings menu, cutting-edge signal filtering technology, and a comprehensive alert system, ACCScanner ensures that you stay ahead of the market and never miss a key trading opportunity.
This indicator is built to adapt to your unique trading strategy, allowing for full customization and optimization. ACCScanner offers a seamless trading experience by eliminating unnecessary noise, providing only the most relevant signals, and helping you execute trades with confidence.
__________________________________________________________________
🔑 Key Features:
Comprehensive Alert System: Stay ahead of the market with dynamic alerts. A "Signal incoming!" alert is triggered when trade conditions align, followed by a clear "Buy/Sell Signal" when conditions are met. Visual indicators (red for sell, green for buy) appear on the chart.
Clear and Customizable Settings: Easily customize ACCScanner for your trading strategy with a user-friendly settings menu. Switch between Desktop and Mobile modes for optimal performance.
Trading Session Time: Optimize your trading with improved session time settings for maximum efficiency.
Bollinger Bands: These bands measure market volatility, helping you identify strong signals and potential trend reversals.
RSI Bands: The RSI Bands are designed to provide an additional layer of confirmation by showing the strength of a signal. This helps you assess whether a trade setup is reliable or if caution is warranted.
EMA 200: The EMA 200 serves as a trend indicator, helping you identify the overall market direction. You can also choose to take less strong signals, as long as they align with the prevailing trend, ensuring you stay on the right side of the market.
Advanced Signal Filtering: Eliminate unnecessary signals with additional oscillator bands when signal filtering is enabled. The oscillator’s position shows signal strength—more transparent icons indicate weaker signals, focusing only on high-probability trades.
Integrated Stop Loss and Take Profit Options: Protect your trades with a range of stop loss settings, including Wick Multiplier, Fixed Stoploss, or Average Candle Size. Additionally, you can set a custom Risk Ratio for Take Profit levels, ensuring your risk management is aligned with your strategy.
Position Size Calculation: Once your settings are properly configured, ACCScanner can calculate the ideal position size, helping you manage risk and optimize trades effectively.
__________________________________________________________________
🎯 Why Choose ACCScanner?
ACCScanner stands out with its powerful alert system, allowing you to stay ahead of the market without constantly monitoring your charts. After setting up the alerts, you’ll receive a "Signal incoming" notification when a potential trade is forming. Once the conditions are fully met, a clear "Buy/Sell Signal" alert will notify you, enabling swift action—even if you're away from the screen.
The ACCScanner oscillator helps you quickly assess signal strength. The light blue line (RSI) moving outside the dark blue line (Bands) indicates stronger setups, and with the Signal Strength filter, you can further refine signals. Transparent icons represent weaker signals, ensuring you focus only on high-probability trades.
ACCScanner also offers precise Stoploss, Price, and Position Size calculations, built directly into the indicator. This feature helps you manage risk efficiently. With integrated Average Candle Size calculations and customizable stop loss options, ACCScanner ensures you are trading with optimized risk management. Once all settings are correctly configured under 'Account Info', you can use the table values to execute trades with confidence.
What makes ACCScanner worth paying for is its ability to save time and enhance trading efficiency. By providing early alerts, you have time to prepare for key trading opportunities before they fully develop. This proactive approach allows you to focus on making confident decisions at the right moment, without being overwhelmed by excessive information. Additionally, the well-organized table simplifies trading by displaying all the necessary values, so you can focus on executing your strategy seamlessly.
__________________________________________________________________
How to Use the ACCScanner?
⚙️ Setup Alerts
To use the ACCScanner effectively, it's crucial to set up the indicator correctly beforehand. Make sure to configure all the settings under the 'Account Info' section at the bottom of the settings menu. Proper setup is necessary to function correctly!
To set up alerts, first ensure all settings are correctly configured. Then, hover over the indicator with your mouse and click on the three dots that appear. Select 'Add Alert on ACCS ' and configure the alert settings.
🏹 3 Steps to Place a Trade with ACCScanner
Step 1: Wait for the "Signal Incoming" Alert
Once you've set up your alerts, ACCScanner will notify you when a potential trade is forming with the "Signal Incoming" alert. This is your early signal to prepare for a possible trade. At this point, begin observing the market and focus on the key indicators, such as the RSI Bands and Bollinger Bands. Check if the price or RSI is touching or approaching the outer bands, which could indicate a strong setup.
Step 2: Analyze the Situation
While waiting for the final signal, confirm whether the market conditions align with the trade strategy. If the RSI or Bollinger Bands are interacting with their respective boundaries, this strengthens the potential trade signal. Stay ready and keep a close watch on the chart for the final signal.
Step 3: React Quickly to the "Buy/Sell Signal" Alert
When you receive the "Buy/Sell Signal" alert, it means the conditions for the trade are fully met. Act quickly and use the data provided in the ACCScanner table—including Stoploss distance, Stoploss price, and Position size—to place your trade. Ensure all the settings have been configured properly under 'Account Info' beforehand so you can execute the trade smoothly and confidently.
__________________________________________________________________
📌 CONCLUSION
We believe that true success comes from the synergy between the trader and the indicator, rather than relying solely on the tool itself for profitability. While many traders expect an indicator to generate profits on its own, the reality is much more nuanced.
Our goal with ACCScanner is to offer a comprehensive, customizable, and easy-to-use tool that helps traders develop a deeper understanding of market dynamics. By using ACCScanner as a support tool for informed decision-making, any trader can enhance their trading strategy and gain the confidence to act effectively.
__________________________________________________________________
⚠️ Disclaimer
Past performance does not guarantee future results. All content, tools, scripts, articles, & education provided by MaximizedTrading are purely for informational & educational purposes only. Past performance is no guarantee of future results.
Uptrick: Market MoodsThe "Uptrick: Market Moods" indicator is an advanced technical analysis tool designed for the TradingView platform. It combines three powerful indicators—Relative Strength Index (RSI), Average True Range (ATR), and Bollinger Bands—into one cohesive framework, aimed at helping traders better understand and interpret market sentiment. By capturing shifts in the emotional climate of the market, it provides a holistic view of market conditions, which can range from calm to stressed or even highly excited. This multi-dimensional analysis tool stands apart from traditional single-indicator approaches by offering a more complete picture of market dynamics, making it a valuable resource for traders looking to anticipate and react to changes in market behavior.
The RSI in the "Uptrick: Market Moods" indicator is used to measure momentum. RSI is an essential component of many technical analysis strategies, and in this tool, it is used to identify potential market extremes. When RSI values are high, they indicate an overbought condition, meaning the market may be approaching a peak. Conversely, low RSI values suggest an oversold condition, signaling that the market could be nearing a bottom. These extremes provide crucial clues about shifts in market sentiment, helping traders gauge whether the current emotional state of the market is likely to result in a reversal. This understanding is pivotal in predicting whether the market is transitioning from calm to stressed or from excited to overbought.
The Average True Range adds another layer to this analysis by offering insights into market volatility. Volatility is a key factor in understanding the mood of the market, as periods of high volatility often reflect high levels of excitement or stress, while low volatility typically indicates a calm, steady market. ATR is calculated based on the range of price movements over a given period, and the higher the value, the more volatile the market is. The "Uptrick: Market Moods" indicator uses ATR to dynamically gauge volatility levels, helping traders understand whether the market is currently moving in a way that aligns with its emotional mood. For example, an increase in ATR accompanied by an RSI value that indicates overbought conditions could suggest that the market is in a highly excited state, with the potential for either strong momentum continuation or a sharp reversal.
Bollinger Bands complement these tools by providing visual cues about price volatility and the range within which the market is likely to move. Bollinger Bands plot two standard deviations away from a simple moving average of the price. This banding technique helps traders visualize how far the price is likely to deviate from its average over a certain period. The "Uptrick: Market Moods" indicator uses Bollinger Bands to establish price boundaries and identify breakout conditions. When prices break above the upper band or below the lower band, it often signals that the market is either highly stressed or excited. This breakout condition serves as a visual representation of the market mood, alerting traders to moments when prices are moving beyond typical ranges and when significant emotional shifts are occurring in the market.
Technically, the "Uptrick: Market Moods" indicator has been developed using TradingView’s Pine Script language, a highly efficient language for building custom indicators. It employs functions like ta.rsi, ta.atr, and ta.sma to perform the necessary calculations. The use of these built-in functions ensures that the calculations are both accurate and efficient, allowing the indicator to operate in real-time without lagging, even in volatile market conditions. The ta.rsi function is used to compute the Relative Strength Index, while ta.atr calculates the Average True Range, and ta.sma is used to smooth out price data for the Bollinger Bands. These functions are applied dynamically within the script, allowing the "Uptrick: Market Moods" indicator to respond to changes in market conditions in real time.
The user interface of the "Uptrick: Market Moods" indicator is designed to provide a visually intuitive experience. The market mood is color-coded on the chart, making it easy for traders to identify whether the market is calm, stressed, or excited at a glance. This feature is especially useful for traders who need to make quick decisions in fast-moving markets. Additionally, the indicator includes an interactive table that updates in real-time, showing the most recent mood state and its frequency. This provides valuable statistical insights into market behavior over specific time frames, helping traders track the dominant emotional state of the market. Whether the market is in a prolonged calm state or rapidly transitioning through moods, this real-time feedback offers actionable data that can help traders adjust their strategies accordingly.
The RSI component of the "Uptrick: Market Moods" indicator helps detect the speed and direction of price movements, offering insight into whether the market is approaching extreme conditions. By providing signals based on overbought and oversold levels, the RSI helps traders decide whether to enter or exit positions. The ATR element acts as a volatility gauge, dynamically adjusting traders’ expectations in response to changes in market volatility. Meanwhile, the Bollinger Bands help identify trends and potential breakout conditions, serving as an additional confirmation tool that highlights when the price has moved beyond normal boundaries, indicating heightened market excitement or stress.
Despite the robust capabilities of the "Uptrick: Market Moods" indicator, it does have limitations. In markets affected by sudden shifts, such as those driven by major news events or external economic factors, the indicator’s performance may not always be reliable. These external factors can cause rapid mood swings that are difficult for any technical analysis tool to fully anticipate. Additionally, the indicator’s complexity may pose a learning curve for novice traders, particularly those who are unfamiliar with the concepts of RSI, ATR, and Bollinger Bands. However, with practice, traders can become proficient in using the tool to its full potential, leveraging the insights it provides to better navigate market shifts.
For traders seeking a deeper understanding of market sentiment, the "Uptrick: Market Moods" indicator is an invaluable resource. It is recommended for those dealing with medium to high volatility instruments, where understanding emotional shifts can offer a strategic advantage. While it can be used on its own, integrating it with other forms of analysis, such as fundamental analysis and additional technical indicators, can enhance its effectiveness. By confirming signals with other tools, traders can reduce the likelihood of false signals and improve their overall trading strategy.
To further enhance the accuracy of the "Uptrick: Market Moods" indicator, it can be integrated with volume-based tools like Volume Profile or On-Balance Volume (OBV). This combination allows traders to confirm the moods identified by the indicator with volume data, providing additional confirmation of market sentiment. For example, when the market is in an excited mood, an increase in trading volume could reinforce the reliability of that signal. Conversely, if the market is stressed but volume remains low, traders may want to proceed with caution. Using multiple indicators together creates a more comprehensive trading approach, helping traders better manage risk and make informed decisions based on multiple data points.
In conclusion, the "Uptrick: Market Moods" indicator is a powerful and unique addition to the suite of technical analysis tools available on TradingView. It provides traders with a multi-dimensional view of market sentiment by combining the analytical strengths of RSI, ATR, and Bollinger Bands into a single tool. Its ability to capture and interpret the emotional mood of the market makes it an essential tool for traders seeking to gain an edge in understanding market behavior. While the indicator has certain limitations, particularly in rapidly shifting markets, its ability to provide real-time insights into market sentiment is a valuable asset for traders of all experience levels. Used in conjunction with other tools and sound trading practices, the "Uptrick: Market Moods" indicator offers a comprehensive solution for navigating the complexities of financial markets.

Options Series - Explode BB⭐ Bullish Zone:
⭐ Bearish Zone:
⭐ Neutral Zone:
The provided script integrates Bollinger Bands with different lengths (20 and 200 periods) and applies customized candle coloring based on certain conditions. Here's a breakdown of its importance and insights:
⭐ 1. Dual Bollinger Bands (BBs):
Bollinger Bands (BB) with 20-period length:
This is the standard setting for Bollinger Bands, with a 20-period simple moving average (SMA) as the central line and upper/lower bands derived from the standard deviation.
These bands are used to identify volatility. Wider bands indicate higher volatility, while narrower bands indicate low volatility.
200-period BB:
This is a longer-term indicator providing insight into the overall trend and long-term volatility.
The 200-period bands filter out noise and offer a "macro" view of price movements compared to the 20-period bands, which focus on short-term price actions.
⭐ 2. Overlay of Bollinger Bands and SMA:
The script plots the Bollinger Bands along with the SMA (Simple Moving Average) of the 200-period BB. This gives traders both a short-term (20-period) and long-term (200-period) perspective, which is valuable for detecting major trend shifts or key support and resistance zones.
Using multiple time frames (20-period for short-term and 200-period for long-term) can help traders spot both immediate opportunities and overarching trends.
⭐ 3. Candle Coloring Based on Key Conditions:
Bullish Signal (GreenFluroscent): When the price closes above the upper 200-period Bollinger Band, the candle turns green, indicating a potential bullish breakout.
Bearish Signal (RedFluroscent): If the price closes below the lower 200-period Bollinger Band, the candle turns red, suggesting a bearish breakout.
Neutral or Uncertain Market: Candles are gray when the price remains between the upper and lower bands, indicating a lack of a strong directional bias.
This color-coded visualization allows traders to quickly assess market sentiment based on the Bollinger Bands' extremes.
⭐ 4. Strategic Importance of the Setup:
Multi-timeframe Analysis: Combining short-term (20-period) and long-term (200-period) Bollinger Bands enables traders to assess the market's overall volatility and trend strength. The longer-term bands act as a reference for broader trend direction, while the shorter-term bands can signal shorter-term pullbacks or entry/exit points.
Breakout Identification: By color-coding the candles when prices cross either the upper or lower 200-period bands, the script makes it easier to spot potential breakouts. This can be particularly helpful in trading strategies that rely on volatility expansions or trend-following tactics.
⭐ 5. Customization and Flexibility:
Custom Colors: The script uses distinct fluorescent green and red colors to highlight key bullish and bearish conditions, providing clear visual cues.
Simplicity with Flexibility: Despite its simplicity, the script leaves room for customization, allowing traders to adjust the Bollinger Band multipliers or apply different conditions to candle coloring for more nuanced setups.
This script enhances standard Bollinger Band usage by introducing multi-timeframe analysis, breakout signals, and visual cues for trend strength, making it a powerful tool for both trend-following and mean-reversion strategies.
🚀 Conclusion:
This script effectively simplifies volatility analysis by visually marking bullish, bearish, and neutral zones, making it a robust tool for identifying trade opportunities across multiple timeframes. Its dual-band approach ensures both trend-following and mean-reversion strategies are supported.

Bollinger Bands ForLoopBollinger Bands ForLoop
OVERVIEW
BB ForLoop is an improved version of Bollinger Bands it is designed to calculate an array of values 1 or -1 depending if soruce for calculations is above or below basis.
It takes avereage of values over a range of lengths, providing trend signals smothed based on various moving averages in order to get rid of noise.
It offers flexibility with different signal modes and visual customizations.
TYPE OF SIGNALS
-FAST (MA > MA or MA > 0.99)
-SLOW (MA > 0)
-THRESHOLD CROSSING (when cross above/below treshold set independently for both directions)
-FAST THRESHOLD (when there's change in signal by set margin e.g (0.4 -> 0.2) means bearsih when FT is set to 0.1, when MA is > 0.99 it will signal bullish, when MA < -0.99 it will signal bearish)
Generaly Lime color of line indicates Bullish, Fuchsia indicates Bearish.
This colors are not set in stone so you can change them in settings.
-Bullish Trend, line color is lime
-Bearish Trend, line color is fuchsia
Credit
Idea for this script was from one of indicators created by www.tradingview.com
Warning
Be careful when using this indicator especialy combining DEMA with FT (Fast Treshold).
This indicator can be really noisy depending on the settings, signal mode so it should be used preferably as a part of an strategy not as a stand alone indicator
Remember the lower the timeframe you use the more noise there is.
No single indicator should be used alone when making investment decisions.

Sinc Bollinger BandsKaiser Windowed Sinc Bollinger Bands Indicator
The Kaiser Windowed Sinc Bollinger Bands indicator combines the advanced filtering capabilities of the Kaiser Windowed Sinc Moving Average with the volatility measurement of Bollinger Bands. This indicator represents a sophisticated approach to trend identification and volatility analysis in financial markets.
Core Components
At the heart of this indicator is the Kaiser Windowed Sinc Moving Average, which utilizes the sinc function as an ideal low-pass filter, windowed by the Kaiser function. This combination allows for precise control over the frequency response of the moving average, effectively separating trend from noise in price data.
The sinc function, representing an ideal low-pass filter, provides the foundation for the moving average calculation. By using the sinc function, analysts can independently control two critical parameters: the cutoff frequency and the number of samples used. The cutoff frequency determines which price movements are considered significant (low frequency) and which are treated as noise (high frequency). The number of samples influences the filter's accuracy and steepness, allowing for a more precise approximation of the ideal low-pass filter without altering its fundamental frequency response characteristics.
The Kaiser window is applied to the sinc function to create a practical, finite-length filter while minimizing unwanted oscillations in the frequency domain. The alpha parameter of the Kaiser window allows users to fine-tune the trade-off between the main-lobe width and side-lobe levels in the frequency response.
Bollinger Bands Implementation
Building upon the Kaiser Windowed Sinc Moving Average, this indicator adds Bollinger Bands to provide a measure of price volatility. The bands are calculated by adding and subtracting a multiple of the standard deviation from the moving average.
Advanced Centered Standard Deviation Calculation
A unique feature of this indicator is its specialized standard deviation calculation for the centered mode. This method employs the Kaiser window to create a smooth deviation that serves as an highly effective envelope, even though it's always based on past data.
The centered standard deviation calculation works as follows:
It determines the effective sample size of the Kaiser window.
The window size is then adjusted to reflect the target sample size.
The source data is offset in the calculation to allow for proper centering.
This approach results in a highly accurate and smooth volatility estimation. The centered standard deviation provides a more refined and responsive measure of price volatility compared to traditional methods, particularly useful for historical analysis and backtesting.
Operational Modes
The indicator offers two operational modes:
Non-Centered (Real-time) Mode: Uses half of the windowed sinc function and a traditional standard deviation calculation. This mode is suitable for real-time analysis and current market conditions.
Centered Mode: Utilizes the full windowed sinc function and the specialized Kaiser window-based standard deviation calculation. While this mode introduces a delay, it offers the most accurate trend and volatility identification for historical analysis.
Customizable Parameters
The Kaiser Windowed Sinc Bollinger Bands indicator provides several key parameters for customization:
Cutoff: Controls the filter's cutoff frequency, determining the divide between trends and noise.
Number of Samples: Sets the number of samples used in the FIR filter calculation, affecting the filter's accuracy and computational complexity.
Alpha: Influences the shape of the Kaiser window, allowing for fine-tuning of the filter's frequency response characteristics.
Standard Deviation Length: Determines the period over which volatility is calculated.
Multiplier: Sets the number of standard deviations used for the Bollinger Bands.
Centered Alpha: Specific to the centered mode, this parameter affects the Kaiser window used in the specialized standard deviation calculation.
Visualization Features
To enhance the analytical value of the indicator, several visualization options are included:
Gradient Coloring: Offers a range of color schemes to represent trend direction and strength for the moving average line.
Glow Effect: An optional visual enhancement for improved line visibility.
Background Fill: Highlights the area between the Bollinger Bands, aiding in volatility visualization.
Applications in Technical Analysis
The Kaiser Windowed Sinc Bollinger Bands indicator is particularly useful for:
Precise trend identification with reduced noise influence
Advanced volatility analysis, especially in the centered mode
Identifying potential overbought and oversold conditions
Recognizing periods of price consolidation and potential breakouts
Compared to traditional Bollinger Bands, this indicator offers superior frequency response characteristics in its moving average and a more refined volatility measurement, especially in centered mode. These features allow for a more nuanced analysis of price trends and volatility patterns across various market conditions and timeframes.
Conclusion
The Kaiser Windowed Sinc Bollinger Bands indicator represents a significant advancement in technical analysis tools. By combining the ideal low-pass filter characteristics of the sinc function, the practical benefits of Kaiser windowing, and an innovative approach to volatility measurement, this indicator provides traders and analysts with a sophisticated instrument for examining price trends and market volatility.
Its implementation in Pine Script contributes to the TradingView community by making advanced signal processing and statistical techniques accessible for experimentation and further development in technical analysis. This indicator serves not only as a practical tool for market analysis but also as an educational resource for those interested in the intersection of signal processing, statistics, and financial markets.
Related:

Chieu - Bollinger Bands SMA 50 StrategyOverview
The Custom Bollinger Bands Indicator is a versatile tool designed to help traders identify potential market reversals and optimize their trading strategies. This indicator combines Bollinger Bands with an ATR-based stop-loss mechanism, configurable take-profit levels, and dynamic position sizing to manage risk effectively. By highlighting key market conditions and providing clear visual cues, it enables traders to make informed decisions and execute trades with precision.
Key Features
Bollinger Bands Calculation:
The indicator calculates Bollinger Bands based on a configurable Simple Moving Average (SMA) length.
Standard deviation multiplier is adjustable, allowing traders to fine-tune the width of the bands.
Candlestick Highlighting:
Candles that touch the upper or lower Bollinger Bands are highlighted, indicating potential overbought or oversold conditions.
Reversal candles are identified and highlighted based on specific criteria:
The candle must touch the Bollinger Bands for two consecutive periods.
The reversal candle must have a body at least twice the size of the previous candle's body.
The reversal candle must close in the opposite direction to the previous candle (e.g., a bullish candle following a bearish one).
Stop-Loss and Take-Profit Levels:
Stop-loss levels are calculated using the ATR (Average True Range) indicator, ensuring they are dynamically adjusted based on market volatility.
Two configurable take-profit levels (1R and 2R) are plotted based on the initial risk (distance between entry and stop-loss).
Take-profit and stop-loss lines are visually represented on the chart for easy reference.
Position Sizing and Risk Management:
The indicator includes configurable inputs for account balance, leverage, and risk percentage.
It calculates the nominal value (position size without leverage) and cost value (position size with leverage) based on the specified risk parameters.
Combined labels display SL, TP, nominal value, and cost value, replacing the default "Reversal" text for clear, concise information.
Customization Options:
Users can configure the length of the take-profit lines.
The option to toggle the highlighting of candles touching the Bollinger Bands on or off, while always highlighting the identified reversal candles.
How to Use
Configuration:
Set the desired SMA length and Bollinger Bands multiplier in the input settings.
Configure the ATR length for accurate stop-loss calculations.
Adjust the risk-reward ratio and take-profit line length according to your trading strategy.
Specify your account balance, leverage, and risk percentage for precise position sizing.
Chart Analysis:
Monitor the chart for candles touching the upper or lower Bollinger Bands. These highlights indicate potential overbought or oversold conditions.
Look for highlighted reversal candles, which meet the specified criteria and suggest a potential market reversal.
Use the plotted stop-loss and take-profit lines to manage your trades effectively. The combined labels provide all necessary information (SL, TP, nominal value, and cost value) for quick decision-making.
Execution and Risk Management:
Enter trades based on the reversal candle signals.
Set your stop-loss at the indicated level using the ATR calculation.
Take partial profits at the first take-profit level (1R) and adjust your stop-loss to the entry point to secure the remaining position.
Exit the trade entirely at the second take-profit level (2R) or if the price returns to the adjusted stop-loss level.

Buffett Valuation Indicator [TradeDots]The Buffett Valuation Indicator (also known as the Buffett Index or Buffett Ratio) measures the ratio of the total United States stock market to GDP.
This indicator helps determine whether the valuation changes in US stocks are justified by the GDP level.
For example, the ratio is calculated based on the standard deviations from the historical trend line. If the value exceeds +2 standard deviations, it suggests that the stock market is overvalued relative to GDP, and vice versa.
This "Buffett Valuation Indicator" is an enhanced version of the original indicator. It applies a Bollinger Band over the Valuation/GDP ratio to identify overvaluation and undervaluation across different timeframes, making it efficient for use in smaller timeframes, e.g. daily or even hourly intervals.
HOW DOES IT WORK
The Buffett Valuation Indicator measures the ratio between US stock valuation and US GDP, evaluating whether stock valuations are overvalued or undervalued in GDP terms.
In this version, the total valuation of the US stock market is represented by considering the top 10 market capitalization stocks.
Users can customize this list to include other stocks for a more balanced valuation ratio. Alternatively, users may use S&P 500 ETFs, such as SPY or VOO, as inputs.
The ratio is plotted as a line chart in a separate panel below the main chart. A Bollinger Band with a default 100-period and multiples of 1 and 2 is used to identify overvaluation and undervaluation.
For instance, if the ratio line moves above the +2 standard deviation line, it indicates that stocks are overvalued, signaling a potential selling opportunity.
APPLICATION
When the indicator is applied to a chart, we observe the ratio line's movements relative to the standard deviation lines. The further the line deviates from the standard deviation lines, the more extreme the overvaluation or undervaluation.
We look for buying opportunities when the Buffett Index moves below the first and second standard deviation lines and sell opportunities when it moves above these lines. This indicator is used as a microeconomic confirmation tool, in combination with other indicators, to achieve higher win-rate setups.
RISK DISCLAIMER
Trading entails substantial risk, and most day traders incur losses. All content, tools, scripts, articles, and education provided by TradeDots serve purely informational and educational purposes. Past performances are not definitive predictors of future results.

Comprehensive Market Overview1. What is this indicator about?
The "Comprehensive Market Overview" indicator provides a holistic view of the market by incorporating several key metrics:
Close Price: Displays the current close price below each candle.
Percent from All-Time High: Calculates how far the current close price is from the highest high observed over a specified period.
RSI (Relative Strength Index): Measures the momentum of price movements to assess whether a stock is overbought or oversold.
Volume Gain: Computes the current volume relative to its 20-period simple moving average (SMA), indicating volume strength or weakness.
Volatility: Quantifies market volatility by calculating the ratio of the Bollinger Bands' width (difference between upper and lower bands) to the SMA.
2. How it works?
Close Price Label: This label is displayed below each bar, showing the current close price.
Percent from All-Time High: Calculates the percentage difference between the highest high observed (all-time high) and the current close price.
RSI Calculation: Computes the RSI using a 14-period setting, providing insight into whether a stock is potentially overbought or oversold.
Volume Strength: Computes the current volume divided by its 20-period SMA, indicating whether volume is above or below average.
Volatility Calculation: Calculates the width of the Bollinger Bands (based on a 20-period SMA and 2 standard deviations) and expresses it as a percentage of the SMA, providing a measure of market volatility
3.Correct Trend Identification with Indicators
All-Time High (ATH) Levels:
Low Value (Near ATH): When the percent from ATH is low (close to 0%), it indicates that the current price is near the all-time high zone. This suggests strong bullish momentum and potential resistance levels.
High Value (Below ATH): A high percentage from ATH indicates how much the current price is below the all-time high. This could signal potential support levels or opportunities for price recovery towards previous highs.
RSI (Relative Strength Index):
Overbought (High RSI): RSI values above 70 typically indicate that the asset is overbought, suggesting a potential reversal or correction in price.
Oversold (Low RSI): RSI values below 30 indicate oversold conditions, suggesting a potential rebound or price increase.
Swing Trading Strategies
Confirmation with Visual Analysis: Visualizing the chart to confirm ATH levels and RSI readings can provide strong indications of market sentiment and potential trading opportunities:
Bullish Signals: Look for prices near ATH with RSI confirming strength (not yet overbought), indicating potential continuation or breakout.
Bearish Signals: Prices significantly below ATH with RSI showing weakness (not yet oversold), indicating potential for a bounce or reversal.
Volume Confirmation: Comparing current volume to its SMA helps confirm the strength of price movements. Higher current volume relative to the SMA suggests strong price action.
Volatility Assessment: Monitoring volatility through the Bollinger Bands' width ratio helps assess potential price swings. Narrow bands suggest low volatility, while wide bands indicate higher volatility and potential trading opportunities.
4.Entry and Exit Points:
Entry: Consider entering long positions near support levels when prices are below ATH and RSI is oversold. Conversely, enter short positions near resistance levels when prices are near ATH and RSI is overbought.
Exit: Exit long positions near resistance or ATH levels when prices show signs of resistance or RSI becomes overbought. Exit short positions near support levels or when prices rebound from oversold conditions.
Risk Management: Always incorporate risk management techniques such as setting stop-loss orders based on support and resistance levels identified through ATH and RSI analysis.
Implementation Example

Volume-Adjusted Bollinger BandsThe Volume-Adjusted Bollinger Bands (VABB) indicator is an advanced technical analysis tool that enhances the traditional Bollinger Bands by incorporating volume data. This integration allows the bands to dynamically adjust based on market volume, providing a more nuanced view of price movements and volatility. The key qualities of the VABB indicator include:
1. Dynamic Adjustment with Volume: Traditional Bollinger Bands are based solely on price data and standard deviations. The VABB indicator adjusts the width of the bands based on the volume ratio, making them more responsive to changes in market activity. This means that during periods of high volume, the bands will expand, and during periods of low volume, they will contract. This adjustment helps to reinforce the significance of price movements relative to the central line (VWMA).
2. Volume-Weighted Moving Average (VWMA): Instead of using a simple moving average (SMA) as the central line, the VABB uses the VWMA, which weights prices by volume. This provides a more accurate representation of the average price level, considering the trading volume.
3. Enhanced Signal Reliability: By incorporating volume, the VABB can filter out false signals that might occur in low-volume conditions. This makes the indicator particularly useful for identifying significant price movements that are supported by strong trading activity.
How to Use and Interpret the VABB Indicator
To use the VABB indicator, you need to set it up on your trading platform with the following parameters:
1. BB Length: The number of periods for calculating the Bollinger Bands (default is 20).
2. BB Multiplier: The multiplier for the standard deviation to set the width of the Bollinger Bands (default is 2.0).
3. Volume MA Length: The number of periods for calculating the moving average of the volume (default is 14).
Volume Ratio Smoothing Length: The number of periods for smoothing the volume ratio (default is 5).
Interpretation
1.Trend Identification: The VWMA serves as the central line. When the price is above the VWMA, it indicates an uptrend, and when it is below, it indicates a downtrend. The direction of the VWMA itself can also signal the trend's strength.
2. Volatility and Volume Analysis: The width of the VABB bands reflects both volatility and volume. Wider bands indicate high volatility and/or high volume, suggesting significant price movements. Narrower bands indicate low volatility and/or low volume, suggesting consolidation.
3. Trading Signals:
Breakouts: A price move outside the adjusted upper or lower bands can signal a potential breakout. High volume during such moves reinforces the breakout's validity.
Reversals: When the price touches or crosses the adjusted upper band, it may indicate overbought conditions, while touching or crossing the adjusted lower band may indicate oversold conditions. These conditions can signal potential reversals, especially if confirmed by other indicators or volume patterns.
Volume Confirmation: The volume ratio component helps confirm the strength of price movements. For instance, a breakout accompanied by a high volume ratio is more likely to be sustained than one with a low volume ratio.
Practical Example
Bullish Scenario: If the price crosses above the adjusted upper band with a high volume ratio, it suggests a strong bullish breakout. Traders might consider entering a long position, setting a stop-loss just below the VWMA or the lower band.
Bearish Scenario: Conversely, if the price crosses below the adjusted lower band with a high volume ratio, it suggests a strong bearish breakout. Traders might consider entering a short position, setting a stop-loss just above the VWMA or the upper band.
Conclusion
The Volume-Adjusted Bollinger Bands (VABB) indicator is a powerful tool that enhances traditional Bollinger Bands by incorporating volume data. This dynamic adjustment helps traders better understand market conditions and make more informed trading decisions. By using the VABB indicator, traders can identify significant price movements supported by volume, improving the reliability of their trading signals.
The Volume-Adjusted Bollinger Bands (VABB) indicator is provided for educational and informational purposes only. It is not financial advice and should not be construed as a recommendation to buy, sell, or hold any financial instrument. Trading involves significant risk of loss and is not suitable for all investors. Past performance is not indicative of future results.

Bollinger Bands Fast Trend Indicator [DCD]Description:
The Bollinger Bands Fast Trend Detector indicator is an advanced tool designed to provide traders with more precise trend detection and clearer entry and exit signals. This script builds upon the traditional Bollinger Bands indicator by adding customizable standard deviations and incorporating multiple moving averages to enhance the accuracy of the signals.
Main Features:
1. **Customizable Bollinger Bands**:
- Each Bollinger Band has its own standard deviation setting, allowing for more granular control and better trend detection.
- The short Bollinger Band is set to a 10-period SMA for faster trend recognition.
2. **Multiple Moving Averages**:
- The indicator includes several types of moving averages (SMA, EMA, LSMA, HMA, WMA) applied to the Bollinger Trend value, giving traders flexibility to choose the best fit for their strategy.
3. **Crossover and Crossdown Detection**:
- The script identifies crossover and crossdown points between the Bollinger Trend value and the selected moving average, marking potential buy and sell signals with green and red circles, respectively.
4. **Color-Coded Histogram**:
- The histogram bars are color-coded to indicate the strength and direction of the trend, making it easy to visualize market conditions at a glance.
Instructions:
1. **Adding the Script to Your Chart**:
- Open your TradingView chart and add the Bollinger Bands Fast Trend Detector indicator.
2. **Adjusting Parameters**:
- Customize the Bollinger Bands and moving average settings according to your trading preferences:
- `Short BB Length` (default: 10): Adjusts the length of the short Bollinger Band.
- `Long BB Length` (default: 50): Adjusts the length of the long Bollinger Band.
- `StdDev` (for both bands): Sets the standard deviation multiplier.
- `Moving Average Type`: Choose between SMA, EMA, LSMA, HMA, and WMA.
- `Moving Average Length` (default: 14): Sets the length of the moving average.
3. **Interpreting the Output**:
- Observe the BBTrend and moving average plots on your chart.
- Look for green circles indicating crossover points (potential buy signals) and red circles indicating crossdown points (potential sell signals).
- Use the color-coded histogram bars to assess the strength and direction of the trend.
Configurable Parameters:
- `shortLengthInput` (default: 10): Length of the short Bollinger Band.
- `longLengthInput` (default: 50): Length of the long Bollinger Band.
- `shortDevMultInput` (default: 1.0): Standard deviation multiplier for the short Bollinger Band.
- `longDevMultInput` (default: 2.0): Standard deviation multiplier for the long Bollinger Band.
- `maTypeInput` (default: SMA): Type of moving average (options: SMA, EMA, LSMA, HMA, WMA).
- `maLengthInput` (default: 14): Length of the moving average.
Code Explanation:
The script calculates two sets of Bollinger Bands with distinct lengths and standard deviations. The difference between the lower bands and upper bands is normalized by the short middle band to compute the BBTrend value. A selected moving average is then applied to this BBTrend value. The script plots the BBTrend, the moving average, and uses color-coded histogram bars to represent trend strength and direction. It also identifies and marks crossover and crossdown points to provide potential trading signals.
Disclaimer:
This script is for educational purposes only and should not be considered financial advice. Always perform your own analysis before making any trading decisions.

Dynamic Bollinger Bands with Momentum and Volume (DBBMV)Overview
The Dynamic Bollinger Bands with Momentum and Volume (DBBMV) indicator enhances the traditional Bollinger Bands by dynamically adjusting their width and position based on momentum and volume. This provides a more responsive and context-aware indication of price volatility and potential reversals.
Key Features
Momentum Adjusted Bands: Adjusts the bands' width based on the momentum indicator, reflecting the rate of change in price.
Volume Weighted Bands: Further adjusts the bands based on trading volume to reflect market activity and price volatility.
Signal Alerts: Provides buy and sell signals based on price action relative to the dynamic bands, helping traders identify entry and exit points.
Customizable Parameters: Allows users to adjust the lookback period, momentum sensitivity, and volume weighting for personalized analysis.
How It Works
The DBBMV indicator starts with the traditional Bollinger Bands, which are calculated using a moving average and standard deviation of the selected price source. The width of these bands is then adjusted based on the momentum of the price, making them more sensitive to price changes. Further adjustments are made based on trading volume, which ensures that the bands accurately reflect current market conditions. This results in a set of dynamic Bollinger Bands that provide more nuanced insights into price volatility and potential reversals.
Usage Instructions
Identify Volatile Periods: Use the dynamically adjusted bands to identify periods of high and low volatility in the market.
Spot Reversals: Look for buy signals when the price crosses above the lower band and sell signals when the price crosses below the upper band.
Adjust Sensitivity: Customize the lookback period, momentum sensitivity, and volume weighting to fine-tune the indicator to your specific trading strategy and market conditions.
Enhance Analysis: Combine the DBBMV indicator with other technical analysis tools for a more comprehensive market analysis.
Volume Confirmation: Use the volume-weighted adjustments to confirm the strength of price movements and potential breakouts.
The Dynamic Bollinger Bands with Momentum and Volume (DBBMV) indicator provides traders with a powerful tool to understand market dynamics better and make informed trading decisions based on adjusted volatility and market activity.
MACD BB v2.00 Indicator CryptoPotato748The MACD BB v2.00 CryptoPotato748 is a custom technical analysis indicator for TradingView that combines the Moving Average Convergence Divergence (MACD) with Bollinger Bands to provide a powerful tool for identifying trend strength and potential trading signals. This indicator is designed to automatically adapt its parameters based on the selected time frame, making it versatile and suitable for various trading strategies and time horizons.
Features
MACD Calculation:
The MACD line is calculated using the difference between the 12-period and 26-period Exponential Moving Averages (EMAs).
The Signal line is the 9-period EMA of the MACD line.
These parameters automatically adjust based on the selected time frame to optimize performance.
Bollinger Bands:
Bollinger Bands are calculated based on the MACD line to identify overbought and oversold conditions.
The bands consist of a 20-period Simple Moving Average (SMA) of the MACD line, with upper and lower bands set 2 standard deviations away.
These parameters also adjust based on the selected time frame for better alignment with market conditions.
Adaptive Time Frames:
The indicator automatically adjusts its MACD and Bollinger Bands parameters based on the selected chart time frame, including 1 minute, 3 minutes, 5 minutes, 15 minutes, 30 minutes, 1 hour, 2 hours, 4 hours, 12 hours, 1 day, 3 days, 1 week, and 1 month.
This ensures the indicator remains effective across various time frames without manual reconfiguration.
Visual Elements:
The upper and lower Bollinger Bands are plotted in gray, with a blue fill between them for easy visualization.
The MACD line is plotted with circle markers, colored lime when above the upper band and red when below the lower band.
A zero line is plotted in orange for reference.
Bar colors change to yellow when the MACD line is above the upper band (indicating a potential buy signal) and aqua when below the lower band (indicating a potential sell signal).
How to Use
Adding to Chart:
Copy and paste the script into the Pine Editor on TradingView.
Click "Add to Chart" to see the indicator in action.
Interpreting Signals:
MACD Above Upper Band (Lime): Indicates strong bullish momentum, potential buy signal.
MACD Below Lower Band (Red): Indicates strong bearish momentum, potential sell signal.
Yellow Bars: Suggest a potential buy condition.
Aqua Bars: Suggest a potential sell condition.
Adaptive Parameters:
The indicator automatically adjusts its parameters based on the selected time frame, ensuring optimal performance across different trading environments.

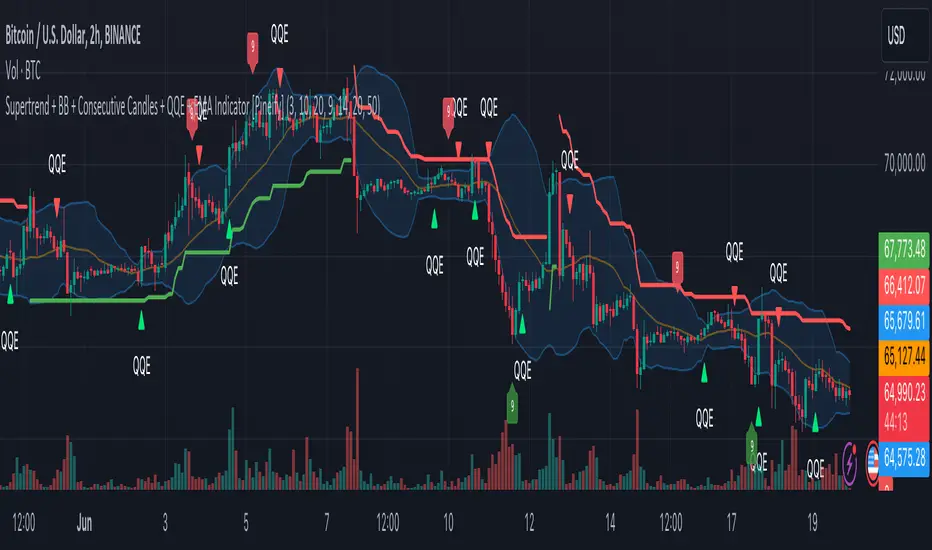
Supertrend + BB + Consecutive Candles + QQE + EMA [Pineify]Overview
This indicator, developed by Pineify, is a comprehensive tool designed to assist traders in making informed decisions by combining multiple technical analysis methods. It integrates Supertrend, Bollinger Bands (BB), Consecutive Candles, Quantitative Qualitative Estimation (QQE), and Exponential Moving Averages (EMA) into a single, cohesive script. This multi-faceted approach allows traders to analyze market trends, volatility, and potential buy/sell signals with greater accuracy.
Key Features
1. Supertrend: Utilizes the Supertrend indicator to identify the prevailing market trend. It provides clear buy and sell signals based on the direction of the trend.
2. Bollinger Bands (BB): Measures market volatility and identifies overbought or oversold conditions. The script calculates the middle, upper, and lower bands, along with the Bollinger Band Width (BBW) and Bollinger Band %B (BBR).
3. Consecutive Candles: Detects sequences of consecutive bullish or bearish candles, providing signals when a specified number of consecutive candles are detected.
4. Quantitative Qualitative Estimation (QQE): Combines the Relative Strength Index (RSI) with a smoothing factor to generate buy and sell signals based on the QQE methodology.
5. Exponential Moving Averages (EMA): Includes both fast and slow EMAs to identify potential crossovers, which are used as buy and sell signals.
How It Works
- Supertrend: The Supertrend indicator is calculated using a factor and ATR length. It plots the trend direction and generates buy/sell signals when the trend changes.
- Bollinger Bands: The BB indicator calculates the middle band as a Simple Moving Average (SMA) of the closing prices. The upper and lower bands are derived by adding and subtracting a multiple of the standard deviation from the middle band.
- Consecutive Candles: This feature counts the number of consecutive candles that close higher or lower than the previous candle. When the count reaches a specified threshold, it generates a buy or sell signal.
- QQE: The QQE indicator smooths the RSI values and calculates the QQE Fast and QQE Slow lines. Buy and sell signals are generated based on the crossover of these lines.
- EMA: The script calculates fast and slow EMAs and generates buy/sell signals based on their crossovers.
How to Use
1. Inputs: Customize the indicator settings through the input parameters:
- Supertrend Factor and ATR Length
- BB Length
- Consecutive Candles Counting
- QQE RSI Length
- Fast and Slow EMA Lengths
- Enable/Disable Alerts for various signals
2. Alerts: Set up alerts for Supertrend, Consecutive Candles, and EMA crossovers. Alerts can be enabled or disabled based on user preference.
3. Visualization: The indicator plots the Supertrend, Bollinger Bands, and EMA lines on the chart. It also marks buy and sell signals with arrows and labels for easy identification.
Concepts Underlying Calculations
- Supertrend: Based on the Average True Range (ATR) to determine the trend direction and potential reversal points.
- Bollinger Bands: Utilizes standard deviation to measure market volatility and identify overbought/oversold conditions.
- Consecutive Candles: A method to detect momentum by counting consecutive bullish or bearish candles.
- QQE: Enhances the traditional RSI by smoothing it and using a dynamic threshold to generate signals.
- EMA: A widely used moving average that gives more weight to recent prices, making it responsive to market changes.
This indicator is a powerful tool for traders looking to combine multiple technical analysis methods into a single, easy-to-use script. By integrating these diverse techniques, it provides a comprehensive view of market conditions and potential trading opportunities.
Enhanced Reversal DetectionScript Description:
The "Enhanced Reversal Detection" indicator is a powerful tool designed to identify potential market reversals across various financial instruments. It incorporates a sophisticated algorithm that analyzes price action along with key technical indicators such as the Relative Strength Index (RSI), Bollinger Bands, and Moving Average (MA).
How to Use:
Adjustable Parameters: The indicator offers a range of adjustable parameters to cater to different trading preferences and market conditions.
RSI Length: Adjusts the length of the RSI calculation to fine-tune sensitivity.
Overbought Level: Sets the threshold for identifying overbought conditions on the RSI scale.
Oversold Level: Sets the threshold for identifying oversold conditions on the RSI scale.
Bollinger Bands Length: Determines the length of the Bollinger Bands calculation.
Bollinger Bands Multiplier: Adjusts the standard deviation multiplier for the Bollinger Bands, influencing band width.
Moving Average Length: Defines the length of the Moving Average calculation to capture trend direction.
Min Bars Between Signals: Sets the minimum number of bars required between consecutive reversal signals.
ADX Length: Adjusts the length of the Average Directional Index (ADX) calculation.
ADX Threshold: Defines the threshold value for ADX, serving as a filter for reversal signals.
Signal Generation: The indicator generates signals for both bullish and bearish reversals based on predefined criteria. A bullish reversal signal is triggered when the closing price exceeds the lower Bollinger Band and RSI falls below the oversold threshold. Conversely, a bearish reversal signal occurs when the closing price falls below the upper Bollinger Band and RSI surpasses the overbought threshold.
Alerts: Traders can opt to receive alerts for bullish and bearish reversal signals, enabling them to stay informed of potential trading opportunities even when away from the platform.
Publication Readiness:
To ensure readiness for publication in the TradingView public library, the script has been meticulously crafted and documented:
The code is extensively commented to provide clear explanations of parameters, calculations, and signal generation logic.
Best coding practices have been followed to enhance readability and maintainability.
Rigorous testing has been conducted to validate the accuracy and reliability of signal generation across various market conditions.
The script adheres to TradingView's guidelines and policies for script publication, ensuring compliance with platform standards and user expectations.
With its comprehensive features and user-friendly design, the "Enhanced Reversal Detection" indicator is poised to become a valuable asset for traders seeking to identify high-probability reversal opportunities in the financial markets.
