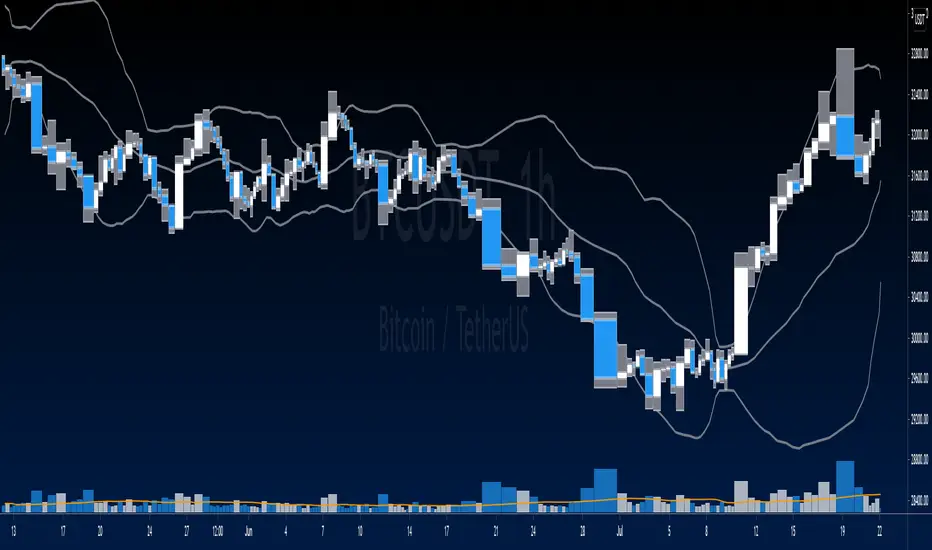
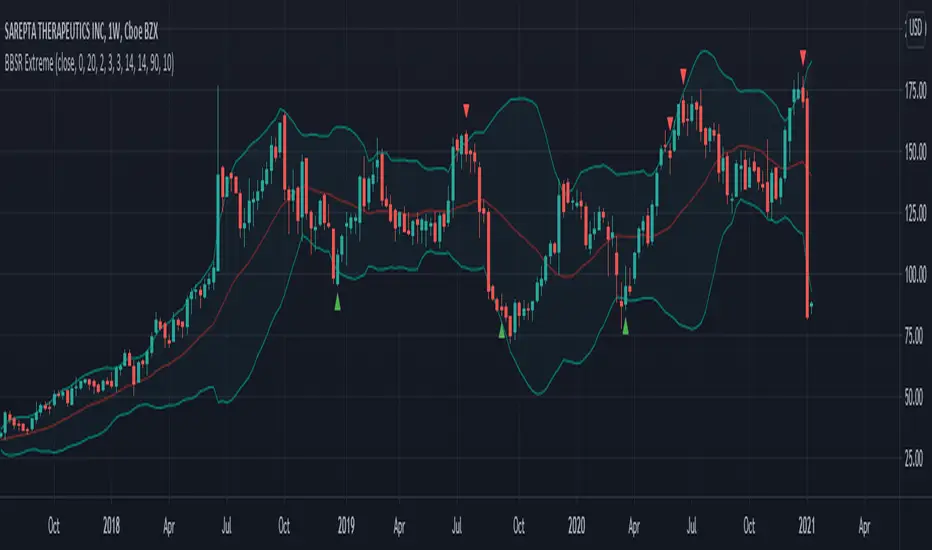
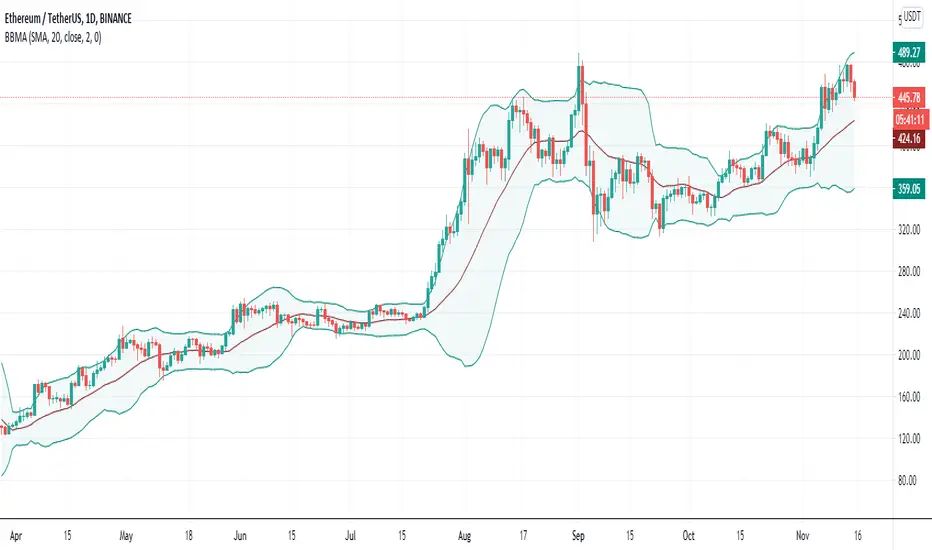
This strategy combines VWAP and BB indicators BUY RULE 1. EMA50 > EMA 200 2. if current close > vwap session value 3. check if price dipped BB lower band for any of last 10 candles EXIT RULE 1. price closes above BB upper band STOP LOSS EXIT 1. As configured --- default is set to 5% warning: for the use of educational purposes only
3 indicators in 1. Included Indicators are: - EMA 8,13,21,55,100,200,450 - Ichimoku - Bollinger Band These can be used to determine changes in trends when: - EMA's collide, trajectories shift, or certain levels are reached. - Ichimoku cloud is above or below the candles. - Bollinger Band's width changes, or range is broken. Reasons for 3 in 1 assembly: This...
I wanted to share this strategy that I use myself for binary options trading. After trading binary options for several years I have learned that every single day is unique... assets behave differently every single day. So, when I start the day I want to know which is the optimum combination of parameters in my indicators that will give me the signals I want...
Set the color for each bands and indicate the Bollinger bands. In order to indicate with simple moving average line,hide the bollonger bands line and set the color for bands. ボリンジャーバンドの帯域ごとに色を設定して表示します。 単純移動平均線と同時表示しても見やすいように、ボリンジャーバンドの線を非表示にして、帯域に色を設定して表示することができます。
Indicator idea based on classic Bollinger bands and Telson T8 moving average. The indicator detects Bollinger bands narrowing which should predict a move to a direction. NOTE: You need to define in the indicator settings (Narrow percentage) the percentage between the upper and lower bands that would be highlighted. For example: if you set 5%, the indicator...
Bollinger bands says whether price or any source is relatively high or low at any particular point of time. We can apply Bollinger bands on RSI and volume indicator Price Volume Trend to identify if RSI movement or PVT movement is relatively high or low. By calculating Bollinger %B, we can define the variation in a range between 0 to 1. By applying Bollinger %B...
This script plots multiple EMA's also it shows you when a particular EMA crosses up or below another EMA. You can customize the EMA's based on your setups or preferences. This script basically will help you easily identify when a particular EMA has crossed over or crossed under another EMA at one glance. Particularly useful when there is a lot of entanglement...
This is an indicator that flags the lowest Bollinger Bands Width value for a set number of bars back. This is based on my BBVV script seen here Each dot on the BBVV indicator marks the rolling "X"-period low in BBVV value. You can set "X" as any number of bars back in the settings of this indicator. This can be used to accurately predict when periods of...
Buy when the candle closes above upper BB Sell when the candle closes bellow lower BB Stop always on base line
Exponential Volume Weighted Average Price and Deviations. Selectable intervals (daily/weekly/monthly/yearly vwap). Options to change deviation multipliers and display interval closing values for the previous interval. Uses volume weighted EMA for the interval as the basis/vwap & exponential deviations calculated using the exponential vwap as the mean.
Simple strategy, Using Volume weighted Bollinger Bands > Directions for Usage: 1. Use only in scripts where volume is specified by tradingview 2. Check on which timeframe the script has a profit factor greater than 1.4 3. Use that timeframe for profitability 4. In some high liquid securities there is a decent profit factor even at 5 min scale (optimise at...
* Bollinger Bands Wide & Narrow apply a Simple Moving Average (SMA) on Bollinger Bands Width with same period of middle bands to regconize the bands are widening or narrowing. * "Bands Widening" is marked by green shade. * "Bands Narrowing" is marked by red shade.
This is Bollinger bandwidth indicator: Bandwidth = high-low/main I have added lowest and highest of N periods to programmatically identify bulge and squeeze. When bandwidth at N periods low, it is in squeeze. If bandwidth at N periods high, it is in bulge.
Uses a set of Bollinger Bands (user defined deviation, user defined deviation * 2) to determine possible entry set ups. Signals are triggered when price crosses the first band (closest to the baseline MA) in the desired direction. baseline can be your take profit 1 target The inside band determines entry and can be used as a take profit 2 target (Opposite side...
A slighty modified version of Better Bollinger Bands. The idea of the experiment was to do a thing like the well-known Vortex Indicator, but an overlay: Obvious trading rules are: go Long when the blue line is above other two go Short when the orange line is above other two stop when price crosses the basis line The tool is EXPERIMENTAL . Good luck!
Bollinger band with 1 and 2 standard deviation Default with 21 SMA Also count number of candlesticks of previous trend when crossing 1 standard deviation
This script is similar to the previous one "Bollinger Bands Money Flow Index" but it's a little easier to interpret. Fix the top line of the "BBMFI" to 1, and the bottom line to 0. Indicates where "Money Flow Index" is located between the top and bottom lines. If it's bigger than 1, it's overbuying. If it's less than 0, it's overselling. Consider a trade if you...
This script embodies the application of the Bollinger Band and Money Flow Index in John A. Bollinger's book "Bollinger on Bollinger Bands." "Bollinger on Bollinger Bands" suggests a relatively method of analysis by applying the Bollinger Band to an indicator. Here's one of the indicators, Money Flow Index. Money Flow Index is an indicator of overbuying and...