[kai]Keltner&BolingerIt is an indicator that simultaneously displays the Bollinger Bands (BB) and Keltner Channel (KC) calculated for the log scale.
* If you need the normal scale version, please turn off the log mode in the settings.
I think the usage is the same as normal BB and KC.
From here, it ’s an original way of thinking.
I thought about countermeasures for the phenomenon that the BB contracts (squeezes) and breaks, but for some reason it suddenly reverses and breaks greatly in the opposite direction or ends in misfire.
The main part of this Inge is KC, and I think that the range within KC is the range.
Considering that the bar broke above and below the range of KC and broke, the trend market started.
BB fits in KC and judges that the trend is game over
If it is within KC, it is contrarian at the upper and lower limits of KC.
If it breaks, Trend following
Profit if BB fits in KC
I'm thinking about how to use it
ログスケール用にログ計算したボリンジャーバンド(BB)とケルトナーチャンネル(KC)を同時に表示するインジケーターです
※通常スケール版が必要な時は設定のlog modeをOFFにしてください
使い方は普通のBBとKCとおなじで使用方法で良いと思います
ここからはオリジナルな使い方の考え方です
BBが収縮(スクイーズ)してブレイクしたのに何故か突然反転して反対の方に大きくブレイクしたり、不発に終わったりする現象の対策を考えました
このインジのメインはKCでKCの範囲内はレンジと考えます
KCの範囲外にバーが上抜け、下抜けして、ブレイクしたと考え、トレンド相場スタートとします
BBがKCの中に納まってトレンド終了と判定します
KC内の場合はKCの上限、下限で逆張り
ブレイクした場合は順張り
BBがKCの中に納まったら利確
という感じの使い方を考えています
BB

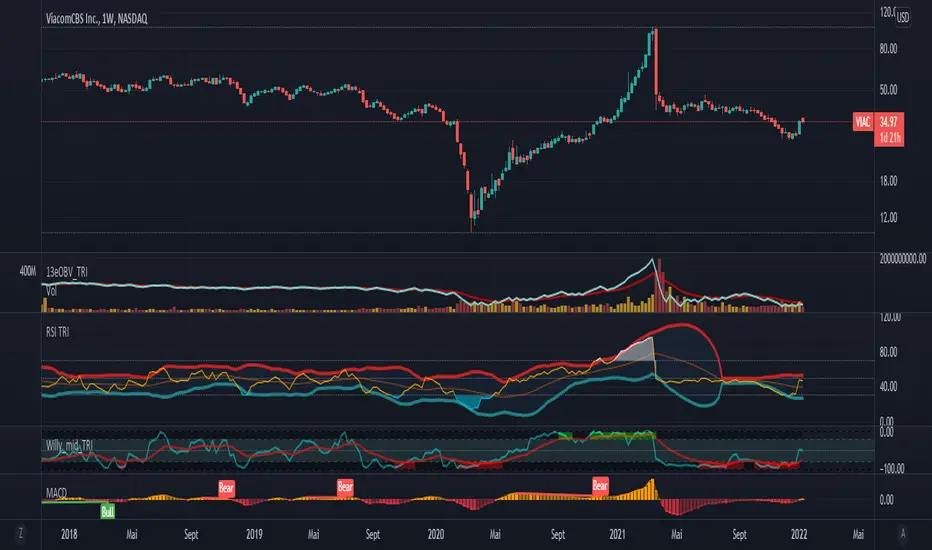
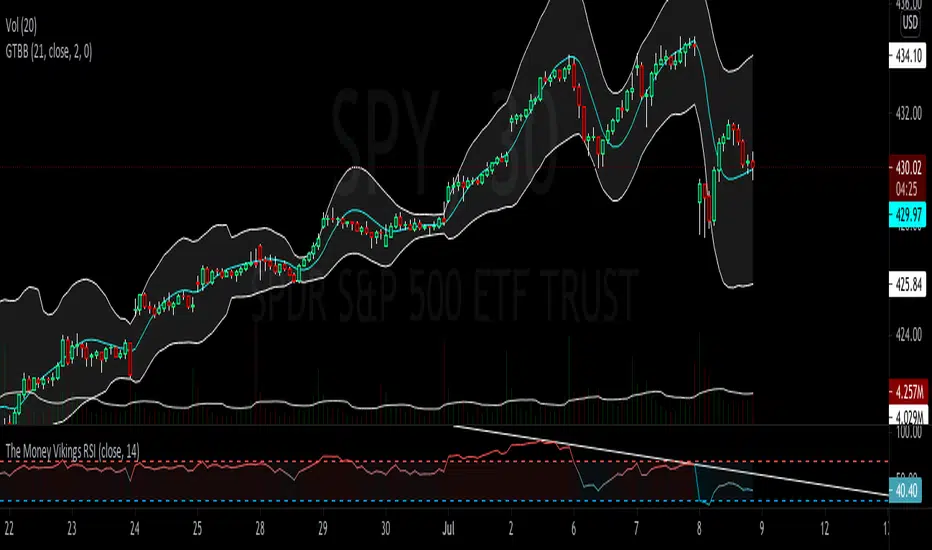
RSI Divergences + Bollinger Bands█ OVERVIEW
Here's the RSI divergences with Bollingers bands.
█ CONCEPTS
5 features
1 — RSI
2 — Bollinger bands
3 — RSI signal is in another color when above 70 or below 30
4 — Looking for previous Divergences, Bullish, Bearish and Hidden Bullish and Bearish but I don't like Hidden divergences
5 — Color fill when overbuy or oversold
█ OTHER SECTIONS
I like to see it like a moutain, with snow on top and lake on bottom. I think you don't want to start walking at the top, nor sink to the bottom of the lake for ever and ever.
It is an idea of sjoerd , tip him if you like it.
An oscillator is good to know where we are in the trends, but it's not enough to run a small business of trading, you need to learn how to use it.
What is a divergence ?
Thanks to The rational investor for teaching me how to use this indicator.
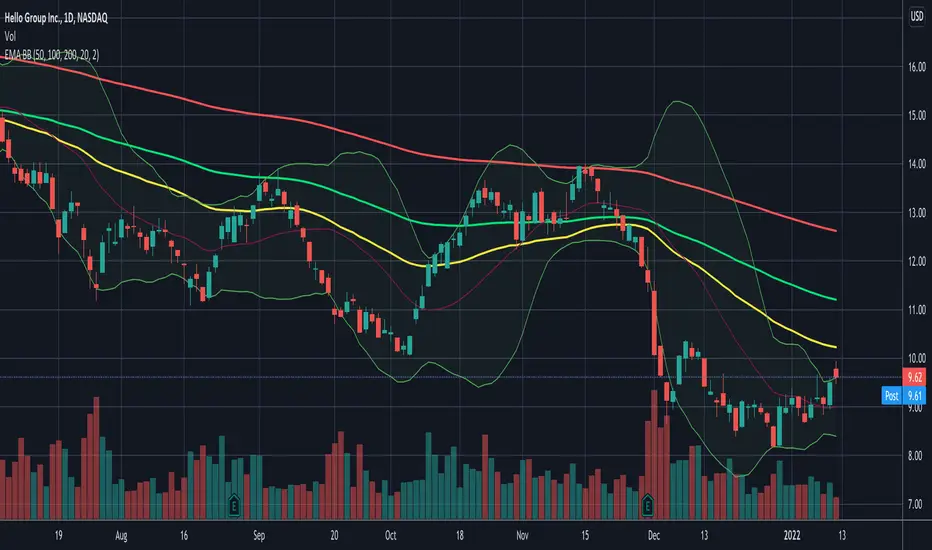
Daily EMA50 100 200 + BBStandard Bollinger Bands (timeframe dependent), period and standard deviation are configurable.
And standard daily triple EMA (timeframe independent). Short, Medium and Long periods are configurable (50/100/200 by default)
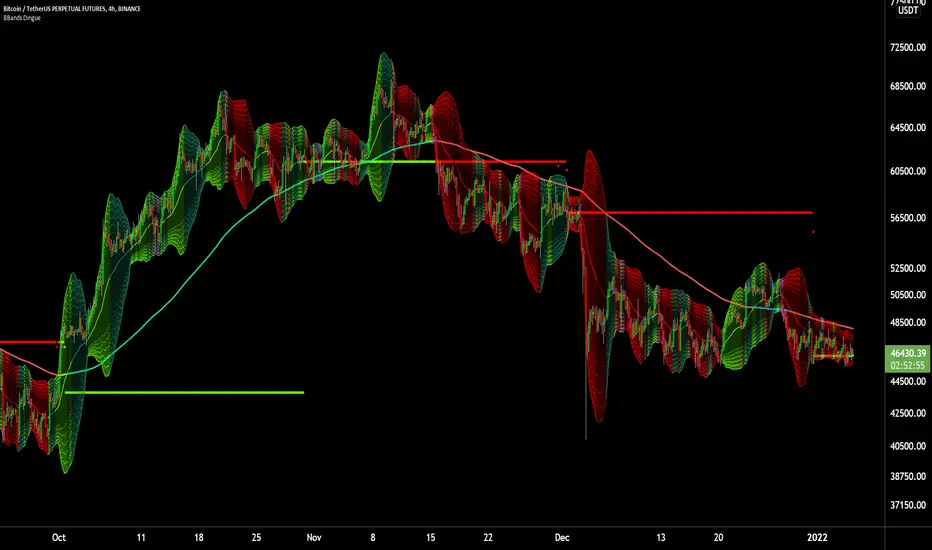
6X Bollinger Bands + MA + VWAP Dingue V56X Bollinger Bands Dingue V5 - This is the updated version for Pine Script 5
This indicator lets you quickly see all the intricacies of the Bollinger Bands; it simplifies its usage and maximizes the results.
Color-coded if the price is above or under the middle and based on direction.
Color-coded for expansion and contraction of the bands.
Option to plot ‘Squeezed bands’. It will show above the bands when they become smaller than the setting chosen. This helps identify build-up that might explode one way or another.
- 6x independent Bands can be adjusted as you want. It gives you possibilities in how you see variance, trends, support and resistance.
You can also select the MA type: SMA EMA WMA VWAM FRAMA … to explore new ways to see the Bollinger bands.
New in this version, you can now add a separate ‘Long MA’ that you can select independently from the Bands. Ex. Plot 200 SMA This helps in building a strategy with the trend and the bands.
Like the MA above, you can also plot 2 different VWAP independently from the Bands. This also helps knowing where the price stands compared to the bigger time frame VWAP’s price.
'Tool tips' explain other settings, if you have any questions, feel free to ask in the comments below.
Thank you for the feedback and check all my ‘Dingue’ indicators.
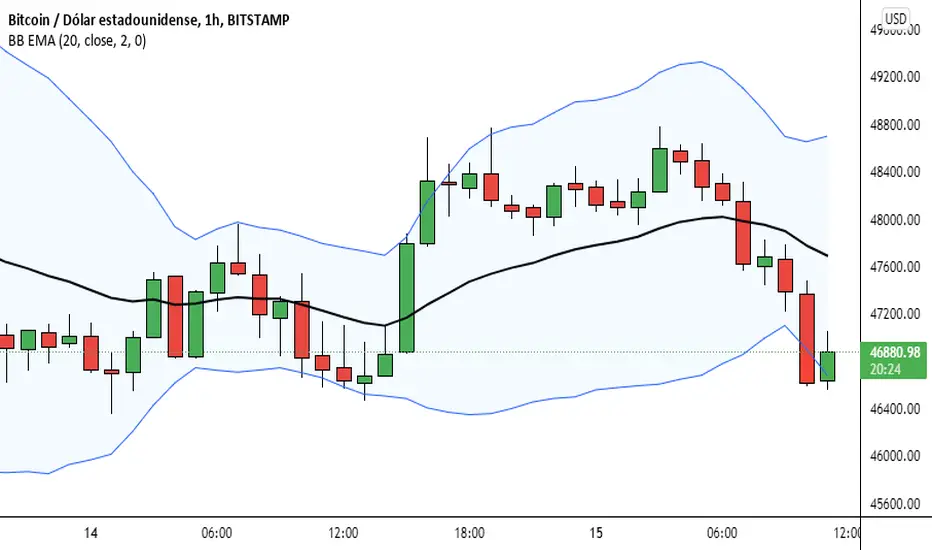
Bandas de Bollinger basado en una EMAEsta modificación de las Bandas de Bollinger esta basado en una promedio exponencial
Bollinger Band Gradient (BBG)The Bollinger Band Gradient Indicator uses plenty of Bollinger Bands to create a gradient-looking indicator to help with layered entries . It is similar to a Ribbon but better. This indicator is best used with any volume-related indicator so you can recede from entering into any position with too much momentum to rebound off of any line. Note that this indicator is best used with another strategy like pair trading. It is not recommended to trade based on this indicator only . Please stay aware of any news about the stock you are trading because some events may have a big impact and force the market to go bullish/bearish by a lot. This indicator can be used with all chart types and works well with many other indicators. It allows for complete customization and offers easy-to-understand settings which can be designated to a certain individual. You can modify all settings for the BBs which allows for an even more personalized and adapted Indicator that reflects your trading/ investing needs. You also have the option to choose which type of MAs will be used to create the Bollinger Bands , a few of which include: SMA, EMA, WMA, HMA, RMA, DMA, LSMA, VAMA, TMA, MF.
Bollinger Bands are a way to measure and visualize volatility . As volatility increases, the wider the bands become, and the more they deviate from the basis. Likewise, when volatility decreases, the gap between the bands and basis decreases. Yet a big advantage for not only this but many other indicators is created due to the ample count of different settings that are widely used, it is difficult to view the market through the eyes of all types of investors/traders . This indicator manages to counter exactly this issue, you will be able to see all of these settings on one chart and at one time and enter/exit positions accordingly.
Using this indicator will allow you to visualize entry and exit points with ease and make order layering (buying/selling in layers) much more simple. You can choose a certain amount of Bollinger Bands you would like displayed and customize all technical and style-related settings related to the BBs .
A few of the technical settings you can change for the Bollinger Bands are:
Bollinger Band count (Select how many BBs you want to be displayed.)
MA type used to make the Bollinger Bands ( EMA, SMA, WMA, etc.)
Source (close, open, high, low.)
BB length separately (The length of each Bollinger Band, its lookback. How many previous candles should it be based on? Choose each Bollinger Band's lookback length.)
BB deviator separately(The standard Deviator applied for the BB for both the upper and lower line.)
A few of the style settings you can change for each Bollinger Band are:
Fill (the color used to fill from the upper to the lower band)
Fill opacity % (the opacity used when filling the upper line to the lower line)
This indicator is unique because it can be used for all strategies and all trading styles , for example, day trading or long-term investing, really anything if used correctly. The reason it can be used in so many instances is a result of the detailed and in-depth settings tab that allows for complete customization. This allows the indicator to be used and to be useful in various situations and allows you to dominate the market. Integrated alerts also enhance your efficiency while using this indicator because you can choose to be notified at the crossing of any of the Bollinger Bands.
The technical part of this indicator plots the selected amount of Bollinger Bands using custom-built specified Bollinger Bands accordingly. Then it uses the style settings and styles it as you selected.
Bollinger Bands Fibonacci Ratios StrategyHello, everyone!
We have just released an innovative strategy for TradingView. It allows you to identify price pivot points and volatility.
This strategy is:
User-friendly
Configurable
Equipped with Bollinger Bands and smoothed ATR to measure volatility
Features
Thanks to the BB Fibo strategy, you can:
Trade stocks and commodities.
Identify price pivot points.
Choose any band for trading Long or Short positions.
Swap upper and lower bands applying Use Reverse Buy/Sell parameters.
Note! The upper bands are for the Long position. The lower bands are for the Short positions.
Parameters
We have equipped our strategy with more than 14 additional parameters. So, you can configure the EA according to your needs!
Inputs:
Length
Source: Open, High, Low, Close, HL2, HLC3, OHLC4
Offset
Fibonacci Ratio 1 — a Fibonacci factor for the 1st upper and lower indicator lines calculating.
Fibonacci Ratio 2 — a Fibonacci factor for the 2nd upper and lower indicator lines calculating.
Fibonacci Ratio 3 — a Fibonacci factor for the 3d upper and lower indicator lines calculating.
Use Reverse Buy — the strategy will use lower Bollinger bands instead of upper ones.
Fibonacci Buy — band selection for opening Long positions conditions.
Use Reverse Sell — the strategy will use upper Bollinger bands instead of lower ones.
Fibonacci Sell — band selection for opening Short positions conditions.
Style:
Basis — baseline color and style settings.
Upper 3 — the 3d upper line color and style.
Upper 2 — the 2nd upper line color and style.
Upper 1 — the 1st upper line color and style.
Lower 1 — the 1st lower line color and style.
Lower 2 — the 2nd lower line color and style.
Lower 3 — the 3d upper line color and style.
Background — the background color within the 3d upper and 3d lower indicator band.
Precision — the number of decimals for BB Fibo values.
Note! Try BB Fibo on your demo account first before going live.

IDEAL BB with MA (With Alerts)It gives well combination of Moving average and Bollinger bands with signals

Bollinger Bands with Customizable Expansion DetectorJapanese below / 日本語説明は下記
Bollinger bands with customizable expansion signals
What’s new in this indicator?
This indicator allows users to customize Bollinger bands expansion signal with the conditions below.
1. Target bands
Which bands should be considered as expansion when price crossing?
Available options are plus/minus 1-3 σ.
2. Price
Which price should be considered as bands breakout
Available options are high, low and close
3. Band width increment(volatility)
When band width is N times wider than previous bar. N = ?
This parameter is regarded as volatility expansion, measuring how much band width gets wider than previous bar.
Band width is distance between each band and middle line(SMA).
Expansion signals are displayed when 1, 2 and 3 are all met.
For example, if you select parameters as follows, expansion signals are appeared when;
Bullish expansion:
When prices(highs) cross over plus 2 σ band with band width of the current candle is 1.15 times wider than previous bar.
Bearish expansion:
When prices(lows) cross under minus 2 σ band with band width of the current candle is 1.15 times wider than previous bar.
Selected parameters(Example)
1. 2σ
2. High/low
3. 1.15
Alert can be set when conditions above are met.
You can customize them to be best fit for you!
————————————————————
エクスパンションの発生条件をユーザが独自にカスタマイズし、シグナル表示できるボリンジャーバンドです。
以下の3つの要素を組み合わせることでユーザ独自のエクスパンションシグナルをカスタマイズすることができます。
1. 対象バンド
どのバンドをブレイクした時にエクスパンションの条件の一つとするかを選択
選択可能オプションはプラスマイナス1-3シグマ
2. 価格
どの価格でバンドをブレイクした時にエクスパンションとみなすかを選択
上方ブレイクは高値·終値から、下方ブレイクは安値·終値から選択可能
3. バンドの広がり(ボラティリティ)
現在ローソク足のバンド幅が一つ前のローソク足のバンド幅のN倍の時、エクスパンションとみなすための数値
Nは0.1-10の間で設定可能
バンド幅は各バンドとミドルライン(SMA)の距離です。
エクスパンションのシグナルは上記1-3全てを満たした時に表示されます。
例: 以下のようにパラメーター設定した場合、エクスパンションシグナルは下記の時に表示されます。
選択パラメーター(例)
1. 2σ
2. High/low
3. 1.15
上方エクスパンション:
高値がプラス2シグマバンドを上に抜き、かつ現在ローソク足のバンド幅が一つ前のローソク足のバンド幅の1.15倍を超える場合
下方エクスパンション:
安値がマイナス2シグマバンドを下に抜き、かつ現在ローソク足のバンド幅が一つ前のローソク足のバンド幅の1.15倍を超える場合
上記条件が揃った場合のアラート設定も可能です。

Ultimate Moving Average Bands [CC+RedK] Mod [DM]Greetings colleagues
I share here the bands created by CC and RedK
I've added the second band with his multiplier.
Also, to the same band an amplifier was coded so that it has its individual sample length.
Some visual aspects were changed such as the color of the bands and the moving average, as well as its thickness to be softer visually.
The work is not finished I gave it a spin at the expense of raining some idea. 😉
Original Authors and References:
CheatCountry
RedKTrader
www.tradingview.com

Bollinger Bands + RSI Strategy by CMNisalCan be Used on Any timeframe.
Based on Bollinger Bands and RSI ( Relative Strength Index )
Used for Testing below Trade Setups on 3Commas.
Bollinger Bands
BB-20-2-LB
BB-20-1-LB
Relative Strength Index
RSI-7 <70
RSI-7 <30
Added Short Entry Switch
Added RSI Skipping Option
Price Should cross the Band and Close the candle Above/Below the band

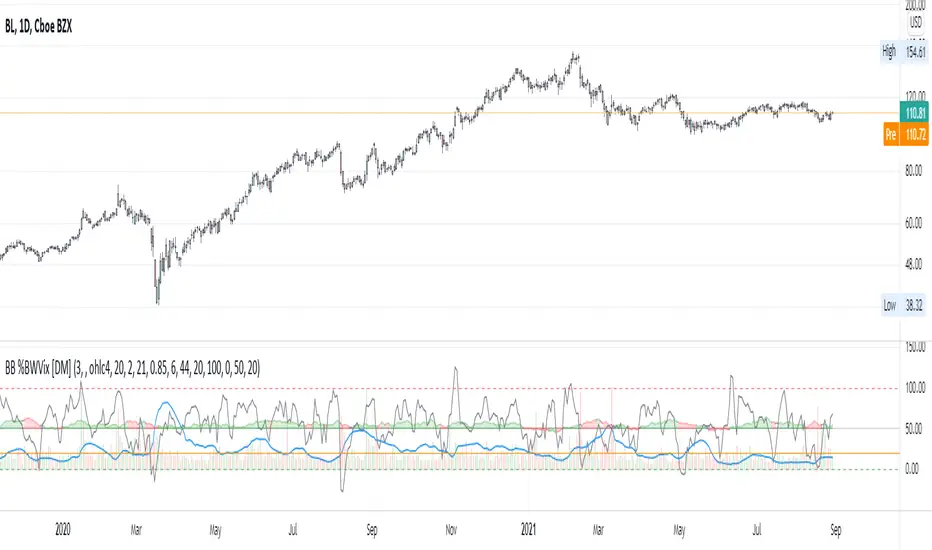
Bollinger Bands Width + %B + Vol. + Intraday Idx Alma var [DM]Greetings Colleagues here I published another script of the series "Alma Variant"
This script incorporates four different standard signals from Bollinger Band Book.
Signals:
Bollinger Band Width. Line blue
Bollinger Band %B. Line gray
Intraday intensity Index “normalized using log(volume)”. Oscillator line in the middle of the indicator with decision color green = buy, red=sell, purple=na
Bollinger Band Volume “normalized, decreased to 20% and limited to 100”
Alerts:
Bollinger Band (%B) Alert Level with your switch
Bollinger Band (Width) Alert Level with your switch
BB (Volume) Alert with your switch
Setting.
Individual ma settings
All alerts can be adjusted
The color of the Intraday intensity index background and lines help you decide on your volatility breakout direction
The background color has been conditioned to smoothed X periods for the accumulated volume above the alert level, Intraday Intensity Index direction and %B direction.
I recommend for the use of this indicator to first read John Bollinger's book to understand the usefulness of each of the signals and their configuration to execute the orders.
Bollinger Bands Ultra [DM]Greetings Colleagues
I share here the classic Bollinger Bands indicator
From the Alma series that I am sharing, this is the third.
Fibonacci levels have been added to the bands to the delight of those who use this technique.
The moving average has also been replaced by an Arnaud legoux moving average
- Available settings:
1. MA length, deviation and offset
2. Individual settings for the MA "basis" (offset and sigma)
3. Activate or deactivate recurring alerts at the crossing of the mean and the ends of the bands
4. Color shift of the Moving average "basis"
5. Color change of the body of the bands
6. Bar color change
If you like them, I encourage you to share the most suitable settings you found for this variant.

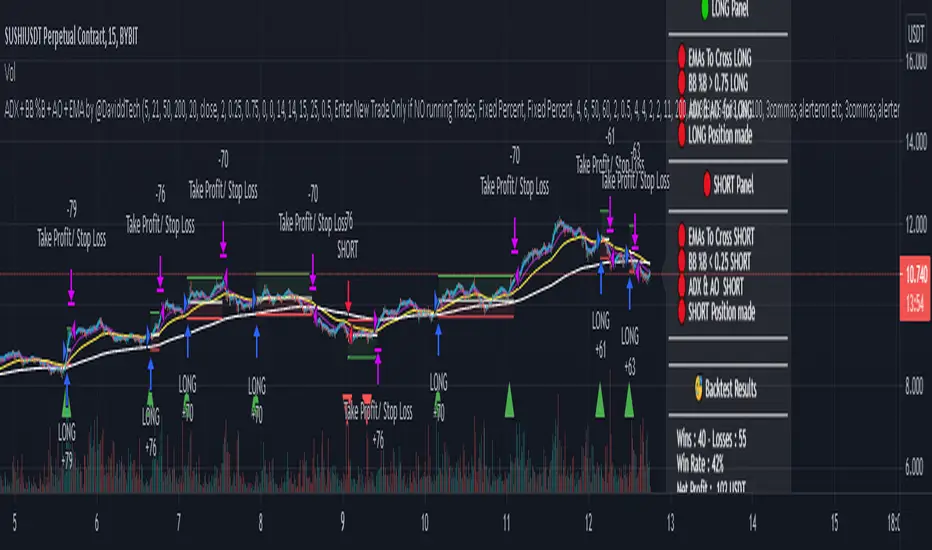
ADX + BB %B + AO + EMA by @DaviddTechThis trading strategy combines different indicators:
1) ADX , Average Directional Movement to make sure we are in a trend.
2) BB %B Bollinger Band %B: to spots relative price position to Bollinger Bands
3) AO Awesome Oscillator for momentum - you will need to configure this to fit the pair.
4) EMA 5, EMA 21, EMA 50, EMA 200: crossovers to get our entry short or long & trend direction
This script was inspired by TraderPro - Crazy 78% Win Rate Proven Trading Strategy Revealed - ADX + BB %B + AO + EMA
My settings are pretty much as default.
- I have added a 10,000 USD default
- 7% of portfolio is used to create the results.
You can of course optimize all of this in the settings.
WARNING:
- For purpose educate only
- Plots EMAs and other values on chart.
- This script to change bars colors.
Sideways detection bollinger bandsSideways detection indicator using Bollinger bands .
In this case we take the original ratio between lower and upper and we smooth it even harder in order to get a better idea about the accuracy of the trend.
If the initial ratio is not between 0 and 1 and the smooth ratio is higher than our selected value, we get an idea if we are a in trending market or not.
Of course using it as a standalone has no usage, and it has to be combined with other tools like moving average, oscillators and so on.
IF you have any questions let me know

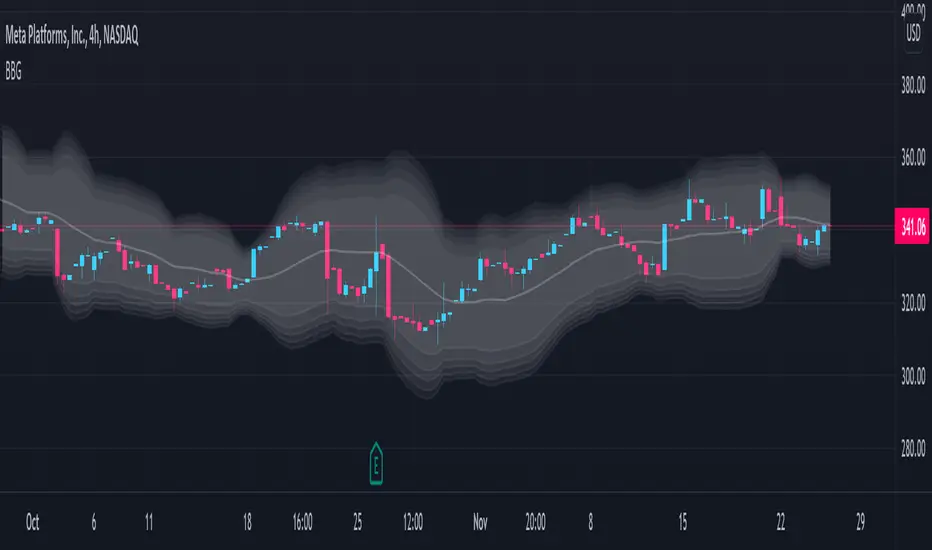
BBT‴ | Bollinger Band Trend Zone‴What does it do?
Makes available to you the BB (Bollinger Bands) in a colored format and provies signal on the right side bar according to a Short, Mid or Long period.
If the candles are going out of the Bands too often, then use the Extended Bollinger Band atributes available to create an extra band around the original ones.
How does it work?
The BB drawing is the exact same as the ordinary one. The big deal here is that the BB shade can be represented by a Short, Mid or Long MA period (7, 20 or 55 period), that you want it to be presented in the shade, which is the same as the MA lines you regularly use. When the MA goes down you have a given color and when the MA goes up you have another given color. This way you don't need to keep looking the MA lines, just perceive the current shade color.
What's my filling?
Makes the quick perception very easy, just look to the chart.
Indicator attributes:
- BB shade color acording to trend
- BB band line colors acording to trend
- right side bar signals color acording to trend
- BB shade can be darker, just drop the box and choose the darker version of it
- Extended Bollinger Band to create an extra band around the original ones
To have access to this indicator, please DM me.
Don't contact me in the comment area.
Best Bollinger BandsRemoving the Simple Moving Average and replacing it with the Hull Moving Average (HMA) in the Bollinger Bands (BB), you can not only predict support, resistance, and price movement, but you can also leverage the value of the BB in evaluating when price is over extended in an up and/or down trend.
Bollinger Bands OscillatorBollinger Bands as a standalone oscillator. Displays all the information of Bollinger Bands but with a handy oscillator to help locate entries. Entries and exits can be found when oscillator leaves the bands.

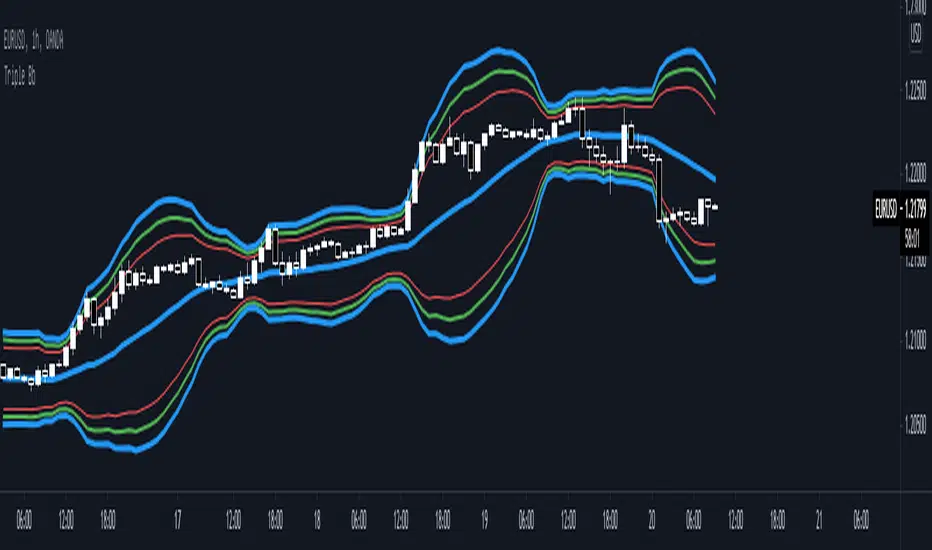
Triple Bb* Triple Bb display maximum 3 Bollinger Bands and each bands could be easily adjust.
* Each Bands Adjustable:
1. Source
2. Period
3. Standard Deviation
4. Color
5. Width
6. Show / Not Show
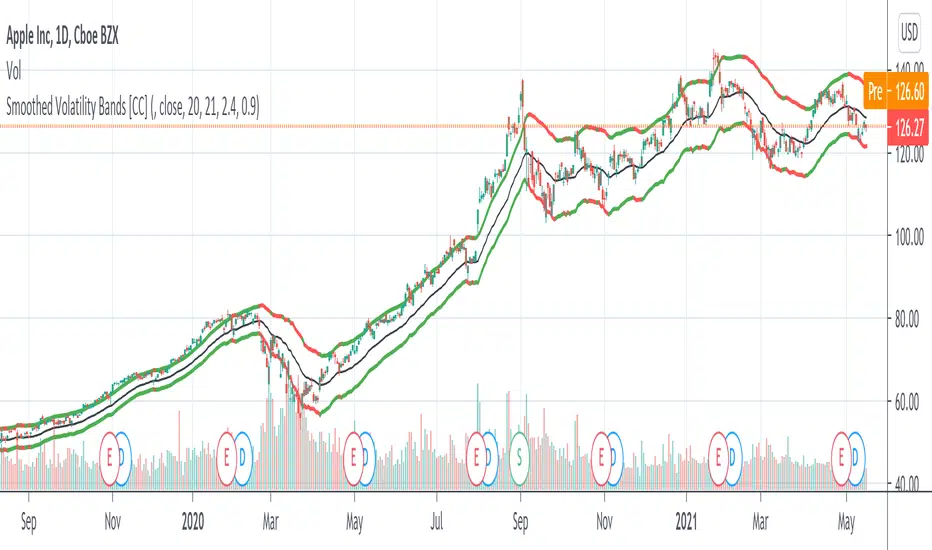
Smoothed Volatility Bands [CC]The Smoothed Volatility Bands were created by Sylvain Vervoort (Stocks and Commodities Sep 2020 pg 19) and this is a heavily customized version of regular Bollinger Bands that take volatility into account. Feel free to change the moving average since Vervoort recommended trying that out. Buy when the indicator line turns green and sell when it turns red.
Let me know if there are any other indicators you want me to publish!
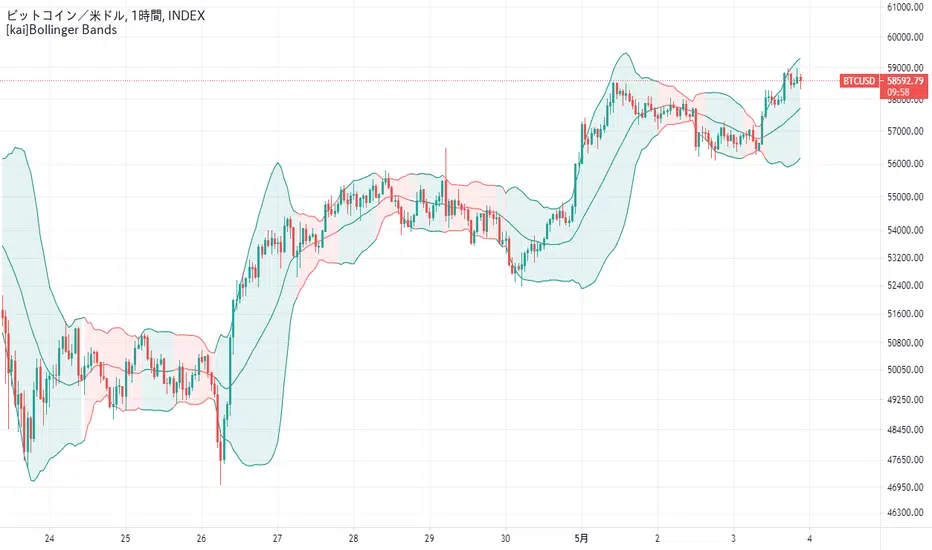
[kai]Bollinger BandsBollinger band compatible with log scale
You can display the squeezed part in red
ログスケールに対応したボリンジャーバンドです
スクイーズしたところを赤く表示することができます
EMA Ribbon Bollinger UltimateEma Ribbon and Bollinger Bands.
Background change color if the trend change or if it goes weak.

Alert// Short+long: SAR+HMA+Bollinger+support/resistanceHello, dear friends.
This script can be used for various strategies. Whether it's a scalp like now or more positional purchases. To determine the minimum and maximum, SAR ,resistance points, support points+HMA+ Bollinger channel are used. The entry occurs when the SAR intersects with the HMA , if it is above or below the support/ resistance levels.
In the settings there is a "back" how many bars to use back to search for these conditions.Also the standard setting is SAR+ multiplier.
The strategy based on these alerts is the same, but the conditions stipulate that the entry into the deal does not occur (while you are in the deal) if the purchase is more expensive than the previous one.
