Wstęgi i Kanały

TRK19121. Add the Script to TradingView
• Copy the Pine Script code I gave you.
• In TradingView, open the Pine Editor (bottom of the screen).
• Paste the code and click Add to Chart.
2. What You’ll See
• On your chart, Fibonacci retracement levels will be drawn automatically between the highest and lowest points in the last lookback bars (default = 100).
• Bollinger Bands (20-period SMA with ±2 standard deviations) will also appear.
• On the top-right corner, a table will show all Fibonacci levels (0%, 23.6%, 38.2%, 50%, 61.8%, 78.6%, 100%) with their exact price values.
• All text in the table is black for clarity.
3. How It Updates
• Every new candle, the script recalculates the highest and lowest points in the lookback window.
• The Fibonacci levels and the table update automatically.
• You don’t need to manually redraw fibo lines — the script does it for you.
4. How to Interpret
• Fibonacci levels act as potential support/resistance zones.
• Bollinger Bands show volatility and overbought/oversold conditions.
• If price is near a Fibonacci level and touches the Bollinger upper/lower band, that’s a strong signal area.
• Example:
• Price near 61.8% fibo + lower band → possible bounce (long).
• Price near 38.2% fibo + upper band → possible rejection (short).
5. Customization
• You can change the value (default 100 bars) to adjust how far back the script finds the high/low.
• You can change Bollinger settings (, ) to fit your trading style.
• The table always shows the current fibo levels clearly, so you don’t need to measure them manually.

Fibo + Bollinger + Fibo Tablosu1. Add the Script to TradingView
• Copy the Pine Script code I gave you.
• In TradingView, open the Pine Editor (bottom of the screen).
• Paste the code and click Add to Chart.
2. What You’ll See
• On your chart, Fibonacci retracement levels will be drawn automatically between the highest and lowest points in the last lookback bars (default = 100).
• Bollinger Bands (20-period SMA with ±2 standard deviations) will also appear.
• On the top-right corner, a table will show all Fibonacci levels (0%, 23.6%, 38.2%, 50%, 61.8%, 78.6%, 100%) with their exact price values.
• All text in the table is black for clarity.
3. How It Updates
• Every new candle, the script recalculates the highest and lowest points in the lookback window.
• The Fibonacci levels and the table update automatically.
• You don’t need to manually redraw fibo lines — the script does it for you.
4. How to Interpret
• Fibonacci levels act as potential support/resistance zones.
• Bollinger Bands show volatility and overbought/oversold conditions.
• If price is near a Fibonacci level and touches the Bollinger upper/lower band, that’s a strong signal area.
• Example:
• Price near 61.8% fibo + lower band → possible bounce (long).
• Price near 38.2% fibo + upper band → possible rejection (short).
5. Customization
• You can change the value (default 100 bars) to adjust how far back the script finds the high/low.
• You can change Bollinger settings (, ) to fit your trading style.
• The table always shows the current fibo levels clearly, so you don’t need to measure them manually.


QuantBot StrategyAutomated opening range breakout strategy for futures and intraday trading. Identifies the initial trading range and executes trades on breakouts with multiple confluence filters.
Key Features:
Opening Range Detection: Automatically identifies and tracks the opening range
Multi-Filter Entry System: Optional confluence filters to improve entry quality
Flexible Profit Targets: Dynamic targets based on recent volatility, or fixed tick/dollar targets
Advanced Position Management: Add to positions at key levels; partial profit-taking with trailing runners
Risk Controls: Multiple stop loss methods, maximum trade limits, and distance filters
Time-Based Filters: Configurable trading hours and days, with optional holiday blackouts
Visual Indicators: Displays trend lines, bands, and range levels on your chart
Designed for disciplined, systematic trading with customizable risk management and position sizing.

Weekly & Monthly Thresholds + VIX-Based Dynamic TargetsWeekly & Monthly Thresholds + VIX-Based Dynamic Targets
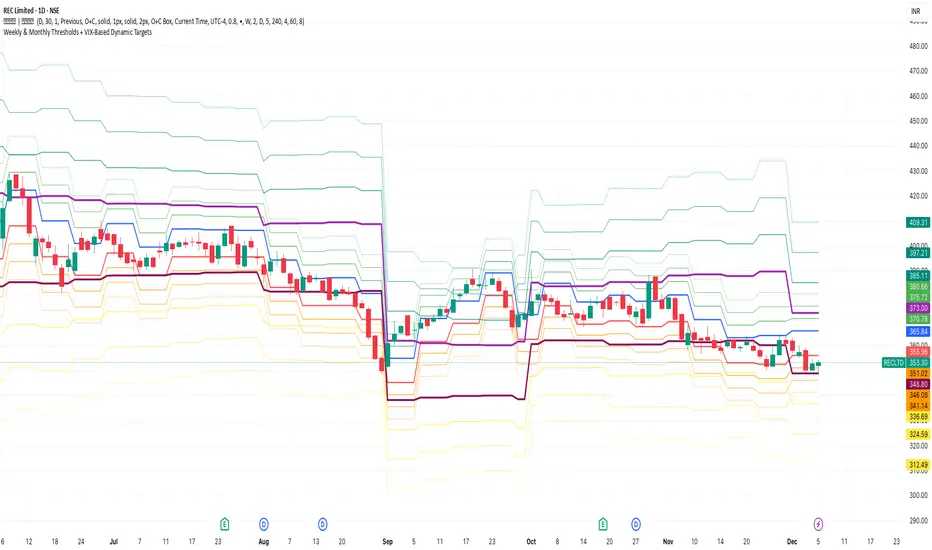
Weekly & Monthly Thresholds + VIX-Based Dynamic TargetsWeekly & Monthly Thresholds + VIX-Based Dynamic Targets

Impulse Reactor RSI-SMA Trend Indicator [ApexLegion]Impulse Reactor RSI-SMA Trend Indicator
Introduction and Theoretical Background
Design Rationale
Standard indicators frequently generate binary 'BUY' or 'SELL' signals without accounting for the broader market context. This often results in erratic "Flip-Flop" behavior, where signals are triggered indiscriminately regardless of the prevailing volatility regime.
Impulse Reactor was engineered to address this limitation by unifying two critical requirements: Quantitative Rigor and Execution Flexibility.
The Solution
Composite Analytical Framework This script is not a simple visual overlay of existing indicators. It is an algorithmic synthesis designed to function as a unified decision-making engine. The primary objective was to implement rigorous quantitative analysis (Volatility Normalization, Structural Filtering) directly within an alert-enabled framework. This architecture is designed to process signals through strict, multi-factor validation protocols before generating real-time notifications, allowing users to focus on structurally validated setups without manual monitoring.
How It Works
This is not a simple visual mashup. It utilizes a cross-validation algorithm where the Trend Structure acts as a gatekeeper for Momentum signals:
Logic over Lag: Unlike simple moving average crossovers, this script uses a 15-layer Gradient Ribbon to detect "Laminar Flow." If the ribbon is knotted (Compression), the system mathematically suppresses all signals.
Volatility Normalization: The core calculation adapts to ATR (Average True Range). This means the indicator automatically expands in volatile markets and contracts in quiet ones, maintaining accuracy without constant manual tweaking.
Adaptive Signal Thresholding: It incorporates an 'Anti-Greed' algorithm (Dynamic Thresholding) that automatically adjusts entry criteria based on trend duration. This logic aims to mitigate the risk of entering positions during periods of statistical trend exhaustion.
Why Use It?
Market State Decoding: The gradient Ribbon visualizes the underlying trend phase in real-time.
◦ Cyan/Blue Flow: Strong Bullish Trend (Laminar Flow).
◦ Magenta/Pink Flow: Strong Bearish Trend.
◦ Compressed/Knotted: When the ribbon lines are tightly squeezed or overlapping, it signals Consolidation. The system filters signals here to avoid chop.
Noise Reduction: The goal is not to catch every pivot, but to isolate high-confidence setups. The logic explicitly filters out minor fluctuations to help maintain position alignment with the broader trend.
⚖️ Chapter 1: System Architecture
Introduction: Composite Analytical Framework
System Overview
Impulse Reactor serves as a comprehensive technical analysis engine designed to synthesize three distinct market dimensions—Momentum, Volatility, and Trend Structure—into a unified decision-making framework. Unlike traditional methods that analyze these metrics in isolation, this system functions as a central processing unit that integrates disparate data streams to construct a coherent model of market behavior.
Operational Objective
The primary objective is to transition from single-dimensional signal generation to a multi-factor assessment model. By fusing data from the Impulse Core (Volatility), Gradient Oscillator (Momentum), and Structural Baseline (Trend), the system aims to filter out stochastic noise and identify high-probability trade setups grounded in quantitative confluence.
Market Microstructure Analysis: Limitations of Conventional Models
Extensive backtesting and quantitative analysis have identified three critical inefficiencies in standard oscillator-based strategies:
• Bounded Oscillator Limitations (The "Oscillation Trap"): Traditional indicators such as RSI or Stochastics are mathematically constrained between fixed values (0 to 100). In strong trending environments, these metrics often saturate in "overbought" or "oversold" zones. Consequently, traders relying on static thresholds frequently exit structurally valid positions prematurely or initiate counter-trend trades against prevailing momentum, resulting in suboptimal performance.
• Quantitative Blindness to Quality: Standard moving averages and trend indicators often fail to distinguish the qualitative nature of price movement. They treat low-volume drift and high-velocity expansion identically. This inability to account for "Volatility Quality" leads to delayed responsiveness during critical market events.
• Fractal Dissonance (Timeframe Disconnect): Financial markets exhibit fractal characteristics where trends on lower timeframes may contradict higher timeframe structures. Manual integration of multi-timeframe analysis increases cognitive load and susceptibility to human error, often resulting in conflicting biases at the point of execution.
Core Design Principles
To mitigate the aforementioned systemic inefficiencies, Impulse Reactor employs a modular architecture governed by three foundational principles:
Principle A:
Volatility Precursor Analysis Market mechanics demonstrate that volatility expansion often functions as a leading indicator for directional price movement. The system is engineered to detect "Volatility Deviation" — specifically, the divergence between short-term and long-term volatility baselines—prior to its manifestation in price action. This allows for entry timing aligned with the expansion phase of market volatility.
Principle B:
Momentum Density Visualization The system replaces singular momentum lines with a "Momentum Density" model utilizing a 15-layer Simple Moving Average (SMA) Ribbon.
• Concept: This visualization represents the aggregate strength and consistency of the trend.
• Application: A fully aligned and expanded ribbon indicates a robust trend structure ("Laminar Flow") capable of withstanding minor counter-trend noise, whereas a compressed ribbon signals consolidation or structural weakness.
Principle C:
Adaptive Confluence Protocols Signal validity is strictly governed by a multi-dimensional confluence logic. The system suppresses signal generation unless there is synchronized confirmation across all three analytical vectors:
1. Volatility: Confirmed expansion via the Impulse Core.
2. Momentum: Directional alignment via the Hybrid Oscillator.
3. Structure: Trend validation via the Baseline. This strict filtering mechanism significantly reduces false positives in non-trending (choppy) environments while maintaining sensitivity to genuine breakouts.
🔍 Chapter 2: Core Modules & Algorithmic Logic
Module A: Impulse Core (Normalized Volatility Deviation)
Operational Logic The Impulse Core functions as a volatility-normalized momentum gauge rather than a standard oscillator. It is designed to identify "Volatility Contraction" (Squeeze) and "Volatility Expansion" phases by quantifying the divergence between short-term and long-term volatility states.
Volatility Z-Score Normalization
The formula implements a custom normalization algorithm. Unlike standard oscillators that rely on absolute price changes, this logic calculates the Z-Score of the Volatility Spread.
◦ Numerator: (atr_f - atr_s) captures the raw momentum of volatility expansion.
◦ Denominator: (std_f + 1e-6) standardizes this value against historical variance.
◦ Result: This allows the indicator scales consistently across assets (e.g., Bitcoin vs. Euro) without manual recalibration.
f_impulse() =>
atr_f = ta.atr(fastLen) // Fast Volatility Baseline
atr_s = ta.atr(slowLen) // Slow Volatility Baseline
std_f = ta.stdev(atr_f, devLen) // Volatility Standard Deviation
(atr_f - atr_s) / (std_f + 1e-6) // Normalized Differential Calculation
Algorithmic Framework
• Differential Calculation: The system computes the spread between a Fast Volatility Baseline (ATR-10) and a Slow Volatility Baseline (ATR-30).
• Normalization Protocol: To standardize consistency across diverse asset classes (e.g., Forex vs. Crypto), the raw differential is divided by the standard deviation of the volatility itself over a 30-period lookback.
• Signal Generation:
◦ Contraction (Squeeze): When the Fast ATR compresses below the Slow ATR, it registers a potential volatility buildup phase.
◦ Expansion (Release): A rapid divergence of the Fast ATR above the Slow ATR signals a confirmed volatility expansion, validating the strength of the move.
Module B: Gradient Oscillator (RSI-SMA Hybrid)
Design Rationale To mitigate the "noise" and "false reversal" signals common in single-line oscillators (like standard RSI), this module utilizes a 15-Layer Gradient Ribbon to visualize momentum density and persistence.
Technical Architecture
• Ribbon Array: The system generates 15 sequential Simple Moving Averages (SMA) applied to a volatility-adjusted RSI source. The length of each layer increases incrementally.
• State Analysis:
Momentum Alignment (Laminar Flow): When all 15 layers are expanded and parallel, it indicates a robust trend where buying/selling pressure is distributed evenly across multiple timeframes. This state helps filter out premature "overbought/oversold" signals.
• Consolidation (Compression): When the distance between the fastest layer (Layer 1) and the slowest layer (Layer 15) approaches zero or the layers intersect, the system identifies a "Non-Tradable Zone," preventing entries during choppy market conditions.
// Laminar Flow Validation
f_validate_trend() =>
// Calculate spread between Ribbon layers
ribbon_spread = ta.stdev(ribbon_array, 15)
// Only allow signals if Ribbon is expanded (Laminar Flow)
is_flowing = ribbon_spread > min_expansion_threshold
// If compressed (Knotted), force signal to false
is_flowing ? signal : na
Module C: Adaptive Signal Filtering (Behavioral Bias Mitigation)
This subsystem, operating as an algorithmic "Anti-Greed" Mechanism, addresses the statistical tendency for signal degradation following prolonged trends.
Dynamic Threshold Adjustment
• Win Streak Detection: The algorithm internally tracks the outcome of closed trade cycles.
• Sensitivity Multiplier: Upon detecting consecutive successful signals in the same direction, a Penalty_Factor is applied to the entry logic.
• Operational Impact: This effectively raises the Required_Slope threshold for subsequent signals. For example, after three consecutive bullish signals, the system requires a 30% steeper trend angle to validate a fourth entry. This enforces stricter discipline during extended trends to reduce the probability of entering at the point of trend exhaustion.
Anti-Greed Logic: Dynamic Threshold Calculation
f_adjust_threshold(base_slope, win_streak) =>
// Adds a 10% penalty to the difficulty for every consecutive win
penalty_factor = 0.10
risk_scaler = 1 + (win_streak * penalty_factor)
// Returns the new, harder-to-reach threshold
base_slope * risk_scaler
Module D: Trend Baseline (Triple-Smoothed Structure)
The Trend Baseline serves as the structural filter for all signals. It employs a Triple-Smoothed Hybrid Algorithm designed to balance lag reduction with noise filtration.
Smoothing Stages
1. Volatility Banding: Utilizes a SuperTrend-based calculation to establish the upper and lower boundaries of price action.
2. Weighted Filter: Applies a Weighted Moving Average (WMA) to prioritize recent price data.
3. Exponential Smoothing: A final Exponential Moving Average (EMA) pass is applied to create a seamless baseline curve.
Functionality
This "Heavy" baseline resists minor intraday volatility spikes while remaining responsive to sustained structural shifts. A signal is only considered valid if the price action maintains structural integrity relative to this baseline
🚦 Chapter 3: Risk Management & Exit Protocols
Quantitative Risk Management (TP/SL & Trailing)
Foundational Architecture: Volatility-Adjusted Geometry Unlike strategies relying on static nominal values, Impulse Reactor establishes dynamic risk boundaries derived from quantitative volatility metrics. This design aligns trade invalidation levels mathematically with the current market regime.
• ATR-Based Dynamic Bracketing:
The protocol calculates Stop-Loss and Take-Profit levels by applying Fibonacci coefficients (Default: 0.786 for SL / 1.618 for TP) to the Average True Range (ATR).
◦ High Volatility Environments: The risk bands automatically expand to accommodate wider variance, preventing premature exits caused by standard market noise.
◦ Low Volatility Environments: The bands contract to tighten risk parameters, thereby dynamically adjusting the Risk-to-Reward (R:R) geometry.
• Close-Validation Protocol ("Soft Stop"):
Institutional algorithms frequently execute liquidity sweeps—driving prices briefly below key support levels to accumulate inventory.
◦ Mechanism: When the "Soft Stop" feature is enabled, the system filters out intraday volatility spikes. The stop-loss is conditional; execution is triggered only if the candle closes beyond the invalidation threshold.
◦ Strategic Advantage: This logic distinguishes between momentary price wicks and genuine structural breakdowns, preserving positions during transient volatility.
• Step-Function Trailing Mechanism:
To protect unrealized PnL while allowing for normal price breathing, a two-phase trailing methodology is employed:
◦ Phase 1 (Activation): The trailing function remains dormant until the price advances by a pre-defined percentage threshold.
◦ Phase 2 (Dynamic Floor): Once armed, the stop level creates a moving floor, adjusting relative to price action while maintaining a volatility-based (ATR) buffer to systematically protect unrealized PnL.
• Algorithmic Exit Protocols (Dynamic Liquidity Analysis)
◦ Rationale: Inefficiencies of Static Targets Static "Take Profit" levels often result in suboptimal exits. They compel traders to close positions based on arbitrary figures rather than evolving market structure, potentially capping upside during significant trends or retaining positions while the underlying trend structure deteriorates.
◦ Solution: Structural Integrity Assessment The system utilizes a Dynamic Liquidity Engine to continuously audit the validity of the position. Instead of targeting a specific price point, the algorithm evaluates whether the trend remains statistically robust.
Multi-Factor Exit Logic (The Tri-Vector System)
The Smart Exit protocol executes only when specific algorithmic invalidation criteria are met:
• 1. Momentum Exhaustion (Confluence Decay): The system monitors a 168-hour rolling average of the Confluence Score. A significant deviation below this historical baseline indicates momentum exhaustion, signaling that the driving force behind the trend has dissipated prior to a price reversal. This enables preemptive exits before a potential drawdown.
• 2. Statistical Over-Extension (Mean Reversion): Utilizing the core volatility logic, the system identifies instances where price deviates beyond 2.0 standard deviations from the mean. While the trend may be technically bullish, this statistical anomaly suggests a high probability of mean reversion (elastic snap-back), triggering a defensive exit to capitalize on peak valuation.
• 3. Oscillator Rejection (Immediate Pivot): To manage sudden V-shaped volatility, the system monitors RSI pivots. If a sharp "Pivot High" or divergence is detected, the protocol triggers an immediate "Peak Exit," bypassing standard trend filters to secure liquidity during high-velocity reversals.
🎨 Chapter 4: Visualization Guide
Gradient Oscillator Ribbon
The 15-layer SMA ribbon visualized via plot(r1...r15) represents the "Momentum Density" of the market.
• Visuals:
◦ Cyan/Blue Ribbon: Indicates Bullish Momentum.
◦ Pink/Magenta Ribbon: Indicates Bearish Momentum.
• Interpretation:
◦ Laminar Flow: When the ribbon expands widely and flows in parallel, it signifies a robust trend where momentum is distributed evenly across timeframes. This is the ideal state for trend-following.
◦ Compression (Consolidation): If the ribbon becomes narrow, twisted, or knotted, it indicates a "Non-Tradable Zone" where the market lacks a unified direction. Traders are advised to wait for clarity.
◦ Over-Extension: If the top layer crosses the Overbought (85) or Oversold (15) lines, it visually warns of potential market overheating.
Trend Baseline
The thick, color-changing line plotted via plot(baseline) represents the Structural Backbone of the market.
• Visuals: Changes color based on the trend direction (Blue for Bullish, Pink for Bearish).
• Interpretation:
Structural Filter: Long positions are statistically favored only when price action sustains above this baseline, while short positions are favored below it.
Dynamic Support/Resistance: The baseline acts as a dynamic support level during uptrends and resistance during downtrends.
Entry Signals & Labels
Text labels ("Long Entry", "Short Entry") appear when the system detects high-probability setups grounded in quantitative confluence.
• Visuals: Labeled signals appear above/below specific candles.
• Interpretation:
These signals represent moments where Volatility (Expansion), Momentum (Alignment), and Structure (Trend) are synchronized.
Smart Exit: Labels such as "Smart Exit" or "Peak Exit" appear when the system detects momentum exhaustion or structural decay, prompting a defensive exit to preserve capital.
Dynamic TP/SL Boxes
The semi-transparent colored zones drawn via fill() represent the risk management geometry.
• Visuals: Colored boxes extending from the entry point to the Take Profit (TP) and Stop Loss (SL) levels.
• Function:
Volatility-Adjusted Geometry: Unlike static price targets, these boxes expand during high volatility (to prevent wicks from stopping you out) and contract during low volatility (to optimize Risk-to-Reward ratios).
SAR + MACD Glow
Small glowing shapes appearing above or below candles.
• Visuals: Triangle or circle glows near the price bars.
• Interpretation:
This visual indicates a secondary confirmation where Parabolic SAR and MACD align with the main trend direction. It serves as an additional confluence factor to increase confidence in the trade setup.
Support/Resistance Table
A small table located at the bottom-right of the chart.
• Function: Automatically identifies and displays recent Pivot Highs (Resistance) and Pivot Lows (Support).
• Interpretation: These levels can be used as potential targets for Take Profit or invalidation points for manual Stop Loss adjustments.
🖥️ Chapter 5: Dashboard & Operational Guide
Integrated Analytics Panel (Dashboard Overview)
To facilitate rapid decision-making without manual calculation, the system aggregates critical market dimensions into a unified "Heads-Up Display" (HUD). This panel monitors real-time metrics across multiple timeframes and analytical vectors.
A. Intermediate Structure (12H Trend)
• Function: Anchors the intraday analysis to the broader market structure using a 12-hour rolling window.
• Interpretation:
◦ Bullish (> +0.5%): Indicates a positive structural bias. Long setups align with the macro flow.
◦ Bearish (< -0.5%): Indicates structural weakness. Short setups are statistically favored.
◦ Neutral: Represents a ranging environment where the Confluence Score becomes the primary weighting factor.
B. Composite Confluence Score (Signal Confidence)
• Definition: A probability metric derived from the synchronization of Volatility (Impulse Core), Momentum (Ribbon), and Trend (Baseline).
• Grading Scale:
Strong Buy/Sell (> 7.0 / < 3.0): Indicates full alignment across all three vectors. Represents a "Prime Setup" eligible for standard position sizing.
Buy/Sell (5.0–7.0 / 3.0–5.0): Indicates a valid trend but with moderate volatility confirmation.
Neutral: Signals conflicting data (e.g., Bullish Momentum vs. Bearish Structure). Trading is not recommended ("No-Trade Zone").
C. Statistical Deviation Status (Mean Reversion)
• Logic: Utilizes Bollinger Band deviation principles to quantify how far price has stretched from the statistical mean (20 SMA).
• Alert States:
Over-Extended (> 2.0 SD): Warning that price is statistically likely to revert to the mean (Elastic Snap-back), even if the trend remains technically valid. New entries are discouraged in this zone.
Normal: Price is within standard distribution limits, suitable for trend-following entries.
D. Volatility Regime Classification
• Metric: Compares current ATR against a 100-period historical baseline to categorize the market state.
• Regimes:
Low Volatility (Lvl < 1.0): Market Compression. Often precedes volatility expansion events.
Mid Volatility (Lvl 1.0 - 1.5): Standard operating environment.
High Volatility (Lvl > 1.5): Elevated market stress. Risk parameters should be adjusted (e.g., reduced position size) to account for increased variance.
E. Performance Telemetry
• Function: Displays the historical reliability of the Trend Baseline for the current asset and timeframe.
• Operational Threshold: If the displayed Win Rate falls below 40%, it suggests the current market behavior is incoherent (choppy) and does not respect trend logic. In such cases, switching assets or timeframes is recommended.
Operational Protocols & Signal Decoding
Visual Interpretation Standards
• Laminar Flow (Trade Confirmation): A valid trend is visually confirmed when the 15-layer SMA Ribbon is fully expanded and parallel. This indicates distributed momentum across timeframes.
• Consolidation (No-Trade): If the ribbon appears twisted, knotted, or compressed, the market lacks a unified directional vector.
• Baseline Interaction: The Triple-Smoothed Baseline acts as a dynamic support/resistance filter. Long positions remain valid only while price sustains above this structure.
System Calibration (Settings)
• Adaptive Signal Filtering (Prev. Anti-Greed): Enabled by default. This logic automatically raises the required trend slope threshold following consecutive wins to mitigate behavioral bias.
• Impulse Sensitivity: Controls the reactivity of the Volatility Core. Higher settings capture faster moves but may introduce more noise.
⚙️ Chapter 6: System Configuration & Alert Guide
This section provides a complete breakdown of every adjustable setting within Impulse Reactor to assist you in tailoring the engine to your specific needs.
🌐 LANGUAGE SETTINGS (Localization)
◦ Select Language (Default: English):
Function: Instantly translates all chart labels, dashboard texts into your preferred language.
Supported: English, Korean, Chinese, Spanish
⚡ IMPULSE CORE SETTINGS (Volatility Engine)
◦ Deviation Lookback (Default: 30): The period used to calculate the standard deviation of volatility.
Role: Sets the baseline for normalizing momentum. Higher values make the core smoother but slower to react.
◦ Fast Pulse Length (Default: 10): The short-term ATR period.
Role: Detects rapid volatility expansion.
◦ Slow Pulse Length (Default: 30): The long-term ATR baseline.
Role: Establishes the background volatility level. The core signal is derived from the divergence between Fast and Slow pulses.
🎯 TP/SL SETTINGS (Risk Management)
◦ SL/TP Fibonacci (Default: 0.786 / 1.618): Selects the Fibonacci ratio used for risk calculation.
◦ SL/TP Multiplier (Default: 1.5 / 2): Applies a multiplier to the ATR-based bands.
Role: Expands or contracts the Take Profit and Stop Loss boxes. Increase these values for higher volatility assets (like Altcoins) to avoid premature stop-outs.
◦ ATR Length (Default: 14): The lookback period for calculating the Average True Range used in risk geometry.
◦ Use Soft Stop (Close Basis):
Role: If enabled, Stop Loss alerts only trigger if a candle closes beyond the invalidation level. This prevents being stopped out by wick manipulations.
🔊 RIBBON SETTINGS (Momentum Visualization)
◦ Show SMA Ribbon: Toggles the visibility of the 15-layer gradient ribbon.
◦ Ribbon Line Count (Default: 15): The number of SMA lines in the ribbon array.
◦ Ribbon Start Length (Default: 2) & Step (Default: 1): Defines the spread of the ribbon.
Role: Controls the "thickness" of the momentum density visualization. A wider step creates a broader ribbon, useful for higher timeframes.
📎 DISPLAY OPTIONS
◦ Show Entry Lines / TP/SL Box / Position Labels / S/R Levels / Dashboard: Toggles individual visual elements on the chart to reduce clutter.
◦ Show SAR+MACD Glow: Enables the secondary confirmation shapes (triangles/circles) above/below candles.
📈 TREND BASELINE (Structural Filter)
◦ Supertrend Factor (Default: 12) & ATR Period (Default: 90): Controls the sensitivity of the underlying Supertrend algorithm used for the baseline calculation.
◦ WMA Length (40) & EMA Length (14): The smoothing periods for the Triple-Smoothed Baseline.
◦ Min Trend Duration (Default: 10): The minimum number of bars the trend must be established before a signal is considered valid.
🧠 SMART EXIT (Dynamic Liquidity)
◦ Use Smart Exit: Enables the momentum exhaustion logic.
◦ Exit Threshold Score (Default: 3): The sensitivity level for triggering a Smart Exit. Lower values trigger earlier exits.
◦ Average Period (168) & Min Hold Bars (5): Defines the rolling window for momentum decay analysis and the minimum duration a trade must be held before Smart Exit logic activates.
🛡️ TRAILING STOP (Step)
◦ Use Trailing Stop: Activates the step-function trailing mechanism.
◦ Step 1 Activation % (0.5) & Offset % (0.5): The price must move 0.5% in your favor to arm the first trail level, which sets a stop 0.5% behind price.
◦ Step 2 Activation % (1) & Offset % (0.2): Once price moves 1%, the trail tightens to 0.2%, securing the position.
🌀 SAR & MACD SETTINGS (Secondary Confirmation)
◦ SAR Start/Increment/Max: Standard Parabolic SAR parameters.
◦ SAR Score Scaling (ATR): Adjusts how much weight the SAR signal has in the overall confluence score.
◦ MACD Fast/Slow/Signal: Standard MACD parameters used for the "Glow" signals.
🔄 ANTI-GREED LOGIC (Behavioral Bias)
◦ Strict Entry after Win: Enables the negative feedback loop.
◦ Strict Multiplier (Default: 1.1): Increases the entry difficulty by 10% after each win.
Role: Prevents overtrading and entering at the top of an extended trend.
🌍 HTF FILTER (Multi-Timeframe)
◦ Use Auto-Adaptive HTF Filter: Automatically selects a higher timeframe (e.g., 1H -> 4H) to filter signals.
◦ Bypass HTF on Steep Trigger: Allows an entry even against the HTF trend if the local momentum slope is exceptionally steep (catch powerful reversals).
📉 RSI PEAK & CHOPPINESS
◦ RSI Peak Exit (Instant): Triggers an immediate exit if a sharp RSI pivot (V-shape) is detected.
◦ Choppiness Filter: Suppresses signals if the Choppiness Index is above the threshold (Default: 60), indicating a flat market.
📐 SLOPE TRIGGER LOGIC
◦ Force Entry on Steep Slope: Overrides other filters if the price angle is extremely vertical (high velocity).
◦ Slope Sensitivity (1.5): The angle required to trigger this override.
⛔ FLAT MARKET FILTER (ADX & ATR)
◦ Use ADX Filter: Blocks signals if ADX is below the threshold (Default: 20), indicating no trend.
◦ Use ATR Flat Filter: Blocks signals if volatility drops below a critical level (dead market).
🔔 Alert Configuration Guide
Impulse Reactor is designed with a comprehensive suite of alert conditions, allowing you to automate your trading or receive real-time notifications for specific market events.
How to Set Up:
Click the "Alert" (Clock) icon in the TradingView toolbar.
Select "Impulse Reactor " from the Condition dropdown.
Choose one of the specific trigger conditions below:
🚀 Entry Signals (Trend Initiation)
Long Entry:
Trigger: Fires when a confirmed Bullish Setup is detected (Momentum + Volatility + Structure align).
Usage: Use this to enter new Long positions.
Short Entry:
Trigger: Fires when a confirmed Bearish Setup is detected.
Usage: Use this to enter new Short positions.
🎯 Profit Taking (Target Levels)
Long TP:
Trigger: Fires when price hits the calculated Take Profit level for a Long trade.
Usage: Automate partial or full profit taking.
Short TP:
Trigger: Fires when price hits the calculated Take Profit level for a Short trade.
Usage: Automate partial or full profit taking.
🛡️ Defensive Exits (Risk Management)
Smart Exit:
Trigger: Fires when the system detects momentum decay or statistical exhaustion (even if the trend hasn't fully reversed).
Usage: Recommended for tightening stops or closing positions early to preserve gains.
Overbought / Oversold:
Trigger: Fires when the ribbon extends into extreme zones.
Usage: Warning signal to prepare for a potential reversal or pullback.
💡 Secondary Confirmation (Confluence)
SAR+MACD Bullish:
Trigger: Fires when Parabolic SAR and MACD align bullishly with the main trend.
Usage: Ideal for Pyramiding (adding to an existing winning position).
SAR+MACD Bearish:
Trigger: Fires when Parabolic SAR and MACD align bearishly.
Usage: Ideal for adding to short positions.
⚠️ Chapter 7: Conclusion & Risk Disclosure
Methodological Synthesis
Impulse Reactor represents a shift from reactive price tracking to proactive energy analysis. By decomposing market activity into its atomic components — Volatility, Momentum, and Structure — and reconstructing them into a coherent decision model, the system aims to provide a quantitative framework for market engagement. It is designed not to predict the future, but to identify high-probability conditions where kinetic energy and trend structure align.
Disclaimer & Risk Warnings
◦ Educational Purpose Only
This indicator, including all associated code, documentation, and visual outputs, is provided strictly for educational and informational purposes. It does not constitute financial advice, investment recommendations, or a solicitation to buy or sell any financial instruments.
◦ No Guarantee of Performance
Past performance is not indicative of future results. All metrics displayed on the dashboard (including "Win Rate" and "P&L") are theoretical calculations based on historical data. These figures do not account for real-world trading factors such as slippage, liquidity gaps, spread costs, or broker commissions.
◦ High-Risk Warning
Trading cryptocurrencies, futures, and leveraged financial products involves a substantial risk of loss. The use of leverage can amplify both gains and losses. Users acknowledge that they are solely responsible for their trading decisions and should conduct independent due diligence before executing any trades.
◦ Software Limitations
The software is provided "as is" without warranty. Users should be aware that market data feeds on analysis platforms may experience latency or outages, which can affect signal generation accuracy.

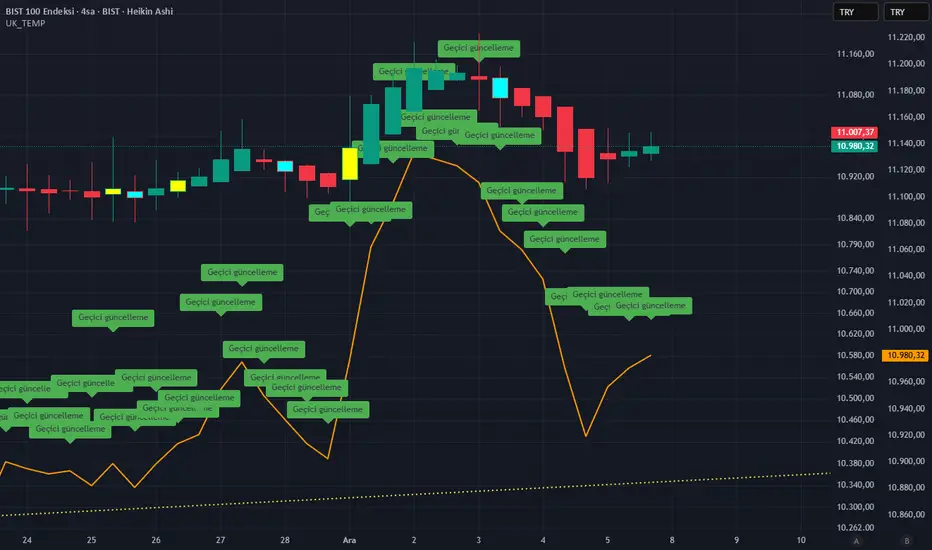
Weekly & Monthly Thresholds + Targets (final, fixed)bullish and bearish weekly and monthly range for the whole audience

Weekly & Monthly Thresholds + Targets (final, fixed)with alerts the weekly and monthly bullish and bearish ranges

Opening Range + Prev/Pre/Post Market Hi/Lo
Tracks each day’s regular-session high/low and their bar_index.
On a new day, stores those as “prev day” values.
Draws the prev-day lines anchored at the actual high/low bars from yesterday, then extends them across today (and beyond).

Zumiko ADHD Trend🎶 ZuMiKo – Team of the Future 🎶
ZuMiKo on the front line, competition in the background,
Team number one – everyone knows that!
Indicators like gold, dollars flying by,
The machine does the work, you just count the profits.
Zero accidents, every move is right here,
The algorithm is like a sniper – it hits without fail.
From zero to a hundred, the pace doesn't slow down here,
Whoever bets on ZuMiKo will win and reign supreme tomorrow.
Zu-Mi-Ko! – the future is in motion,
One click and you get a financial boost!
Zu-Mi-Ko! – the plan is fulfilled here,
The machine works, and you count the balance!
A new era of business, no carrying,
The system does the selling, you have time to use.
Phone in your pocket, money spinning,
When others are afraid – our team just rushes ahead.
No bullshit here, just results and facts,
Indicators in the green, like lights for a rocket.
A team like concrete, everyone here is a player,
Either you stand and watch, or you join in and get it!
Zu-Mi-Ko! – the future is in motion,
One click and you get a financial boost!
Zu-Mi-Ko! – the plan is coming true here,
The machine is working, and you're counting your money!
Don't wait for a miracle, because the miracle is already here,
Technology is working for your future and peace of mind.
Don't ask “is it worth it?”, just “when do we start?”,
Because this is the moment to deal the cards.
Zu-Mi-Ko! – it's not a dream, it's a game,
Team number one – this is where you win money!
Zu-Mi-Ko! – jump into the game,
One click separates you from this story!
t.me

Zumiko Haso🎶 ZuMiKo – Team of the Future 🎶
ZuMiKo on the front line, competition in the background,
Team number one – everyone knows that!
Indicators like gold, dollars flying by,
The machine does the work, you just count the profits.
Zero accidents, every move is right here,
The algorithm is like a sniper – it hits without fail.
From zero to a hundred, the pace doesn't slow down here,
Whoever bets on ZuMiKo will win and reign supreme tomorrow.
Zu-Mi-Ko! – the future is in motion,
One click and you get a financial boost!
Zu-Mi-Ko! – the plan is fulfilled here,
The machine works, and you count the balance!
A new era of business, no carrying,
The system does the selling, you have time to use.
Phone in your pocket, money spinning,
When others are afraid – our team just rushes ahead.
No bullshit here, just results and facts,
Indicators in the green, like lights for a rocket.
A team like concrete, everyone here is a player,
Either you stand and watch, or you join in and get it!
Zu-Mi-Ko! – the future is in motion,
One click and you get a financial boost!
Zu-Mi-Ko! – the plan is coming true here,
The machine is working, and you're counting your money!
Don't wait for a miracle, because the miracle is already here,
Technology is working for your future and peace of mind.
Don't ask “is it worth it?”, just “when do we start?”,
Because this is the moment to deal the cards.
Zu-Mi-Ko! – it's not a dream, it's a game,
Team number one – this is where you win money!
Zu-Mi-Ko! – jump into the game,
One click separates you from this story!
t.me

Simple Moving Averages + LabelsSimple Moving Averages
With this indicator, you can add a personal and visual touch to your simple mobile averages, activating and customizing the way you view your SMAs with or without labels and prices.

Zumiko Haso🎶 ZuMiKo – Team of the Future 🎶
ZuMiKo on the front line, competition in the background,
Team number one – everyone knows that!
Indicators like gold, dollars flying by,
The machine does the work, you just count the profits.
Zero accidents, every move is right here,
The algorithm is like a sniper – it hits without fail.
From zero to a hundred, the pace doesn't slow down here,
Whoever bets on ZuMiKo will win and reign supreme tomorrow.
Zu-Mi-Ko! – the future is in motion,
One click and you get a financial boost!
Zu-Mi-Ko! – the plan is fulfilled here,
The machine works, and you count the balance!
A new era of business, no carrying,
The system does the selling, you have time to use.
Phone in your pocket, money spinning,
When others are afraid – our team just rushes ahead.
No bullshit here, just results and facts,
Indicators in the green, like lights for a rocket.
A team like concrete, everyone here is a player,
Either you stand and watch, or you join in and get it!
Zu-Mi-Ko! – the future is in motion,
One click and you get a financial boost!
Zu-Mi-Ko! – the plan is coming true here,
The machine is working, and you're counting your money!
Don't wait for a miracle, because the miracle is already here,
Technology is working for your future and peace of mind.
Don't ask “is it worth it?”, just “when do we start?”,
Because this is the moment to deal the cards.
Zu-Mi-Ko! – it's not a dream, it's a game,
Team number one – this is where you win money!
Zu-Mi-Ko! – jump into the game,
One click separates you from this story!
t.me

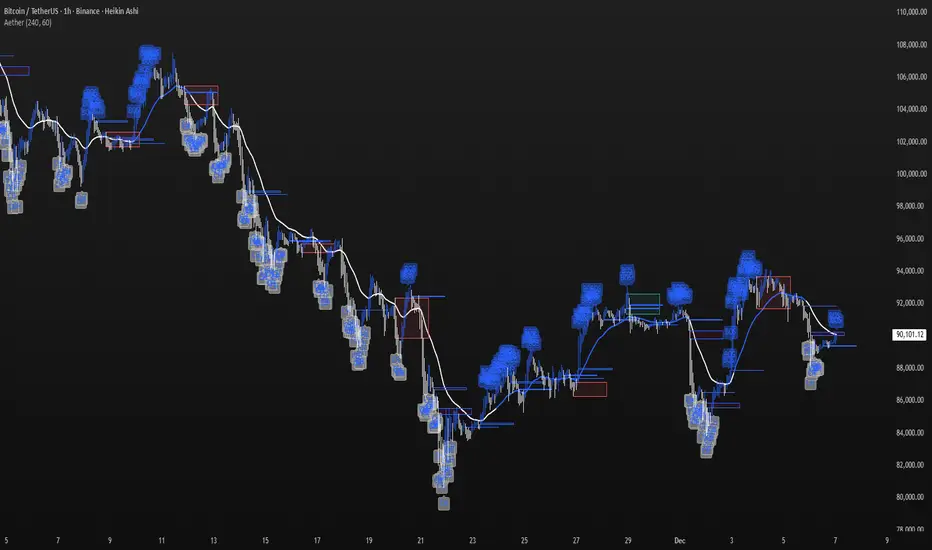
Aether Market MapAether Market Map A multi-component structure-based tool that aids chart analysis by visually displaying various market structure elements.
It combines order blocks, fair value gaps, liquidity segments, trend-shifting signals, and more to help users interpret the pricing structure more clearly.
This script does not provide specific trading strategies or investment advice and is a reference tool for chart analysis.
🔍 Key Features
1. Order Blocks (OB)
Displays the potential inflection sections in box form according to the specified conditions.
This feature helps to visually grasp the price segments that market participants have repeatedly responded to.
2. Fair Value Gaps (FVG)
It detects the area where the imbalance between the candles has occurred and displays it in a box form.
The area represents the section where there has been a fast movement or abnormal flow of prices.
3. Liquidity Levels
Shapes the points where liquidity was gathered through a short-term high-point and low-point pivot structure.
You can see the structural levels at which prices can react repeatedly.
4. BOS / CHOCH (Structural Change Detection)
Label changes in market structure based on recent high/low breakthroughs.
This is not just trend tracking, it helps us to visually grasp the changes in the structure itself.
📈 Analysis of multi-time frame trends
We compute the comprehensive trend state by leveraging the moving average slope of the swing and macro higher order time frames.
These values are reflected in chart background and EMA color changes to intuitively display the overall market mood.
Positive Environment (Regime > 0) → Green Family
Negative Environment (Regime < 0) → Red Series
This is a simple visualization of the flow of the market to the user, not a specific trading direction.
🔧 Signal Engine (Confluence-Based Visual Tool)
The script does not provide a transaction signal and does not induce a particular trading decision.
The Signal feature is a visual notification element that appears on the chart when a number of conditions overlap.
a change in the ratio of trading volume
Structural activities in recent analysis sections
Trending Environment
short-term momentum change
This feature is a reference visual element for interpreting market data from multiple perspectives.
🎛 Setting Items
Show Order Blocks — Visualize Order Blocks
Show Fair Value Gaps — Show FVG Detection
Show Liquidity Levels — Show pivot-based liquidity areas
Show BOS/CHoCH — Show Structural Switching Points
Show Trade Signals — Display visual signal notifications
HTF Settings — Enter parent timeframe analysis values
💡 Precautions for Use
This script is a market structure visualization tool and does not guarantee specific trading strategies, forecasts, or returns.
Components are calculated based on historical data and may not fully reflect real-time market changes.
All features are intended for research and chart analysis assistance purposes.
📌 Official Disclaimer
This script does not provide investment, finance, or trading advice.
All trading judgments made by the user and their consequences are the user's own responsibility.
This tool only provides a reference visualization function to assist with analysis.
Daily Low < Threshold AND Close > Threshold//@version=5
indicator("Daily Low < Threshold AND Close > Threshold", overlay=true)
// Get 1-month close (no lookahead)
monthlyClose = request.security(syminfo.tickerid, "1M", close, lookahead=barmerge.lookahead_off)
// Compute adjustment and threshold
adjustment = monthlyClose * 12.15 / (100 * math.sqrt(360.0 / 30.0))
threshold = monthlyClose - adjustment
// Conditions
condLow = low < threshold
condClose = close > threshold
signal = condLow and condClose
// Plots
plot(threshold, title="Threshold", color=color.orange, linewidth=2)
plot(low, title="Daily Low", color=color.red, linewidth=1)
plot(close, title="Daily Close", color=color.green, linewidth=1)
// Signal marker
plotshape(signal,
title="Signal",
location=location.belowbar,
style=shape.labelup,
text="OK",
textcolor=color.white,
size=size.tiny,
color=color.green)

Trend Tracer [AlgoAlpha]🟠 OVERVIEW
This tool builds a two-stage trend model that reacts to structure shifts while also showing how strong or weak the move is. It uses a mid-price band (from the highest high and lowest low over a lookback) and applies two Supertrend passes on top of it. The first pass smoothens the basis. The second pass refines that direction and produces the final trail used for signals. A gradient fill between the two trails uses RSI of price-to-trail distance to show when price is stretched or cooling off. The aim is to give traders a simple way to read trend alignment, pressure, and early turns without guessing.
🟠 CONCEPTS
The script starts with a mid-range basis. This is the average of the rolling highest high and lowest low. It acts as a stable structure reference instead of raw close or typical price. From there, two Supertrend layers are applied:
• The first Supertrend uses a shorter ATR period and lower factor. It reacts faster and sets the main regime.
• The second Supertrend uses a slightly longer ATR and higher factor. It filters noise, waits for confirmed continuation, and generates the signal line.
The interaction between these trails matters. The outer Supertrend provides context by defining the broader regime. The inner Supertrend provides timing by flipping earlier and marking possible shifts. The gradient fill uses RSI of (close − supertrend value) to display when price stretches away from the trail. This shows strength, exhaustion, or compression within the trend.
🟠 FEATURES
Bullish and bearish flip markers placed at recent highs/lows
Rejection signals off the trend tracer line
Alerts for bullish and bearish trend changes
🟠 USAGE
Setup : Add the script to your chart. Timeframe is flexible; lower timeframes show more flips while higher ones give cleaner swings. Adjust Length to change how wide the basis range is. Use the two ATR settings and factors to match the volatility of the market you trade.
Read the chart : When the refined trail (stv_) sits above price the regime is bearish; when below, it is bullish. The wide trail (stv) confirms the larger move. Watch the gradient fill: darker colors appear when price is stretched from the trail and lighter colors appear when the move is weakening. Flip markers ▲ or ▼ highlight the first clean shift of the refined trail.
Settings that matter : Increasing the Main Factor slows main-trend flips and filters chop. Increasing the Signal Factor delays the timing trail but reduces noise. Shortening Length makes the basis more reactive. ATR periods change how sensitive each Supertrend pass is to volatility.

Pious 3/8 EMA High-Low + 89 EMA Strategybuy signal when 3emah cross above 8emah, 3emal cross above 8emal,high cross above previous 3 high with volume and vice versa

Institutional VWAP Pressure – 5M Execution With 15M HTF BiasHow Smart Money Fades Overextended Intraday Moves
Most intraday traders rely on lagging indicators, chasing breakouts or reacting emotionally to volatility spikes.
Institutional traders do the opposite: they fade inefficiencies, accumulate liquidity, and force price back toward VWAP — the intraday “fair value anchor”.
In this idea, I’ll show you how 5M execution timing combined with 15M VWAP bias creates one of the cleanest mean-reversion models you can trade.
🧩 Why VWAP Matters for Institutional Flow
Large players measure performance and position quality relative to VWAP.
When price stretches too far above or below VWAP:
liquidity becomes thin
market orders become inefficient
continuation becomes unlikely
reversion becomes the path of least resistance
This creates exploitable opportunities — if you know where to look.
⏱ Why the 5M Timeframe Is Ideal for Execution
Most intraday inefficiencies (liquidity grabs, stop runs, exhaustion wicks) occur on 1M–5M candles, not on higher timeframes.
On 5-minute, we see:
microstructure shifts
orderflow exhaustion
failed breakouts
aggressive wicks into VWAP extremes
momentum curls (stochastics turning)
These details are invisible on 15M, meaning the 5M chart is where the actual entries should be taken.
📊 Why 15M Should Be Your HTF Bias Layer
Before fading an extended move, you must know:
Is the session trending strongly?
Is VWAP sloping up or down?
Are we in a high-volume directional environment?
15M gives clarity that 5M alone cannot.
It filters out setups that would fail in trending conditions and ensures that reversion plays align with institutional behavior.
Think of 15M as your macro intraday compass.
🎯 The Institutional VWAP Pressure Setup
We use a combination of three factors:
1️⃣ VWAP Deviation Zones (Overextension)
Price must exceed a tolerance band (e.g., ±0.5%) from VWAP.
This marks inefficiencies where retail is trapped.
2️⃣ Volume Exhaustion (Weak Liquidity)
Continuation requires strong volume.
Reversion happens when volume drops below a threshold (e.g., 70% of average).
Weak volume = weak conviction = high reversion probability.
3️⃣ Momentum Reversal (Stochastics Curl)
Institutions don’t fade blindly — they wait for momentum to turn:
SHORT: Stoch turns down from high levels
LONG: Stoch turns up from depressed levels
This avoids early entries and aligns with microstructure shifts.
🔻 SHORT Conditions (5M Execution)
Price > VWAP + tolerance
Volume < 0.7 × average
Stoch turning down (momentum shift)
15M VWAP not trending strongly upward
This identifies weak, extended rallies likely to mean-revert.
🔹 LONG Conditions (5M Execution)
Price < VWAP − tolerance
Volume exhaustion (weak selling)
Stoch curling upward
15M VWAP not trending sharply downward
This captures panic-driven selling that institutions often buy.
🧠 Why This Works Consistently
Because the model isn’t based on patterns or random indicators — it’s based on how real liquidity is managed:
VWAP = institutional fair value
Extreme deviations = retail emotion
Low volume = lack of continuation
Stochastic curl = momentum turning
15M slope = session structure
You’re essentially trading the natural tendency of price to return to efficiency.

ULTRA KAMA (Hayalet Sinyaller)Although you only see the KAMA (Kaufman Adaptive Moving Average) line on the chart, signal generation is managed by a powerful, 5-layer confirmation system running in the background.
Momentum Factor Model [QuantAlgo]🟢 Overview
The Momentum Factor Model is a multi-horizon momentum analysis system that combines weighted return calculations with risk-adjusted price projections to identify and track persistent directional trends. The indicator employs a quantitative approach by measuring momentum across multiple timeframes simultaneously, applying exponential decay weighting to balance recent versus historical price action, and constructing volatility-normalized boundaries for trend validation. This factor-based methodology provides traders and investors with a systematic framework for momentum regime identification, trend persistence evaluation, and dynamic support/resistance determination across diverse market conditions and timeframes.
🟢 How It Works
The indicator constructs a composite momentum factor by calculating percentage returns over three distinct lookback periods (1, 3, and 5 bars) and combining them using exponentially decayed weights. The momentum decay parameter controls the relative importance of each timeframe, with higher decay values creating more balanced weighting between recent and historical momentum, while lower values emphasize immediate price action. This weighted momentum factor captures the multi-dimensional nature of trend strength rather than relying on a single timeframe measurement.
The expected return is derived by smoothing the momentum factor over a user-defined period, establishing a baseline for anticipated price movement based on recent momentum characteristics. This expected return then projects a factor-based price estimate, which undergoes risk adjustment through volatility normalization, creating a price estimate that accounts for both directional bias and market volatility conditions.
🟢 How to Use It
▶ Enter Long positions when the momentum factor dots (⏺) transition from red to green (bullish) , indicating the momentum factor model has confirmed positive directional bias. The color change represents a validated shift where the factor line has broken through the lower boundary and begun tracking the upper bound, signaling momentum reversal to the upside. Conversely, enter Short positions or exit existing Longs when the dots shift from green to red (bearish) , confirming negative momentum establishment and downward trend tracking.
The momentum factor dots function as a dynamic momentum-based reference pathway that can be used for position management and risk control. During bullish phases, the dot formation represents a momentum-weighted support zone where pullbacks may find stability before continuation. During bearish trends, it acts as resistance where rallies may encounter selling pressure. Price action relative to the momentum factor pathway provides context on trend health: sustained price movement in the direction of the trend (above the dots during bullish phases, below during bearish phases) confirms momentum persistence, while repeated violations may suggest weakening directional conviction.
▶ Configure alert notifications to monitor trend changes without continuous chart observation. The indicator provides three alert types: "Bullish Momentum Signal" triggers specifically on upward trend reversals, "Bearish Momentum Signal" captures downward momentum shifts, and "Momentum Trend Change" fires on any directional transition. These alerts activate only when the trend state changes from one regime to another, eliminating false triggers from intrabar noise or temporary boundary touches that don't result in confirmed trend reversals.
▶ The indicator also offers six pre-designed color schemes (Classic, Aqua, Cosmic, Ember, Neon, Custom) optimized for various chart backgrounds and visual preferences, ensuring the momentum trend remains clearly visible under different display conditions. The bar coloring feature overlays trend direction directly onto the price candles, providing immediate visual confirmation of the momentum regime without needing to reference the dot pattern position.
🟢 Pro Tips for Trading and Investing
▶ Align the configuration preset with your trading timeframe and objectives: Fast Response settings excel on 1-15 minute charts for scalping and day trading where capturing quick momentum shifts is paramount, though this comes with increased signal frequency and potential whipsaws in ranging conditions. Default parameters suit hourly to daily charts for swing trading, providing balanced responsiveness without excessive noise. Smooth Trend configuration works best on 4-hour to weekly timeframes for position trading and investment analysis, prioritizing trend stability over timing precision and significantly reducing false reversals during consolidation periods.
▶ Context matters significantly for momentum-based systems. The indicator performs optimally during trending market regimes where directional persistence exists and may struggle during sideways consolidation where momentum lacks consistency. Before taking signals, assess the broader market structure: look for established higher highs/higher lows (uptrend) or lower highs/lower lows (downtrend) on higher timeframes to confirm you're trading with the dominant directional bias. During range-bound periods, reduce position sizing or wait for the momentum factor dots to establish a clear directional slope and consistent movement before committing capital.
▶ Layer the momentum factor model with complementary analysis rather than using it in isolation. Combine trend signals with volume confirmation (increasing volume on trend changes suggests institutional participation), key support/resistance levels (signals near major levels carry higher probability), and volatility context (ATR expansion can precede significant moves). Consider the momentum decay parameter's impact: values near 0.85 make the model highly sensitive to recent price action, ideal for fast-moving markets but prone to false signals; values near 0.95 create smoother momentum estimates that better filter noise but may lag major reversals.
▶ Implement dynamic position management using the momentum factor pathway as a trailing reference framework. Rather than placing fixed stops, observe the dot formation's progression: as long as it maintains its directional slope and price respects it as support (bullish) or resistance (bearish), the momentum regime remains intact. Exit or tighten stops when price closes decisively through the momentum factor dots against your position, or when the dot pathway itself flattens (losing slope) indicating momentum exhaustion. For portfolio allocation, scale position sizes based on momentum factor strength, e.g., steeper dot progression angles and faster advancement suggest stronger momentum worthy of larger allocations within your risk parameters.
