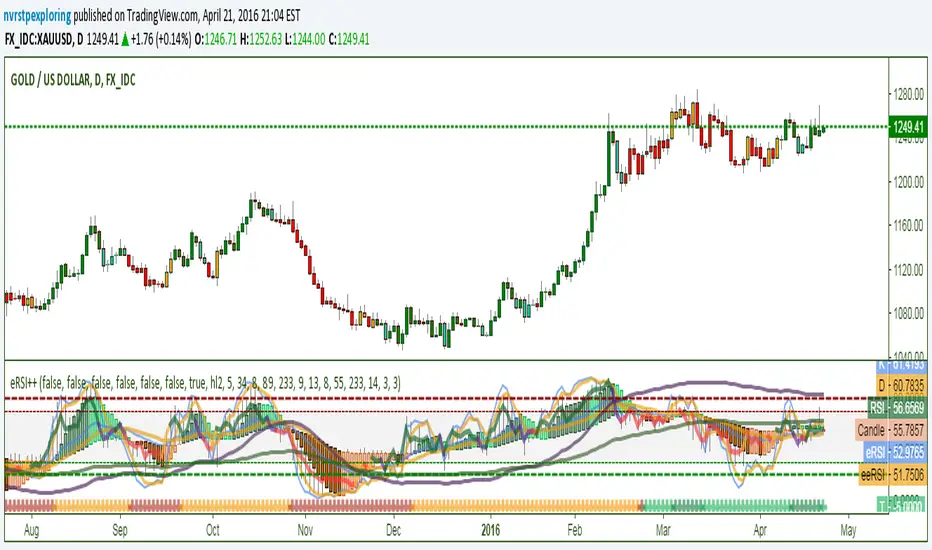
Contains RSI; EMA of RSI; EMA of EMA of RSI; Stochastic Oscillator; 2 Inverse Fisher Transforms on RSI - IFRSI89 and IFRSI233 XOVER on higher timeframes from oversold/overbought is useful signal; RSI Trend/Divergence Candles with color variation based on multiple RSI length detection of trend decay; Chart candle overlay coloring based on RSI, eRSI, and eeRSI EMA55 & EMA233 Xover indicator on bottom for trend direction with color variations for counter trend movements.
//eRSI++ by NVRSTPEXPLORING. //Contains RSI; EMA of RSI; EMA of EMA of RSI; Stochastic Oscillator; //2 Inverse Fisher Transforms on RSI - IFRSI89 and IFRSI233 XOVER on higher timeframes from oversold/overbought is useful signal //RSI Trend/Divergence Candles with color variation based on multiple RSI length detection of trend decay //Chart candle overlay coloring based on RSI, eRSI, and eeRSI //EMA55 & EMA233 Xover indicator on bottom for trend direction with color variations for counter trend movements study(title="eRSI++") //Inputs HC = input(title='Hide RSI Candles?', type=bool, defval=true) HO = input(title='Hide Color Overlay?', type=bool, defval=true) HS = input(title='Hide STOCH?', type=bool, defval=true) HT = input(title='Hide HTF EMA TrendBar?', type=bool, defval=false) HF = input(title='Hide Fisher?', type=bool, defval=false) HE = input(title='Hide eRSI?', type=bool, defval=true) HL = input(title='Use high/low?', type=bool, defval=true) src2 = input(title='Source Series:', type=source, defval=hl2) len0= input(5, minval=1, title="Candle Fast-5:") len4= input(34, minval=1, title="Candle Slow-34:") sm1 = input(title='Candle Smooth-8:', type=integer, defval=8) sm2 = input(title='Fisher-89:', type=integer, defval=89) sm3 = input(title='Fisher-233:', type=integer, defval=233) len1 = input(9, minval=1, title="RSI Length-9:") len2 = input(13, minval=1, title="EMA of RSI Length-13:") len3 = input(8, minval=1, title="EMA of eRSI Length-8:") len5 = input(55, minval=1, title="eRSI Fast-55:") len6 = input(233, minval=1, title="eRSI Slow-233:") len7= input(14, minval=1, title="Stoch Length-14:") len8= input(3, minval=1, title="K-3:") len9= input(3, minval=1, title="D-3:") //Variables src = close up = rma(max(change(src), 0), len1) dn = rma(-min(change(src), 0), len1) rsi = dn == 0 ? 100 : up == 0 ? 0 : 100 - (100 / (1 + up / dn)) eRSI = ema(rsi,len2) eeRSI = ema(eRSI,len3) eRSIF = ema(src,len5) eRSIS = ema(src,len6) fr = rsi(src2, len0) //Fast RSI and Slow RSI sr = rsi(src2, len4) sfr = sma(fr, sm1) //Smooth Fast RSI and Smooth Slow RSI ssr = sma(sr, sm1) rh = HL ? max(rsi(high, len0), rsi(high, len4)) : max(fr, sr) //RSI High Low for Candles rl = HL ? min(rsi(low, len0), rsi(low, len4)) : min(fr, sr) UpT= eRSIF>=eRSIS //Uptrend and Downtrend DnT= eRSIS>eRSIF Up1=sfr>=ssr isExp=abs(sfr-ssr)>=abs(sfr[1]-ssr[1]) k1 = ema(stoch(close, high, low, len7), len8) d1 = ema(k1, len9) //Inverse Fisher RSI calc_ifish_rsi(series, sm2) => v1=0.1*(series-50) v2=wma(v1,sm2) ifish=(((((exp(2*v2)-1)/(exp(2*v2)+1))+1)*100)/2) ifish calc_ifish_rsi2(series, sm3) => v1=0.1*(series-50) v2=wma(v1,sm3) ifish2=(((((exp(2*v2)-1)/(exp(2*v2)+1))+1)*100)/2) ifish2 //Plot ALL the Things h1= hline(80, title="OverBoughtStochastic", linestyle=dashed, linewidth=2, color=maroon) h2= hline(70, title="OverBoughtRSI", linestyle=dashed, linewidth=1, color=maroon) h3= hline(30, title="OverSoldRSI", linestyle=dashed, linewidth=1, color=green) h4= hline(20, title="OverSoldStochastic", linestyle=dashed, linewidth=2, color=green) fill(h2, h3, color=gray, transp=90) plotcandle(HC ? na: ssr, rh, rl, sfr, title='Candle', color=Up1 and isExp?#6CA77C :Up1 and not isExp? #71EEA3 :not Up1 and isExp?#b85d00: #eebca1) p1= plot(HS? na: k1, title="K", linewidth=2, color=#4885ed) p2= plot(HS? na: d1, title="D", linewidth=3, color=#EF9F07) p3= plot(HE? na: eRSI, title="eRSI", style=line, linewidth=2, color=#4885ed) p4= plot(HE? na: eeRSI, title="eeRSI", style=line, linewidth=3, color=#EF9F07) p5= plot(rsi, title="RSI", style=line, linewidth=4, color= eRSI > eeRSI and rsi > eeRSI ? #0b6125 : eRSI >= eeRSI and rsi <= eeRSI ? #6B229F: eRSI < eeRSI and rsi < eeRSI ? #fd3232 : eRSI <= eeRSI and rsi >= eeRSI ? #ffbb39 : na) //Alt color scheme plot(rsi, title="RSI", style=line, linewidth=4, color= eRSI > eeRSI and rsi > eeRSI ? green : eRSI >= eeRSI and rsi <= eeRSI ? #1ABC9C: eRSI < eeRSI and rsi < eeRSI ? red : eRSI <= eeRSI and rsi >= eeRSI ? #F39C12 : na) p6= plot(HF? na: calc_ifish_rsi(rsi(src, len1),sm2), color=#4A235A, title='F89', linewidth=3) p7= plot(HF? na: calc_ifish_rsi2(rsi(src, len1),sm3), color=#335A23, title='F233', linewidth=3) plot(HT? na: 0-5, title="T", style=cross, linewidth=4, color=UpT and Up1? #1E8449 :UpT and not Up1? #28B463 : DnT and not Up1? #B03A2E : DnT and Up1? #F39C12: na) barcolor(HO? na: eRSI > eeRSI and rsi > eeRSI ? green : eRSI >= eeRSI and rsi <= eeRSI ? #1ABC9C : eRSI < eeRSI and rsi < eeRSI ? red : eRSI <= eeRSI and rsi >= eeRSI ? #F39C12 : na)