OPEN-SOURCE SCRIPT
CryptoMedication's Volatility RSI
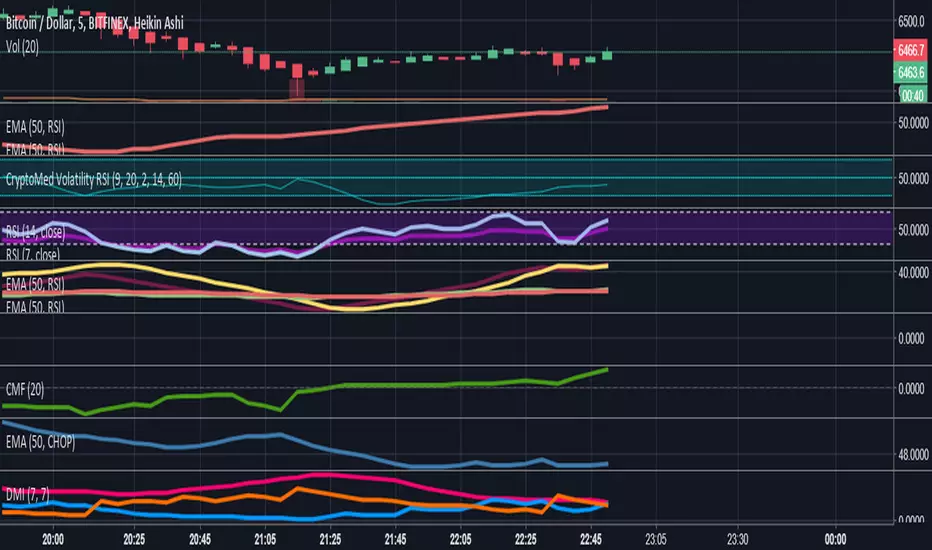
So, here's what we ended up doing for the most recent one that we created.
1. We took the ATR (Average True Range) - You can read about that here: medium.com/thedailydose/average-true-range-atr-lesson-26ee37c599cd
2. Then applied the Bollinger Bands %B to it
3. Then overlayed it with another indicator
Purpose:
The general purpose of this indicator is to identify when there are periods of consolidation or if there were be a large increase in the price (going either way). However, we were able to plug this in so that it connected with the RSI (after cancelling out the noise and smoothing values*making it scaled out evenly), so that it also produces buy/sell signals.
If you're interested to get a more in-depth overview of how this works, visit this link here: medium.com/thedailydose/cryptomedication-volatility-rsi-72d6dcc2d8bb
Skrypt open-source
W zgodzie z duchem TradingView twórca tego skryptu udostępnił go jako open-source, aby użytkownicy mogli przejrzeć i zweryfikować jego działanie. Ukłony dla autora. Korzystanie jest bezpłatne, jednak ponowna publikacja kodu podlega naszym Zasadom serwisu.
Wyłączenie odpowiedzialności
Informacje i publikacje nie stanowią i nie powinny być traktowane jako porady finansowe, inwestycyjne, tradingowe ani jakiekolwiek inne rekomendacje dostarczane lub zatwierdzone przez TradingView. Więcej informacji znajduje się w Warunkach użytkowania.