PROTECTED SOURCE SCRIPT
Smart Volume [Volume Hub]
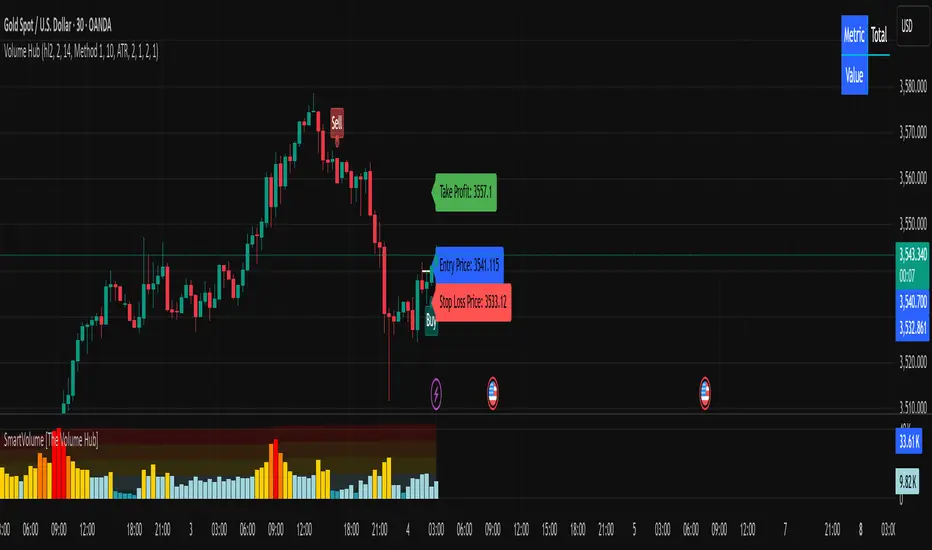
Smart Volume [Volume Hub] is a custom indicator designed to highlight meaningful changes in market activity by measuring how current volume compares to historical averages. Instead of looking at raw volume alone, it calculates how many standard deviations above or below the mean a bar’s volume is. This makes it possible to identify unusual activity (accumulation, distribution, breakouts, or fakeouts) that might not be visible just by looking at candle size or price action.
The script classifies each bar’s volume into zones:
🔴 Extra High: 4× or more standard deviations above average
🟠 High: 2.5× above average
🟡 Medium: 1× above average
🔵 Normal: around average
🟢 Low: below average
Each classification has its own color, which is applied directly to the volume histogram. This provides a quick “heatmap” effect so traders can instantly see when markets are entering phases of unusually high or unusually low participation.
🔑 How It Works
The script computes a moving average of volume over the last 610 bars.
It calculates the standard deviation of volume over the same lookback.
For each bar, it measures how far that bar’s volume is from the average, expressed in multiples of standard deviation.
Depending on the zone it falls into (low, normal, medium, high, or extra high), the bar is colored accordingly.
Background heatmap zones and threshold lines can optionally be displayed to help visualize where each threshold lies.
This approach goes beyond raw volume numbers by showing relative extremes. For example, a 50K-volume bar on one market might mean nothing, but if it’s 4 standard deviations higher than usual, it’s an “extra high” signal of market participation.
📌 How to Use It
Look for clusters of extra-high volume bars to spot institutional activity or breakout confirmation.
Use low-volume areas to identify possible consolidations, false breakouts, or lack of conviction.
Combine with your trend or price-action tools: e.g., if price breaks resistance on extra high volume, the move is more likely valid.
Works across all markets (stocks, forex, crypto, futures) and timeframes.
⚠️ Disclaimer
This script does not generate buy/sell signals. It is a volume analysis tool to help identify areas of high or low activity. Always combine with proper risk management and other forms of analysis.
Skrypt chroniony
Ten skrypt został opublikowany jako zamknięty kod źródłowy. Można z tego korzystać swobodnie i bez żadnych ograniczeń — więcej informacji znajduje się tutaj.
Wyłączenie odpowiedzialności
Informacje i publikacje nie stanowią i nie powinny być traktowane jako porady finansowe, inwestycyjne, tradingowe ani jakiekolwiek inne rekomendacje dostarczane lub zatwierdzone przez TradingView. Więcej informacji znajduje się w Warunkach użytkowania.