OPEN-SOURCE SCRIPT
Climax Detector (Buy & Sell)
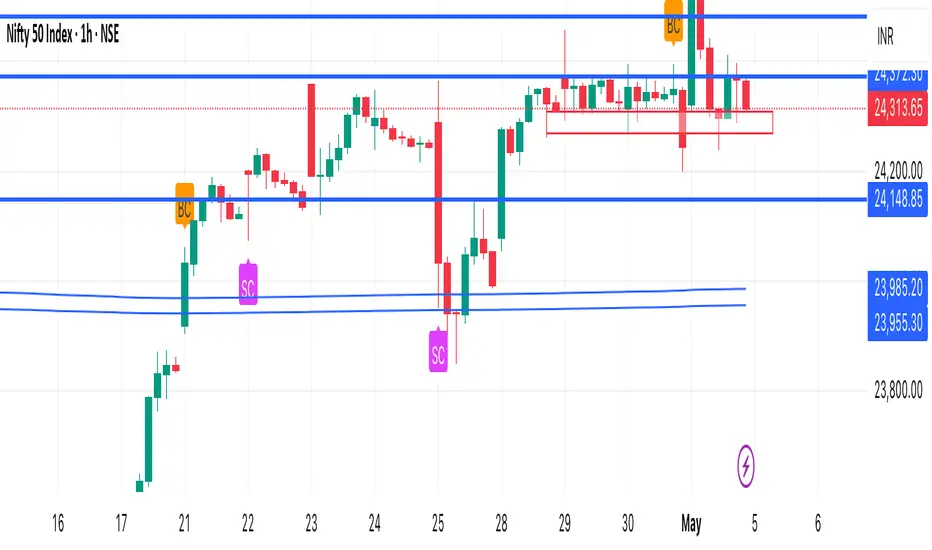
This indicator identifies potential Buying Climax (BC) and Selling Climax (SC) events based on volume spikes relative to historical averages.
• Buying Climax (BC):
• Detected when a green candle forms with volume significantly higher than the average (default: 2×).
• Often signals the end of an uptrend or distribution phase.
• Selling Climax (SC):
• Detected when a red candle forms with very high volume (default: 2× average).
• Often occurs at the end of a downtrend, suggesting panic selling and potential accumulation.
How it works:
• Calculates a moving average of volume over a user-defined period (default: 20 candles)
• Flags a climax when current volume exceeds the defined multiplier (default: 2.0×)
• Marks:
• BC with an orange triangle above the bar
• SC with a fuchsia triangle below the bar
Customizable Settings:
• Volume spike sensitivity
• Lookback period for average volume
Use Cases:
• Spot possible trend exhaustion
• Confirm Wyckoff phases
• Combine with support/resistance for reversal entries
Disclaimer: This tool is designed to assist in identifying high-probability exhaustion zones but should be used alongside other confirmations or strategies.
Skrypt open-source
W zgodzie z duchem TradingView twórca tego skryptu udostępnił go jako open-source, aby użytkownicy mogli przejrzeć i zweryfikować jego działanie. Ukłony dla autora. Korzystanie jest bezpłatne, jednak ponowna publikacja kodu podlega naszym Zasadom serwisu.
Wyłączenie odpowiedzialności
Informacje i publikacje nie stanowią i nie powinny być traktowane jako porady finansowe, inwestycyjne, tradingowe ani jakiekolwiek inne rekomendacje dostarczane lub zatwierdzone przez TradingView. Więcej informacji znajduje się w Warunkach użytkowania.