OPEN-SOURCE SCRIPT
Volume Density Analysis
Volume Density Analysis
Overview
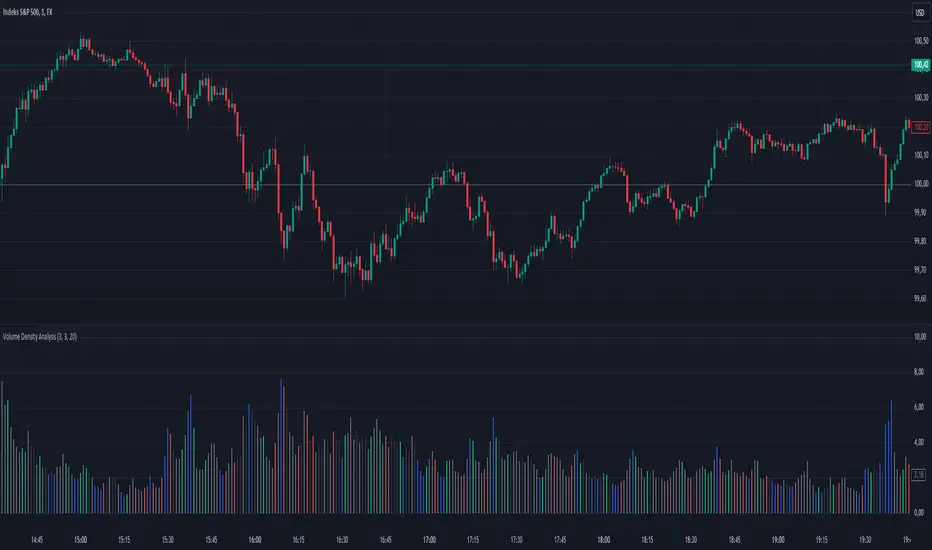
The "Volume Density Analysis" indicator is designed to provide traders with insights into volume dynamics relative to price movements. By analyzing the density of volume against price spread, this indicator helps identify potential reversal points and extreme volume conditions, enhancing decision-making in trading strategies.
Key Features
Volume Density Calculation: The indicator computes the density of volume by dividing the total volume by the price spread (high - low) for each bar. This allows for a more nuanced understanding of volume activity in relation to price movements.
Extremum Detection: Users can specify the number of bars to consider when identifying extreme volume conditions, allowing for tailored analysis based on market behavior.
Reversal Bar Conditions: The indicator includes options to determine if low or high volume bars must coincide with reversal patterns, providing additional context for potential trade signals.
Dynamic Coloring*: The histogram displays colored bars based on specific conditions:
Blue Bars: Indicate the lowest and highest volume density within a specified range, highlighting significant volume extremes.
Gray Bars: Represent lower or higher volume density that meets reversal criteria.
Green and Red Bars: Indicate bullish or bearish reversal signals based on historical density patterns.
User Inputs
nl: Number of previous lower bars to consider for comparison (default is 8).
nh: Number of previous higher bars to consider for comparison (default is 8).
ext: Number of bars for detecting extremum volume (default is 30).
LReversalBar: Boolean option to determine if low volume bar spread must indicate a reversal.
HReversalBar: Boolean option to determine if high volume bar spread must indicate a reversal.
Suggested Timeframes
M15: Without reversal considerations, use `nl=3`, `nh=3`, and `ext=20`.
M5: Without reversal considerations, use `nl=4`, `nh=4`, and `ext=35`.
M1: Use `nl=8`, `nh=8`, and `ext=58` for more detailed analysis.
Overview
The "Volume Density Analysis" indicator is designed to provide traders with insights into volume dynamics relative to price movements. By analyzing the density of volume against price spread, this indicator helps identify potential reversal points and extreme volume conditions, enhancing decision-making in trading strategies.
Key Features
Volume Density Calculation: The indicator computes the density of volume by dividing the total volume by the price spread (high - low) for each bar. This allows for a more nuanced understanding of volume activity in relation to price movements.
Extremum Detection: Users can specify the number of bars to consider when identifying extreme volume conditions, allowing for tailored analysis based on market behavior.
Reversal Bar Conditions: The indicator includes options to determine if low or high volume bars must coincide with reversal patterns, providing additional context for potential trade signals.
Dynamic Coloring*: The histogram displays colored bars based on specific conditions:
Blue Bars: Indicate the lowest and highest volume density within a specified range, highlighting significant volume extremes.
Gray Bars: Represent lower or higher volume density that meets reversal criteria.
Green and Red Bars: Indicate bullish or bearish reversal signals based on historical density patterns.
User Inputs
nl: Number of previous lower bars to consider for comparison (default is 8).
nh: Number of previous higher bars to consider for comparison (default is 8).
ext: Number of bars for detecting extremum volume (default is 30).
LReversalBar: Boolean option to determine if low volume bar spread must indicate a reversal.
HReversalBar: Boolean option to determine if high volume bar spread must indicate a reversal.
Suggested Timeframes
M15: Without reversal considerations, use `nl=3`, `nh=3`, and `ext=20`.
M5: Without reversal considerations, use `nl=4`, `nh=4`, and `ext=35`.
M1: Use `nl=8`, `nh=8`, and `ext=58` for more detailed analysis.
Skrypt open-source
W zgodzie z duchem TradingView twórca tego skryptu udostępnił go jako open-source, aby użytkownicy mogli przejrzeć i zweryfikować jego działanie. Ukłony dla autora. Korzystanie jest bezpłatne, jednak ponowna publikacja kodu podlega naszym Zasadom serwisu.
Wyłączenie odpowiedzialności
Informacje i publikacje nie stanowią i nie powinny być traktowane jako porady finansowe, inwestycyjne, tradingowe ani jakiekolwiek inne rekomendacje dostarczane lub zatwierdzone przez TradingView. Więcej informacji znajduje się w Warunkach użytkowania.